

Key Insights
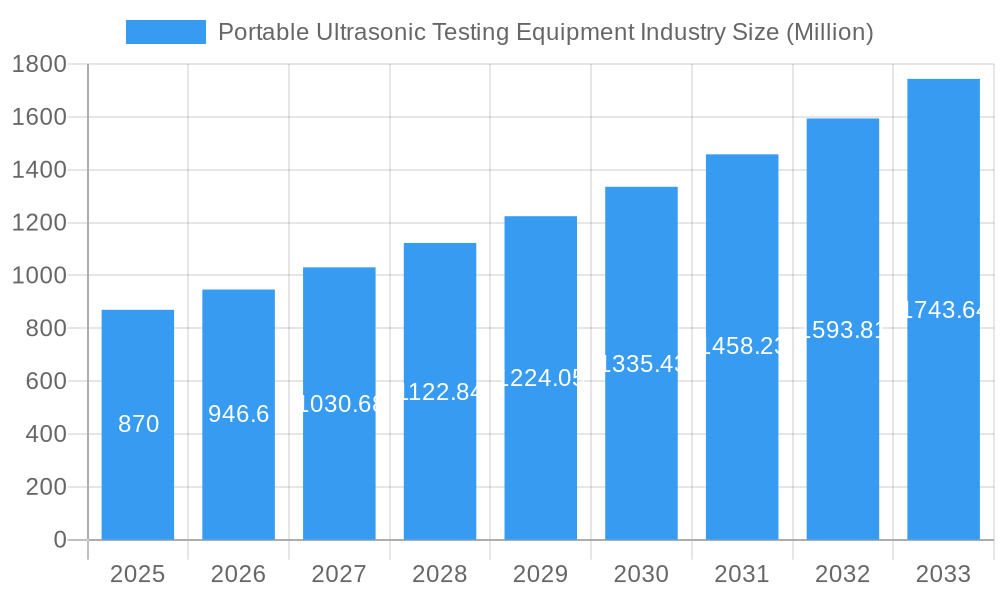
The global portable ultrasonic testing (UT) equipment market, valued at $0.87 billion in 2025, is poised for robust growth, exhibiting a compound annual growth rate (CAGR) of 8.79% from 2025 to 2033. This expansion is driven by several key factors. Increasing demand for non-destructive testing (NDT) methods across diverse sectors like aerospace, automotive, and energy fuels the market's growth. The rising adoption of advanced UT technologies, such as phased array and time-of-flight diffraction (TOFD) techniques, offering enhanced accuracy and efficiency, significantly contributes to market expansion. Furthermore, stringent quality control regulations in manufacturing and construction necessitate the use of portable UT equipment, driving market demand. The market is segmented by product type (manual, automated, handheld) and application (aerospace, manufacturing, automotive, energy, construction). The handheld segment is expected to dominate due to its portability and ease of use in various field applications. Geographically, North America and Europe currently hold significant market share, driven by established industries and technological advancements. However, the Asia-Pacific region is projected to experience the fastest growth, fueled by rapid industrialization and infrastructure development in countries like China and India. The presence of key players like Olympus Corporation, Baker Hughes, and Intertek Group ensures a competitive landscape that fosters innovation and market expansion.
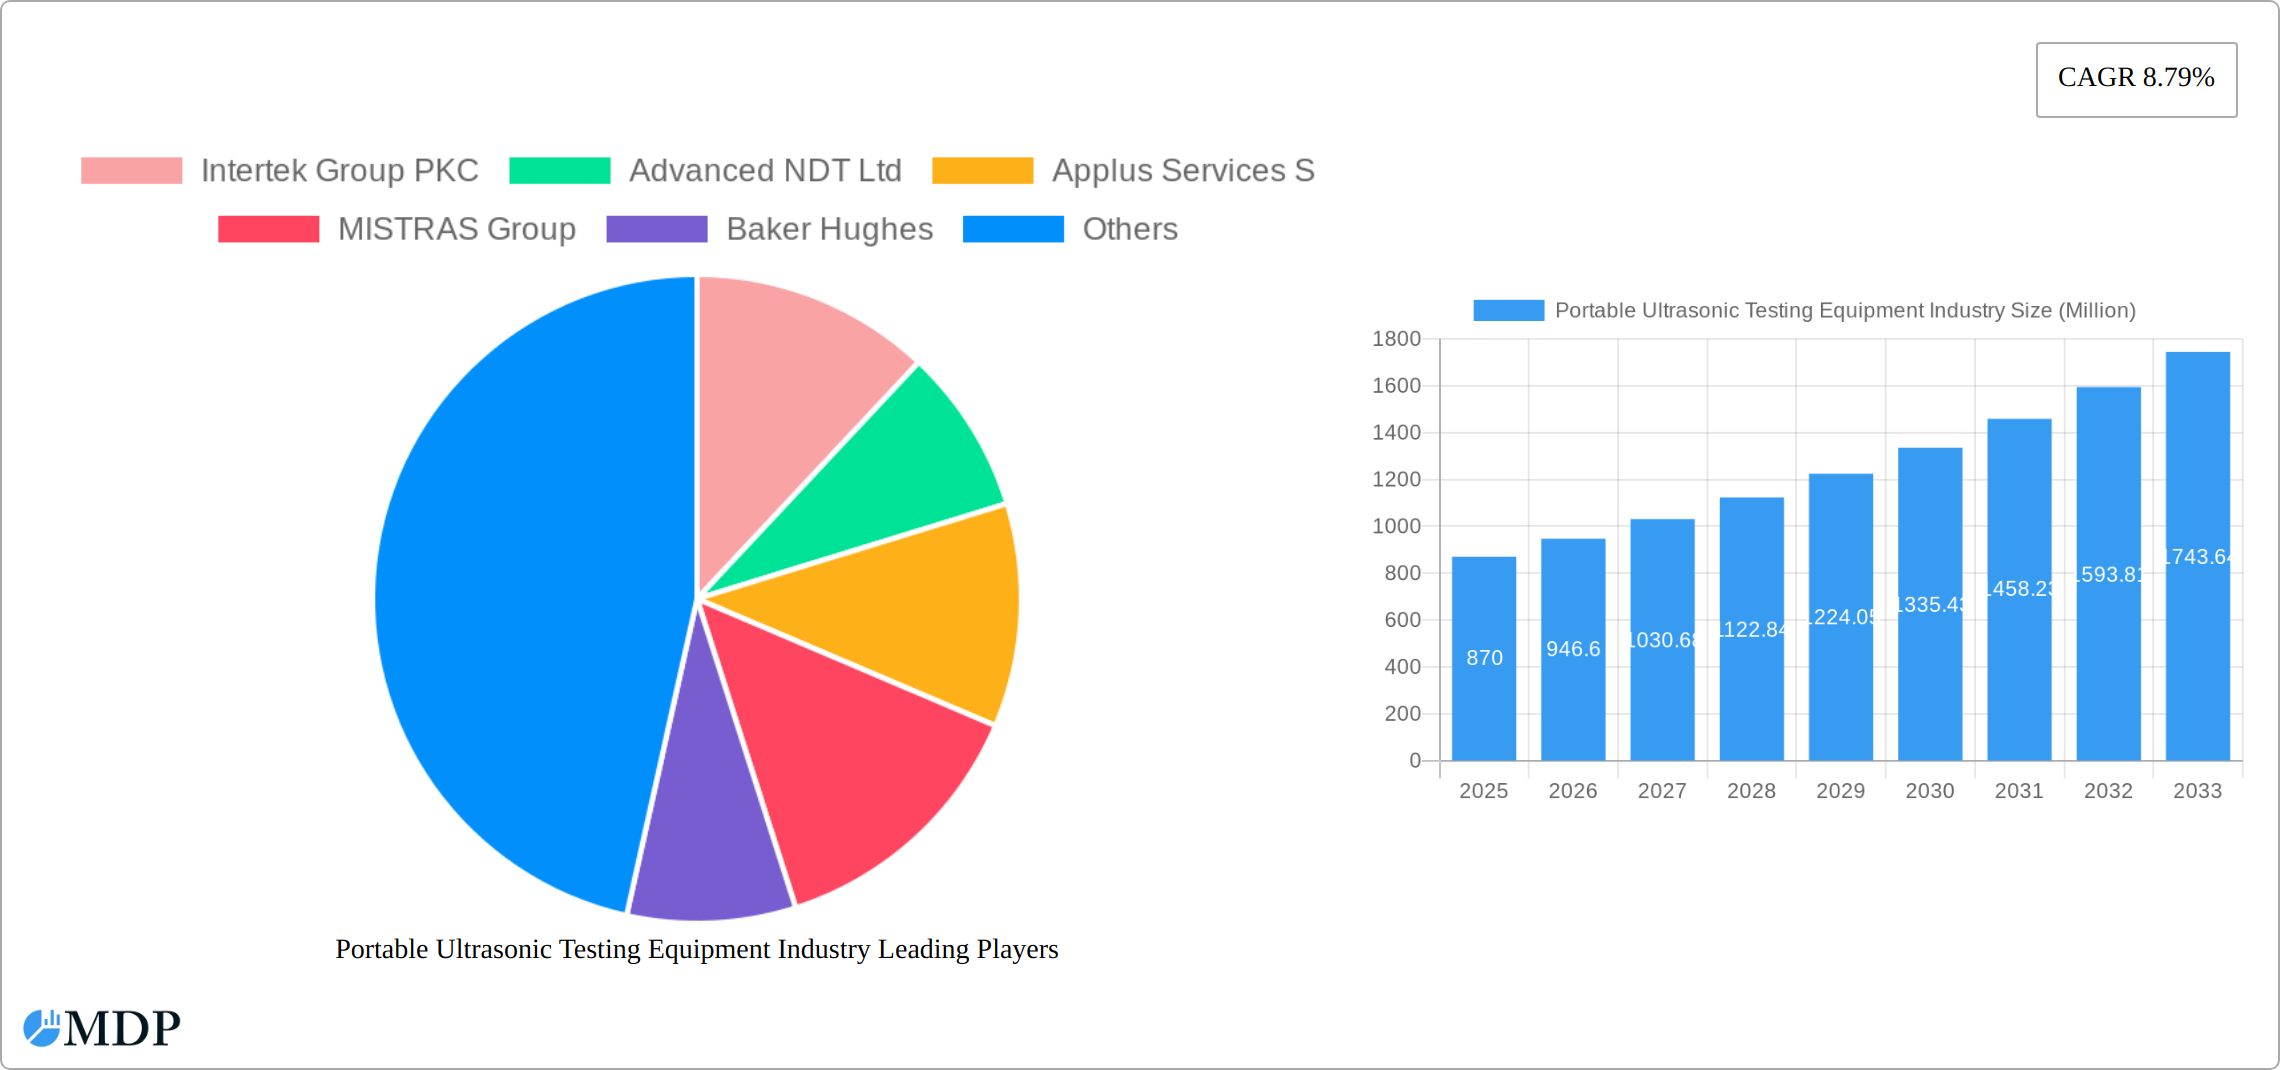
Portable Ultrasonic Testing Equipment Industry Market Size (In Million)
The restraints to market growth are primarily associated with the high initial investment costs of advanced UT equipment, particularly automated systems. The need for skilled personnel to operate and interpret UT results also presents a challenge, potentially limiting adoption in some regions. However, ongoing advancements in user-friendly interfaces and the availability of training programs are mitigating these concerns. The market is witnessing increasing adoption of cloud-based data management systems, enabling remote monitoring and analysis of inspection data, thereby further enhancing efficiency and reducing operational costs. This trend, combined with the continuous development of more portable, robust, and user-friendly equipment, will propel the market towards even greater expansion in the coming years. The overall outlook for the portable ultrasonic testing equipment market remains highly positive, with significant opportunities for growth across various segments and geographies.
Portable Ultrasonic Testing Equipment Industry Company Market Share
Portable Ultrasonic Testing Equipment Industry Market Report: 2019-2033
This comprehensive report provides a detailed analysis of the Portable Ultrasonic Testing Equipment industry, offering invaluable insights for stakeholders seeking to understand market dynamics, growth opportunities, and competitive landscapes. With a study period spanning 2019-2033, a base year of 2025, and a forecast period of 2025-2033, this report is your essential guide to navigating this evolving sector. The market is projected to reach xx Million by 2033, showcasing significant growth potential.
Portable Ultrasonic Testing Equipment Industry Market Dynamics & Concentration
The portable ultrasonic testing equipment market is characterized by a moderately consolidated structure, featuring several prominent players holding significant market shares. This concentration is influenced by a confluence of factors, including rapid technological advancements, the enforcement of rigorous regulatory frameworks, and the gradual emergence of alternative inspection technologies. The industry is witnessing consistent merger and acquisition (M&A) activity, underscoring the dynamic competitive environment and the ongoing pursuit of market consolidation. From 2019 to 2024, approximately XX M&A deals were recorded, reflecting a vibrant and evolving competitive landscape. Innovation serves as a primary catalyst, compelling companies to continuously develop more sophisticated, intuitive, and high-performance equipment. Furthermore, stringent regulatory mandates pertaining to safety and accuracy standards play a pivotal role in shaping market dynamics. The escalating demand from critical end-user sectors, including aerospace, automotive, and the energy industry, acts as a substantial driver for market expansion. The estimated market share distribution for 2024 is as follows:
- Top 5 Players: Approximately 60% combined market share
- Next 5 Players: Approximately 25% combined market share
- Remaining Players: Approximately 15% combined market share
Portable Ultrasonic Testing Equipment Industry Industry Trends & Analysis
The portable ultrasonic testing equipment market is currently experiencing robust and sustained growth, propelled by a multitude of influential factors. Key among these are technological advancements, such as significant improvements in sensor technology and the development of advanced data analysis capabilities, which collectively enhance the precision, efficiency, and inherent portability of testing equipment. The increasing embrace of automation across a wide spectrum of industries is directly fueling the demand for sophisticated automated ultrasonic testing solutions. Consumer preferences are demonstrably shifting towards more user-friendly, compact, and economically viable testing alternatives. The market's trajectory is also significantly shaped by the competitive interplay among major industry participants, leading to continuous innovation and competitive pricing strategies. For the forecast period spanning 2025-2033, the Compound Annual Growth Rate (CAGR) is projected to be approximately XX%, with a steady increase in market penetration across diverse industrial sectors. The heightened emphasis on non-destructive testing (NDT) methodologies for ensuring stringent quality control and critical safety compliance serves as a significant contributor to overall market expansion. Emerging technological disruptions, notably the integration of Artificial Intelligence (AI) and Machine Learning (ML) algorithms, are actively reshaping the industry landscape, enabling more efficient and accurate defect detection methodologies. The market exhibits substantial growth potential, particularly in developing economies undergoing rapid industrialization and infrastructure development.
Leading Markets & Segments in Portable Ultrasonic Testing Equipment Industry
The manufacturing and energy sectors are currently the dominant end-use applications for portable ultrasonic testing equipment, accounting for a combined xx% of the global market in 2024. The North American region holds the largest market share, driven by robust industrial activity and stringent quality control standards. Key drivers include:
Manufacturing:
- High demand for quality control in manufacturing processes.
- Stringent regulatory requirements for product safety.
- Growing automation in manufacturing plants.
Energy:
- Regular inspections and maintenance of pipelines and other critical assets.
- Growing emphasis on safety and reliability in the energy sector.
- Rising investments in renewable energy infrastructure.
Product Type Dominance:
- Handheld Ultrasonic Testing Equipment: This segment holds the largest market share due to its versatility, ease of use, and cost-effectiveness.
- Automated Ultrasonic Testing Equipment: This segment is experiencing faster growth due to increasing automation in various industries.
- Manual Ultrasonic Testing Equipment: While a smaller segment, this remains vital for specific applications where precise manual control is required.
Portable Ultrasonic Testing Equipment Industry Product Developments
Recent product innovations focus on enhancing portability, ease of use, and data analysis capabilities. Manufacturers are integrating advanced features such as improved display screens, more intuitive software interfaces, and data logging capabilities. The integration of AI and ML algorithms is enabling more accurate and efficient defect detection. These developments are improving the market fit by addressing the growing need for faster, more accurate, and cost-effective non-destructive testing solutions.
Key Drivers of Portable Ultrasonic Testing Equipment Industry Growth
Several pivotal factors are actively contributing to the substantial growth trajectory of the portable ultrasonic testing equipment market. Foremost among these are ongoing technological advancements, including enhancements in sensor technology and the evolution of sophisticated data analysis capabilities, which collectively lead to demonstrably improved testing accuracy and operational efficiency. Stringent regulatory mandates across various industries, mandating adherence to rigorous product safety and quality control standards, are a significant driver for the adoption of these essential devices. Furthermore, increased capital investments in infrastructure development, particularly within rapidly expanding emerging economies, are directly translating into a heightened demand for advanced NDT solutions. The accelerating adoption of automated and robotic inspection systems is also a key contributor to the market's expansion.
Challenges in the Portable Ultrasonic Testing Equipment Industry Market
The market faces challenges including the high initial investment cost of advanced equipment, the need for skilled technicians, and competition from substitute technologies. Supply chain disruptions and fluctuations in raw material prices can affect production costs and market stability. Stringent regulatory approvals and compliance requirements can pose significant barriers to entry for new market participants. These factors collectively influence market growth rates and profitability.
Emerging Opportunities in Portable Ultrasonic Testing Equipment Industry
The integration of advanced Artificial Intelligence (AI) and Machine Learning (ML) technologies into portable ultrasonic testing systems presents a wealth of significant opportunities for elevating accuracy and optimizing operational efficiency. The formation of strategic partnerships between leading equipment manufacturers and established NDT service providers holds the potential to unlock new avenues for market access and to broaden the scope of service offerings. Expansion into nascent and emerging markets, characterized by accelerating industrialization and robust infrastructure development, offers substantial and untapped growth potential. The development of more resilient and rugged equipment specifically designed to withstand harsh operating environments represents another critical area ripe for innovation and market expansion.
Leading Players in the Portable Ultrasonic Testing Equipment Industry Sector
- Intertek Group PLC
- Advanced NDT Ltd
- Applus Services S.A.
- MISTRAS Group
- Baker Hughes
- Russell Fraser Sales Pty Ltd
- OkoNDT group
- ROSEN Group
- Bureau Veritas SA
- Johnson and Allen Ltd
- Olympus Corporation
Key Milestones in Portable Ultrasonic Testing Equipment Industry Industry
- July 2022: Applus+ secures a major contract for non-destructive testing on maritime assets, highlighting the growing demand for ultrasonic testing in the maritime sector. This underscores the importance of robust and reliable portable ultrasonic testing equipment for critical infrastructure.
Strategic Outlook for Portable Ultrasonic Testing Equipment Industry Market
The future outlook for the portable ultrasonic testing equipment market is exceptionally promising, underpinned by relentless technological innovation, broadening adoption across a diverse range of industries, and an unwavering demand for enhanced safety and superior quality control. Companies that prioritize the development of cutting-edge features, such as AI-powered defect detection algorithms and intuitively designed user interfaces, will be strategically positioned for sustained success. The cultivation of strategic alliances and the proactive expansion into emerging global markets will be paramount for securing significant market share and fostering long-term, sustainable growth. The market's inherent potential for substantial expansion in the forthcoming years remains exceptionally strong.
Portable Ultrasonic Testing Equipment Industry Segmentation
-
1. Product Type
- 1.1. Manual Ultrasonic Testing Equipment
- 1.2. Automated Ultrasonic Testing Equipment
- 1.3. Handheld Ultrasonic Testing Equipment
-
2. Application
- 2.1. Aerospace
- 2.2. Manufacturing
- 2.3. Automotive
- 2.4. Energy
- 2.5. Construction
Portable Ultrasonic Testing Equipment Industry Segmentation By Geography
-
1. North America
- 1.1. United States
- 1.2. Canada
-
2. Europe
- 2.1. Germany
- 2.2. United Kingdom
- 2.3. France
- 2.4. Spain
- 2.5. Rest of Europe
-
3. Asia Pacific
- 3.1. China
- 3.2. Japan
- 3.3. India
- 3.4. South Korea
- 3.5. Rest of Asia Pacific
-
4. Latin America
- 4.1. Brazil
- 4.2. Argentina
- 4.3. Rest of Latin America
-
5. Middle East and Africa
- 5.1. United Arab Emirates
- 5.2. Saudi Arabia
- 5.3. Rest of Middle East and Africa
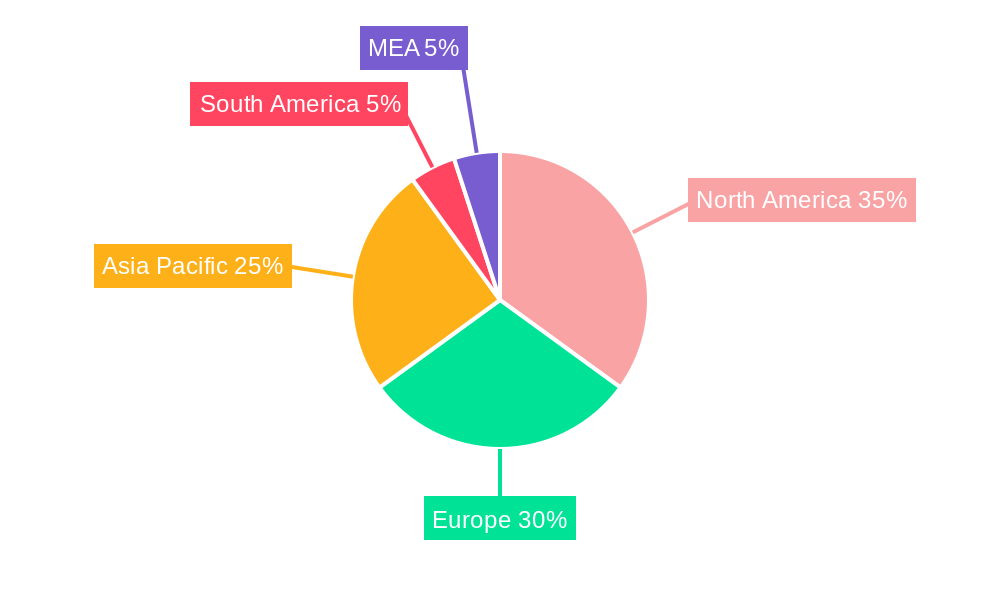
Portable Ultrasonic Testing Equipment Industry Regional Market Share
Geographic Coverage of Portable Ultrasonic Testing Equipment Industry
Portable Ultrasonic Testing Equipment Industry REPORT HIGHLIGHTS
| Aspects | Details |
|---|---|
| Study Period | 2020-2034 |
| Base Year | 2025 |
| Estimated Year | 2026 |
| Forecast Period | 2026-2034 |
| Historical Period | 2020-2025 |
| Growth Rate | CAGR of 8.79% from 2020-2034 |
| Segmentation |
|
Table of Contents
- 1. Introduction
- 1.1. Research Scope
- 1.2. Market Segmentation
- 1.3. Research Objective
- 1.4. Definitions and Assumptions
- 2. Executive Summary
- 2.1. Market Snapshot
- 3. Market Dynamics
- 3.1. Market Drivers
- 3.2. Market Restrains
- 3.3. Market Trends
- 3.4. Market Opportunities
- 4. Market Factor Analysis
- 4.1. Porters Five Forces
- 4.1.1. Bargaining Power of Suppliers
- 4.1.2. Bargaining Power of Buyers
- 4.1.3. Threat of New Entrants
- 4.1.4. Threat of Substitutes
- 4.1.5. Competitive Rivalry
- 4.2. PESTEL analysis
- 4.3. BCG Analysis
- 4.3.1. Stars (High Growth, High Market Share)
- 4.3.2. Cash Cows (Low Growth, High Market Share)
- 4.3.3. Question Mark (High Growth, Low Market Share)
- 4.3.4. Dogs (Low Growth, Low Market Share)
- 4.4. Ansoff Matrix Analysis
- 4.5. Supply Chain Analysis
- 4.6. Regulatory Landscape
- 4.7. Current Market Potential and Opportunity Assessment (TAM–SAM–SOM Framework)
- 4.8. MDP Analyst Note
- 4.1. Porters Five Forces
- 5. Market Analysis, Insights and Forecast 2021-2033
- 5.1. Market Analysis, Insights and Forecast - by Product Type
- 5.1.1. Manual Ultrasonic Testing Equipment
- 5.1.2. Automated Ultrasonic Testing Equipment
- 5.1.3. Handheld Ultrasonic Testing Equipment
- 5.2. Market Analysis, Insights and Forecast - by Application
- 5.2.1. Aerospace
- 5.2.2. Manufacturing
- 5.2.3. Automotive
- 5.2.4. Energy
- 5.2.5. Construction
- 5.3. Market Analysis, Insights and Forecast - by Region
- 5.3.1. North America
- 5.3.2. Europe
- 5.3.3. Asia Pacific
- 5.3.4. Latin America
- 5.3.5. Middle East and Africa
- 5.1. Market Analysis, Insights and Forecast - by Product Type
- 6. Global Portable Ultrasonic Testing Equipment Industry Analysis, Insights and Forecast, 2021-2033
- 6.1. Market Analysis, Insights and Forecast - by Product Type
- 6.1.1. Manual Ultrasonic Testing Equipment
- 6.1.2. Automated Ultrasonic Testing Equipment
- 6.1.3. Handheld Ultrasonic Testing Equipment
- 6.2. Market Analysis, Insights and Forecast - by Application
- 6.2.1. Aerospace
- 6.2.2. Manufacturing
- 6.2.3. Automotive
- 6.2.4. Energy
- 6.2.5. Construction
- 6.1. Market Analysis, Insights and Forecast - by Product Type
- 7. North America Portable Ultrasonic Testing Equipment Industry Analysis, Insights and Forecast, 2020-2032
- 7.1. Market Analysis, Insights and Forecast - by Product Type
- 7.1.1. Manual Ultrasonic Testing Equipment
- 7.1.2. Automated Ultrasonic Testing Equipment
- 7.1.3. Handheld Ultrasonic Testing Equipment
- 7.2. Market Analysis, Insights and Forecast - by Application
- 7.2.1. Aerospace
- 7.2.2. Manufacturing
- 7.2.3. Automotive
- 7.2.4. Energy
- 7.2.5. Construction
- 7.1. Market Analysis, Insights and Forecast - by Product Type
- 8. Europe Portable Ultrasonic Testing Equipment Industry Analysis, Insights and Forecast, 2020-2032
- 8.1. Market Analysis, Insights and Forecast - by Product Type
- 8.1.1. Manual Ultrasonic Testing Equipment
- 8.1.2. Automated Ultrasonic Testing Equipment
- 8.1.3. Handheld Ultrasonic Testing Equipment
- 8.2. Market Analysis, Insights and Forecast - by Application
- 8.2.1. Aerospace
- 8.2.2. Manufacturing
- 8.2.3. Automotive
- 8.2.4. Energy
- 8.2.5. Construction
- 8.1. Market Analysis, Insights and Forecast - by Product Type
- 9. Asia Pacific Portable Ultrasonic Testing Equipment Industry Analysis, Insights and Forecast, 2020-2032
- 9.1. Market Analysis, Insights and Forecast - by Product Type
- 9.1.1. Manual Ultrasonic Testing Equipment
- 9.1.2. Automated Ultrasonic Testing Equipment
- 9.1.3. Handheld Ultrasonic Testing Equipment
- 9.2. Market Analysis, Insights and Forecast - by Application
- 9.2.1. Aerospace
- 9.2.2. Manufacturing
- 9.2.3. Automotive
- 9.2.4. Energy
- 9.2.5. Construction
- 9.1. Market Analysis, Insights and Forecast - by Product Type
- 10. Latin America Portable Ultrasonic Testing Equipment Industry Analysis, Insights and Forecast, 2020-2032
- 10.1. Market Analysis, Insights and Forecast - by Product Type
- 10.1.1. Manual Ultrasonic Testing Equipment
- 10.1.2. Automated Ultrasonic Testing Equipment
- 10.1.3. Handheld Ultrasonic Testing Equipment
- 10.2. Market Analysis, Insights and Forecast - by Application
- 10.2.1. Aerospace
- 10.2.2. Manufacturing
- 10.2.3. Automotive
- 10.2.4. Energy
- 10.2.5. Construction
- 10.1. Market Analysis, Insights and Forecast - by Product Type
- 11. Middle East and Africa Portable Ultrasonic Testing Equipment Industry Analysis, Insights and Forecast, 2020-2032
- 11.1. Market Analysis, Insights and Forecast - by Product Type
- 11.1.1. Manual Ultrasonic Testing Equipment
- 11.1.2. Automated Ultrasonic Testing Equipment
- 11.1.3. Handheld Ultrasonic Testing Equipment
- 11.2. Market Analysis, Insights and Forecast - by Application
- 11.2.1. Aerospace
- 11.2.2. Manufacturing
- 11.2.3. Automotive
- 11.2.4. Energy
- 11.2.5. Construction
- 11.1. Market Analysis, Insights and Forecast - by Product Type
- 12. Competitive Analysis
- 12.1. Company Profiles
- 12.1.1 Intertek Group PKC
- 12.1.1.1. Company Overview
- 12.1.1.2. Products
- 12.1.1.3. Company Financials
- 12.1.1.4. SWOT Analysis
- 12.1.2 Advanced NDT Ltd
- 12.1.2.1. Company Overview
- 12.1.2.2. Products
- 12.1.2.3. Company Financials
- 12.1.2.4. SWOT Analysis
- 12.1.3 Applus Services S
- 12.1.3.1. Company Overview
- 12.1.3.2. Products
- 12.1.3.3. Company Financials
- 12.1.3.4. SWOT Analysis
- 12.1.4 MISTRAS Group
- 12.1.4.1. Company Overview
- 12.1.4.2. Products
- 12.1.4.3. Company Financials
- 12.1.4.4. SWOT Analysis
- 12.1.5 Baker Hughes
- 12.1.5.1. Company Overview
- 12.1.5.2. Products
- 12.1.5.3. Company Financials
- 12.1.5.4. SWOT Analysis
- 12.1.6 Russell Fraser Sales Pty Ltd
- 12.1.6.1. Company Overview
- 12.1.6.2. Products
- 12.1.6.3. Company Financials
- 12.1.6.4. SWOT Analysis
- 12.1.7 OkoNDT group
- 12.1.7.1. Company Overview
- 12.1.7.2. Products
- 12.1.7.3. Company Financials
- 12.1.7.4. SWOT Analysis
- 12.1.8 ROSEN Group
- 12.1.8.1. Company Overview
- 12.1.8.2. Products
- 12.1.8.3. Company Financials
- 12.1.8.4. SWOT Analysis
- 12.1.9 Bureau Veritas SA
- 12.1.9.1. Company Overview
- 12.1.9.2. Products
- 12.1.9.3. Company Financials
- 12.1.9.4. SWOT Analysis
- 12.1.10 Johnson and Allen Ltd
- 12.1.10.1. Company Overview
- 12.1.10.2. Products
- 12.1.10.3. Company Financials
- 12.1.10.4. SWOT Analysis
- 12.1.11 Olympus Corporation
- 12.1.11.1. Company Overview
- 12.1.11.2. Products
- 12.1.11.3. Company Financials
- 12.1.11.4. SWOT Analysis
- 12.1.1 Intertek Group PKC
- 12.2. Market Entropy
- 12.2.1 Company's Key Areas Served
- 12.2.2 Recent Developments
- 12.3. Company Market Share Analysis 2025
- 12.3.1 Top 5 Companies Market Share Analysis
- 12.3.2 Top 3 Companies Market Share Analysis
- 12.4. List of Potential Customers
- 13. Research Methodology
List of Figures
- Figure 1: Global Portable Ultrasonic Testing Equipment Industry Revenue Breakdown (Million, %) by Region 2025 & 2033
- Figure 2: Global Portable Ultrasonic Testing Equipment Industry Volume Breakdown (K Unit, %) by Region 2025 & 2033
- Figure 3: North America Portable Ultrasonic Testing Equipment Industry Revenue (Million), by Product Type 2025 & 2033
- Figure 4: North America Portable Ultrasonic Testing Equipment Industry Volume (K Unit), by Product Type 2025 & 2033
- Figure 5: North America Portable Ultrasonic Testing Equipment Industry Revenue Share (%), by Product Type 2025 & 2033
- Figure 6: North America Portable Ultrasonic Testing Equipment Industry Volume Share (%), by Product Type 2025 & 2033
- Figure 7: North America Portable Ultrasonic Testing Equipment Industry Revenue (Million), by Application 2025 & 2033
- Figure 8: North America Portable Ultrasonic Testing Equipment Industry Volume (K Unit), by Application 2025 & 2033
- Figure 9: North America Portable Ultrasonic Testing Equipment Industry Revenue Share (%), by Application 2025 & 2033
- Figure 10: North America Portable Ultrasonic Testing Equipment Industry Volume Share (%), by Application 2025 & 2033
- Figure 11: North America Portable Ultrasonic Testing Equipment Industry Revenue (Million), by Country 2025 & 2033
- Figure 12: North America Portable Ultrasonic Testing Equipment Industry Volume (K Unit), by Country 2025 & 2033
- Figure 13: North America Portable Ultrasonic Testing Equipment Industry Revenue Share (%), by Country 2025 & 2033
- Figure 14: North America Portable Ultrasonic Testing Equipment Industry Volume Share (%), by Country 2025 & 2033
- Figure 15: Europe Portable Ultrasonic Testing Equipment Industry Revenue (Million), by Product Type 2025 & 2033
- Figure 16: Europe Portable Ultrasonic Testing Equipment Industry Volume (K Unit), by Product Type 2025 & 2033
- Figure 17: Europe Portable Ultrasonic Testing Equipment Industry Revenue Share (%), by Product Type 2025 & 2033
- Figure 18: Europe Portable Ultrasonic Testing Equipment Industry Volume Share (%), by Product Type 2025 & 2033
- Figure 19: Europe Portable Ultrasonic Testing Equipment Industry Revenue (Million), by Application 2025 & 2033
- Figure 20: Europe Portable Ultrasonic Testing Equipment Industry Volume (K Unit), by Application 2025 & 2033
- Figure 21: Europe Portable Ultrasonic Testing Equipment Industry Revenue Share (%), by Application 2025 & 2033
- Figure 22: Europe Portable Ultrasonic Testing Equipment Industry Volume Share (%), by Application 2025 & 2033
- Figure 23: Europe Portable Ultrasonic Testing Equipment Industry Revenue (Million), by Country 2025 & 2033
- Figure 24: Europe Portable Ultrasonic Testing Equipment Industry Volume (K Unit), by Country 2025 & 2033
- Figure 25: Europe Portable Ultrasonic Testing Equipment Industry Revenue Share (%), by Country 2025 & 2033
- Figure 26: Europe Portable Ultrasonic Testing Equipment Industry Volume Share (%), by Country 2025 & 2033
- Figure 27: Asia Pacific Portable Ultrasonic Testing Equipment Industry Revenue (Million), by Product Type 2025 & 2033
- Figure 28: Asia Pacific Portable Ultrasonic Testing Equipment Industry Volume (K Unit), by Product Type 2025 & 2033
- Figure 29: Asia Pacific Portable Ultrasonic Testing Equipment Industry Revenue Share (%), by Product Type 2025 & 2033
- Figure 30: Asia Pacific Portable Ultrasonic Testing Equipment Industry Volume Share (%), by Product Type 2025 & 2033
- Figure 31: Asia Pacific Portable Ultrasonic Testing Equipment Industry Revenue (Million), by Application 2025 & 2033
- Figure 32: Asia Pacific Portable Ultrasonic Testing Equipment Industry Volume (K Unit), by Application 2025 & 2033
- Figure 33: Asia Pacific Portable Ultrasonic Testing Equipment Industry Revenue Share (%), by Application 2025 & 2033
- Figure 34: Asia Pacific Portable Ultrasonic Testing Equipment Industry Volume Share (%), by Application 2025 & 2033
- Figure 35: Asia Pacific Portable Ultrasonic Testing Equipment Industry Revenue (Million), by Country 2025 & 2033
- Figure 36: Asia Pacific Portable Ultrasonic Testing Equipment Industry Volume (K Unit), by Country 2025 & 2033
- Figure 37: Asia Pacific Portable Ultrasonic Testing Equipment Industry Revenue Share (%), by Country 2025 & 2033
- Figure 38: Asia Pacific Portable Ultrasonic Testing Equipment Industry Volume Share (%), by Country 2025 & 2033
- Figure 39: Latin America Portable Ultrasonic Testing Equipment Industry Revenue (Million), by Product Type 2025 & 2033
- Figure 40: Latin America Portable Ultrasonic Testing Equipment Industry Volume (K Unit), by Product Type 2025 & 2033
- Figure 41: Latin America Portable Ultrasonic Testing Equipment Industry Revenue Share (%), by Product Type 2025 & 2033
- Figure 42: Latin America Portable Ultrasonic Testing Equipment Industry Volume Share (%), by Product Type 2025 & 2033
- Figure 43: Latin America Portable Ultrasonic Testing Equipment Industry Revenue (Million), by Application 2025 & 2033
- Figure 44: Latin America Portable Ultrasonic Testing Equipment Industry Volume (K Unit), by Application 2025 & 2033
- Figure 45: Latin America Portable Ultrasonic Testing Equipment Industry Revenue Share (%), by Application 2025 & 2033
- Figure 46: Latin America Portable Ultrasonic Testing Equipment Industry Volume Share (%), by Application 2025 & 2033
- Figure 47: Latin America Portable Ultrasonic Testing Equipment Industry Revenue (Million), by Country 2025 & 2033
- Figure 48: Latin America Portable Ultrasonic Testing Equipment Industry Volume (K Unit), by Country 2025 & 2033
- Figure 49: Latin America Portable Ultrasonic Testing Equipment Industry Revenue Share (%), by Country 2025 & 2033
- Figure 50: Latin America Portable Ultrasonic Testing Equipment Industry Volume Share (%), by Country 2025 & 2033
- Figure 51: Middle East and Africa Portable Ultrasonic Testing Equipment Industry Revenue (Million), by Product Type 2025 & 2033
- Figure 52: Middle East and Africa Portable Ultrasonic Testing Equipment Industry Volume (K Unit), by Product Type 2025 & 2033
- Figure 53: Middle East and Africa Portable Ultrasonic Testing Equipment Industry Revenue Share (%), by Product Type 2025 & 2033
- Figure 54: Middle East and Africa Portable Ultrasonic Testing Equipment Industry Volume Share (%), by Product Type 2025 & 2033
- Figure 55: Middle East and Africa Portable Ultrasonic Testing Equipment Industry Revenue (Million), by Application 2025 & 2033
- Figure 56: Middle East and Africa Portable Ultrasonic Testing Equipment Industry Volume (K Unit), by Application 2025 & 2033
- Figure 57: Middle East and Africa Portable Ultrasonic Testing Equipment Industry Revenue Share (%), by Application 2025 & 2033
- Figure 58: Middle East and Africa Portable Ultrasonic Testing Equipment Industry Volume Share (%), by Application 2025 & 2033
- Figure 59: Middle East and Africa Portable Ultrasonic Testing Equipment Industry Revenue (Million), by Country 2025 & 2033
- Figure 60: Middle East and Africa Portable Ultrasonic Testing Equipment Industry Volume (K Unit), by Country 2025 & 2033
- Figure 61: Middle East and Africa Portable Ultrasonic Testing Equipment Industry Revenue Share (%), by Country 2025 & 2033
- Figure 62: Middle East and Africa Portable Ultrasonic Testing Equipment Industry Volume Share (%), by Country 2025 & 2033
List of Tables
- Table 1: Global Portable Ultrasonic Testing Equipment Industry Revenue Million Forecast, by Product Type 2020 & 2033
- Table 2: Global Portable Ultrasonic Testing Equipment Industry Volume K Unit Forecast, by Product Type 2020 & 2033
- Table 3: Global Portable Ultrasonic Testing Equipment Industry Revenue Million Forecast, by Application 2020 & 2033
- Table 4: Global Portable Ultrasonic Testing Equipment Industry Volume K Unit Forecast, by Application 2020 & 2033
- Table 5: Global Portable Ultrasonic Testing Equipment Industry Revenue Million Forecast, by Region 2020 & 2033
- Table 6: Global Portable Ultrasonic Testing Equipment Industry Volume K Unit Forecast, by Region 2020 & 2033
- Table 7: Global Portable Ultrasonic Testing Equipment Industry Revenue Million Forecast, by Product Type 2020 & 2033
- Table 8: Global Portable Ultrasonic Testing Equipment Industry Volume K Unit Forecast, by Product Type 2020 & 2033
- Table 9: Global Portable Ultrasonic Testing Equipment Industry Revenue Million Forecast, by Application 2020 & 2033
- Table 10: Global Portable Ultrasonic Testing Equipment Industry Volume K Unit Forecast, by Application 2020 & 2033
- Table 11: Global Portable Ultrasonic Testing Equipment Industry Revenue Million Forecast, by Country 2020 & 2033
- Table 12: Global Portable Ultrasonic Testing Equipment Industry Volume K Unit Forecast, by Country 2020 & 2033
- Table 13: United States Portable Ultrasonic Testing Equipment Industry Revenue (Million) Forecast, by Application 2020 & 2033
- Table 14: United States Portable Ultrasonic Testing Equipment Industry Volume (K Unit) Forecast, by Application 2020 & 2033
- Table 15: Canada Portable Ultrasonic Testing Equipment Industry Revenue (Million) Forecast, by Application 2020 & 2033
- Table 16: Canada Portable Ultrasonic Testing Equipment Industry Volume (K Unit) Forecast, by Application 2020 & 2033
- Table 17: Global Portable Ultrasonic Testing Equipment Industry Revenue Million Forecast, by Product Type 2020 & 2033
- Table 18: Global Portable Ultrasonic Testing Equipment Industry Volume K Unit Forecast, by Product Type 2020 & 2033
- Table 19: Global Portable Ultrasonic Testing Equipment Industry Revenue Million Forecast, by Application 2020 & 2033
- Table 20: Global Portable Ultrasonic Testing Equipment Industry Volume K Unit Forecast, by Application 2020 & 2033
- Table 21: Global Portable Ultrasonic Testing Equipment Industry Revenue Million Forecast, by Country 2020 & 2033
- Table 22: Global Portable Ultrasonic Testing Equipment Industry Volume K Unit Forecast, by Country 2020 & 2033
- Table 23: Germany Portable Ultrasonic Testing Equipment Industry Revenue (Million) Forecast, by Application 2020 & 2033
- Table 24: Germany Portable Ultrasonic Testing Equipment Industry Volume (K Unit) Forecast, by Application 2020 & 2033
- Table 25: United Kingdom Portable Ultrasonic Testing Equipment Industry Revenue (Million) Forecast, by Application 2020 & 2033
- Table 26: United Kingdom Portable Ultrasonic Testing Equipment Industry Volume (K Unit) Forecast, by Application 2020 & 2033
- Table 27: France Portable Ultrasonic Testing Equipment Industry Revenue (Million) Forecast, by Application 2020 & 2033
- Table 28: France Portable Ultrasonic Testing Equipment Industry Volume (K Unit) Forecast, by Application 2020 & 2033
- Table 29: Spain Portable Ultrasonic Testing Equipment Industry Revenue (Million) Forecast, by Application 2020 & 2033
- Table 30: Spain Portable Ultrasonic Testing Equipment Industry Volume (K Unit) Forecast, by Application 2020 & 2033
- Table 31: Rest of Europe Portable Ultrasonic Testing Equipment Industry Revenue (Million) Forecast, by Application 2020 & 2033
- Table 32: Rest of Europe Portable Ultrasonic Testing Equipment Industry Volume (K Unit) Forecast, by Application 2020 & 2033
- Table 33: Global Portable Ultrasonic Testing Equipment Industry Revenue Million Forecast, by Product Type 2020 & 2033
- Table 34: Global Portable Ultrasonic Testing Equipment Industry Volume K Unit Forecast, by Product Type 2020 & 2033
- Table 35: Global Portable Ultrasonic Testing Equipment Industry Revenue Million Forecast, by Application 2020 & 2033
- Table 36: Global Portable Ultrasonic Testing Equipment Industry Volume K Unit Forecast, by Application 2020 & 2033
- Table 37: Global Portable Ultrasonic Testing Equipment Industry Revenue Million Forecast, by Country 2020 & 2033
- Table 38: Global Portable Ultrasonic Testing Equipment Industry Volume K Unit Forecast, by Country 2020 & 2033
- Table 39: China Portable Ultrasonic Testing Equipment Industry Revenue (Million) Forecast, by Application 2020 & 2033
- Table 40: China Portable Ultrasonic Testing Equipment Industry Volume (K Unit) Forecast, by Application 2020 & 2033
- Table 41: Japan Portable Ultrasonic Testing Equipment Industry Revenue (Million) Forecast, by Application 2020 & 2033
- Table 42: Japan Portable Ultrasonic Testing Equipment Industry Volume (K Unit) Forecast, by Application 2020 & 2033
- Table 43: India Portable Ultrasonic Testing Equipment Industry Revenue (Million) Forecast, by Application 2020 & 2033
- Table 44: India Portable Ultrasonic Testing Equipment Industry Volume (K Unit) Forecast, by Application 2020 & 2033
- Table 45: South Korea Portable Ultrasonic Testing Equipment Industry Revenue (Million) Forecast, by Application 2020 & 2033
- Table 46: South Korea Portable Ultrasonic Testing Equipment Industry Volume (K Unit) Forecast, by Application 2020 & 2033
- Table 47: Rest of Asia Pacific Portable Ultrasonic Testing Equipment Industry Revenue (Million) Forecast, by Application 2020 & 2033
- Table 48: Rest of Asia Pacific Portable Ultrasonic Testing Equipment Industry Volume (K Unit) Forecast, by Application 2020 & 2033
- Table 49: Global Portable Ultrasonic Testing Equipment Industry Revenue Million Forecast, by Product Type 2020 & 2033
- Table 50: Global Portable Ultrasonic Testing Equipment Industry Volume K Unit Forecast, by Product Type 2020 & 2033
- Table 51: Global Portable Ultrasonic Testing Equipment Industry Revenue Million Forecast, by Application 2020 & 2033
- Table 52: Global Portable Ultrasonic Testing Equipment Industry Volume K Unit Forecast, by Application 2020 & 2033
- Table 53: Global Portable Ultrasonic Testing Equipment Industry Revenue Million Forecast, by Country 2020 & 2033
- Table 54: Global Portable Ultrasonic Testing Equipment Industry Volume K Unit Forecast, by Country 2020 & 2033
- Table 55: Brazil Portable Ultrasonic Testing Equipment Industry Revenue (Million) Forecast, by Application 2020 & 2033
- Table 56: Brazil Portable Ultrasonic Testing Equipment Industry Volume (K Unit) Forecast, by Application 2020 & 2033
- Table 57: Argentina Portable Ultrasonic Testing Equipment Industry Revenue (Million) Forecast, by Application 2020 & 2033
- Table 58: Argentina Portable Ultrasonic Testing Equipment Industry Volume (K Unit) Forecast, by Application 2020 & 2033
- Table 59: Rest of Latin America Portable Ultrasonic Testing Equipment Industry Revenue (Million) Forecast, by Application 2020 & 2033
- Table 60: Rest of Latin America Portable Ultrasonic Testing Equipment Industry Volume (K Unit) Forecast, by Application 2020 & 2033
- Table 61: Global Portable Ultrasonic Testing Equipment Industry Revenue Million Forecast, by Product Type 2020 & 2033
- Table 62: Global Portable Ultrasonic Testing Equipment Industry Volume K Unit Forecast, by Product Type 2020 & 2033
- Table 63: Global Portable Ultrasonic Testing Equipment Industry Revenue Million Forecast, by Application 2020 & 2033
- Table 64: Global Portable Ultrasonic Testing Equipment Industry Volume K Unit Forecast, by Application 2020 & 2033
- Table 65: Global Portable Ultrasonic Testing Equipment Industry Revenue Million Forecast, by Country 2020 & 2033
- Table 66: Global Portable Ultrasonic Testing Equipment Industry Volume K Unit Forecast, by Country 2020 & 2033
- Table 67: United Arab Emirates Portable Ultrasonic Testing Equipment Industry Revenue (Million) Forecast, by Application 2020 & 2033
- Table 68: United Arab Emirates Portable Ultrasonic Testing Equipment Industry Volume (K Unit) Forecast, by Application 2020 & 2033
- Table 69: Saudi Arabia Portable Ultrasonic Testing Equipment Industry Revenue (Million) Forecast, by Application 2020 & 2033
- Table 70: Saudi Arabia Portable Ultrasonic Testing Equipment Industry Volume (K Unit) Forecast, by Application 2020 & 2033
- Table 71: Rest of Middle East and Africa Portable Ultrasonic Testing Equipment Industry Revenue (Million) Forecast, by Application 2020 & 2033
- Table 72: Rest of Middle East and Africa Portable Ultrasonic Testing Equipment Industry Volume (K Unit) Forecast, by Application 2020 & 2033
Frequently Asked Questions
1. What is the projected Compound Annual Growth Rate (CAGR) of the Portable Ultrasonic Testing Equipment Industry?
The projected CAGR is approximately 8.79%.
2. Which companies are prominent players in the Portable Ultrasonic Testing Equipment Industry?
Key companies in the market include Intertek Group PKC, Advanced NDT Ltd, Applus Services S, MISTRAS Group, Baker Hughes, Russell Fraser Sales Pty Ltd, OkoNDT group, ROSEN Group, Bureau Veritas SA, Johnson and Allen Ltd, Olympus Corporation.
3. What are the main segments of the Portable Ultrasonic Testing Equipment Industry?
The market segments include Product Type , Application .
4. Can you provide details about the market size?
The market size is estimated to be USD 0.87 Million as of 2022.
5. What are some drivers contributing to market growth?
Increased Safety Regulation; More Emphasis Toward Continuous Monitoring to Prevent Sudden Failure; Availability of Portable and Connected Devices for Real-time Data.
6. What are the notable trends driving market growth?
Availability of Portable and Connected Devices for Real-time Data is Expected to Drive the Market's Growth.
7. Are there any restraints impacting market growth?
Lack of Skilled Labor Required to Implement and Carry Out Inspection Service.
8. Can you provide examples of recent developments in the market?
July 2022 - Applus+ was awarded a major contract to execute non-destructive testing on critical maritime assets. Applus+ provides a significant range of marine Non-destructive testing services like materials, corrosion monitoring and testing, and electrical safety and functionality testing. The two-year project entails the execution of radiographic and ultrasonic testing on diverse maritime assets, including watercraft.
9. What pricing options are available for accessing the report?
Pricing options include single-user, multi-user, and enterprise licenses priced at USD 4750, USD 5250, and USD 8750 respectively.
10. Is the market size provided in terms of value or volume?
The market size is provided in terms of value, measured in Million and volume, measured in K Unit.
11. Are there any specific market keywords associated with the report?
Yes, the market keyword associated with the report is "Portable Ultrasonic Testing Equipment Industry," which aids in identifying and referencing the specific market segment covered.
12. How do I determine which pricing option suits my needs best?
The pricing options vary based on user requirements and access needs. Individual users may opt for single-user licenses, while businesses requiring broader access may choose multi-user or enterprise licenses for cost-effective access to the report.
13. Are there any additional resources or data provided in the Portable Ultrasonic Testing Equipment Industry report?
While the report offers comprehensive insights, it's advisable to review the specific contents or supplementary materials provided to ascertain if additional resources or data are available.
14. How can I stay updated on further developments or reports in the Portable Ultrasonic Testing Equipment Industry?
To stay informed about further developments, trends, and reports in the Portable Ultrasonic Testing Equipment Industry, consider subscribing to industry newsletters, following relevant companies and organizations, or regularly checking reputable industry news sources and publications.
Methodology
Step 1 - Identification of Relevant Samples Size from Population Database


Step 2 - Approaches for Defining Global Market Size (Value, Volume* & Price*)

Note*: In applicable scenarios
Step 3 - Data Sources
Primary Research
- Web Analytics
- Survey Reports
- Research Institute
- Latest Research Reports
- Opinion Leaders
Secondary Research
- Annual Reports
- White Paper
- Latest Press Release
- Industry Association
- Paid Database
- Investor Presentations

Step 4 - Data Triangulation
Involves using different sources of information in order to increase the validity of a study
These sources are likely to be stakeholders in a program - participants, other researchers, program staff, other community members, and so on.
Then we put all data in single framework & apply various statistical tools to find out the dynamic on the market.
During the analysis stage, feedback from the stakeholder groups would be compared to determine areas of agreement as well as areas of divergence