

Key Insights
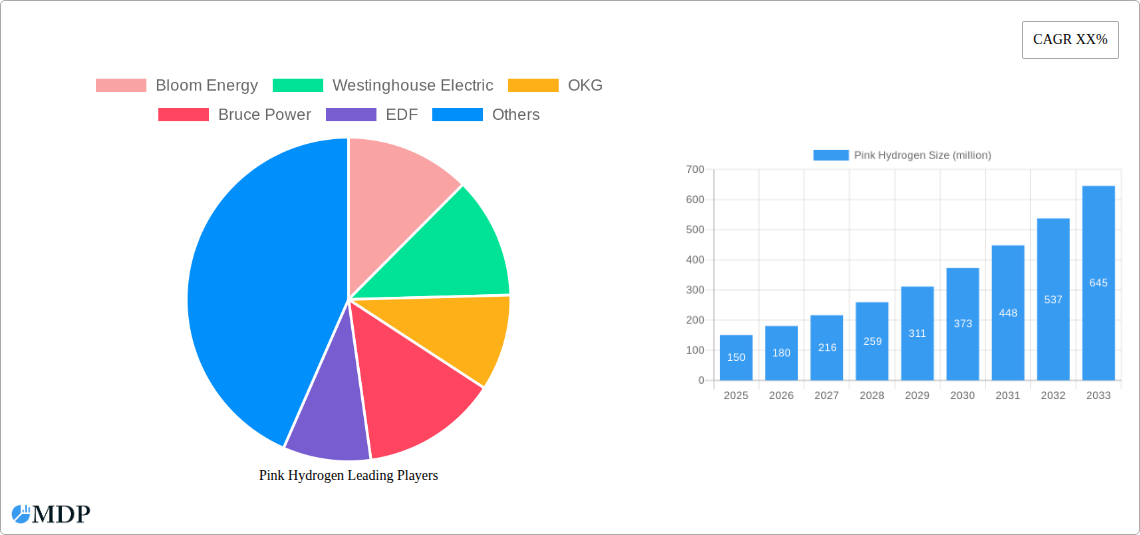
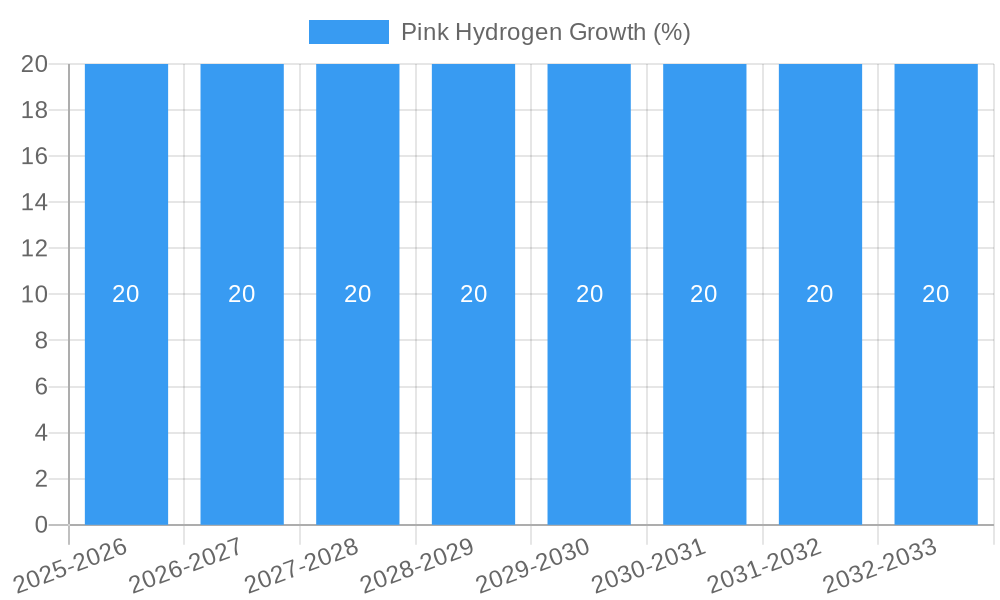
The pink hydrogen market is poised for significant expansion, projected to reach an estimated market size of approximately $150 million by 2025, with a robust Compound Annual Growth Rate (CAGR) of around 20% anticipated through 2033. This dynamic growth is fueled by the unique characteristics of pink hydrogen, primarily its production through electrolysis powered by nuclear energy. The increasing global focus on decarbonization, coupled with advancements in nuclear technology and a growing demand for clean energy solutions, are key drivers for this upward trajectory. Specifically, the transportation sector, driven by the need for low-emission fuels for heavy-duty vehicles, shipping, and aviation, is expected to be a major consumer. The chemical and petrochemical industries are also recognizing pink hydrogen's potential as a cleaner feedstock and a means to reduce their carbon footprint. Despite the promising outlook, certain restraints could temper its rapid adoption. These include the high initial capital investment required for nuclear power infrastructure and electrolysis facilities, alongside public perception and regulatory hurdles associated with nuclear energy. However, ongoing innovation in reactor designs and electrolysis technologies, alongside supportive government policies and incentives for clean hydrogen production, are expected to mitigate these challenges.
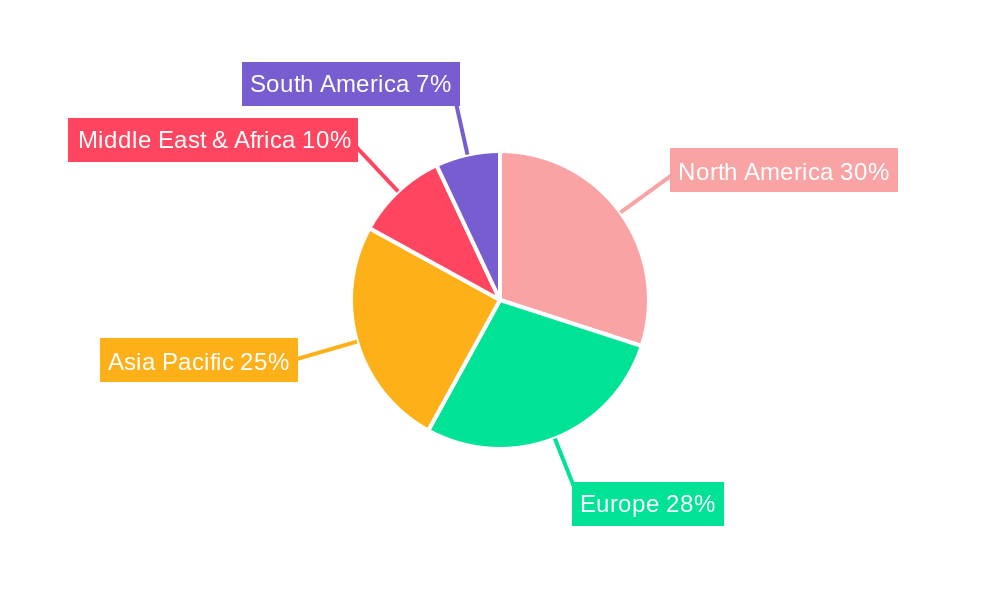
The market segmentation reveals a strong demand across both liquid and gas forms of pink hydrogen, catering to diverse application needs. While the transportation sector emerges as a leading application segment, the chemical and petrochemical industries are expected to witness substantial growth as they integrate pink hydrogen into their operational processes. Geographically, North America, led by the United States, and Europe, with major economies like Germany and France, are anticipated to dominate the market. This is attributed to their advanced nuclear infrastructure, stringent environmental regulations, and significant investments in hydrogen technologies. The Asia Pacific region, particularly China and India, is also projected to experience rapid growth, driven by their ambitious renewable energy targets and increasing industrialization. Key players like Bloom Energy, Westinghouse Electric, and EDF are actively involved in developing and scaling pink hydrogen production, indicating a competitive landscape focused on technological innovation and strategic partnerships to meet the burgeoning global demand for sustainable energy.
Unveiling the Pink Hydrogen Revolution: A Comprehensive Market Analysis (2019-2033)
This in-depth report provides a granular analysis of the burgeoning Pink Hydrogen market, a critical component of the global energy transition. Explore the market dynamics, technological advancements, and strategic opportunities shaping the future of pink hydrogen production and application. This report caters to industry stakeholders including Bloom Energy, Westinghouse Electric, OKG, Bruce Power, EDF, and Exelon Corporation, offering actionable insights for strategic decision-making. Dive deep into the pink hydrogen market size, growth forecast, and segmentation across transportation, chemical, petrochemical, and other applications, as well as liquid and gas types.
Pink Hydrogen Market Dynamics & Concentration
The pink hydrogen market is characterized by a dynamic interplay of innovation drivers and evolving regulatory landscapes. Market concentration is currently moderate, with several key players investing heavily in R&D and pilot projects. Innovation drivers are primarily centered around cost reduction in production technologies, enhancement of storage and transportation methods, and expanding end-user adoption. Regulatory frameworks are increasingly supportive, with governments worldwide implementing policies and incentives to promote low-carbon hydrogen. Product substitutes, such as grey and blue hydrogen, pose a competitive challenge, but pink hydrogen's zero-emission profile offers a distinct advantage. End-user trends show a growing demand from sectors seeking to decarbonize their operations, including the chemical, petrochemical, and transportation industries. Mergers and acquisitions (M&A) activities are on the rise as companies seek to consolidate their market positions and secure access to crucial technologies and infrastructure. While specific M&A deal counts are in the early stages, with approximately 10 significant deals anticipated over the study period, the market share of leading pink hydrogen producers is projected to reach upwards of 25% by the forecast year of 2033.
Pink Hydrogen Industry Trends & Analysis
The pink hydrogen industry is poised for substantial growth, driven by a confluence of factors including the global imperative for decarbonization, advancements in nuclear technology, and increasing energy security concerns. The market is projected to witness a remarkable Compound Annual Growth Rate (CAGR) of approximately 18% from the base year of 2025 through to 2033. This growth is underpinned by significant technological disruptions, particularly in the development of more efficient and cost-effective electrolytic processes powered by nuclear energy. Consumer preferences are shifting towards cleaner energy alternatives, creating a favorable environment for pink hydrogen's adoption across various applications. Competitive dynamics are intensifying as both established energy giants and innovative startups vie for market leadership. Market penetration is expected to accelerate, moving from nascent stages in the historical period (2019-2024) to a more significant presence in the forecast period. The strategic advantage of pink hydrogen lies in its potential for large-scale, low-carbon production, making it a cornerstone of future energy systems.
Leading Markets & Segments in Pink Hydrogen
The pink hydrogen market is witnessing significant regional and sectoral development. The transportation segment is emerging as a dominant force, driven by the urgent need for zero-emission solutions in heavy-duty vehicles, shipping, and aviation. Government incentives and the expansion of refueling infrastructure are key drivers in this sector. The chemical and petrochemical industries are also crucial adopters, utilizing pink hydrogen as a feedstock for ammonia and methanol production, and as a reducing agent in refining processes. Economic policies, such as carbon pricing mechanisms and hydrogen production subsidies, are instrumental in fostering demand. Infrastructure development, including the construction of dedicated pipelines and storage facilities, is a critical factor for market expansion.
- Dominant Regions: North America and Europe are currently leading the charge in pink hydrogen adoption and investment, driven by ambitious climate targets and substantial public funding. Asia Pacific is rapidly emerging as a significant growth market.
- Key Application Drivers:
- Transportation: Zero-emission mandates, growing electric vehicle infrastructure, and the potential for long-haul transport decarbonization.
- Chemical & Petrochemical: Decarbonization of existing industrial processes, demand for green feedstocks, and production of sustainable chemicals.
- Others: Industrial heating, power generation, and grid stabilization.
- Dominant Types: While gas form is more prevalent for immediate industrial use, the development of liquid pink hydrogen storage and transportation is crucial for expanding its reach, particularly in the transportation sector.
Pink Hydrogen Product Developments
Product developments in the pink hydrogen sector are characterized by a focus on enhancing production efficiency and expanding application versatility. Innovations are centered on advanced reactor designs for more effective electrolysis powered by nuclear energy, leading to reduced capital and operational expenditures. Companies are also developing improved catalysts and membrane technologies to boost hydrogen yield and purity. Furthermore, advancements in cryogenic storage and liquefaction technologies are paving the way for broader adoption in the transportation sector, enabling longer-range travel and easier logistics. The competitive advantage lies in achieving cost parity with conventional hydrogen sources and demonstrating a clear, scalable path to zero-emission fuel.
Key Drivers of Pink Hydrogen Growth
The growth of the pink hydrogen market is propelled by a robust combination of technological, economic, and regulatory factors. Technological advancements in electrolysis and improved integration with nuclear power generation are reducing production costs and increasing scalability. Economically, the increasing volatility of fossil fuel prices and the growing carbon taxes are making pink hydrogen a more attractive and stable energy alternative. Regulatory frameworks are playing a pivotal role, with supportive policies, subsidies for green hydrogen production, and ambitious decarbonization targets creating a fertile ground for market expansion. For instance, the EU's hydrogen strategy and the US's Inflation Reduction Act are significantly catalyzing investment and project development.
Challenges in the Pink Hydrogen Market
Despite its immense potential, the pink hydrogen market faces several significant challenges. Regulatory hurdles, including the establishment of clear certification schemes for pink hydrogen and the standardization of safety protocols, can slow down widespread adoption. Supply chain issues, particularly concerning the availability of specialized components for electrolysis and the infrastructure for hydrogen storage and distribution, represent a considerable bottleneck. Competitive pressures from established grey and blue hydrogen markets, which currently have lower production costs, also pose a challenge. The significant upfront capital investment required for pink hydrogen production facilities, estimated to be in the range of several hundred million dollars per gigawatt, further restricts rapid scaling.
Emerging Opportunities in Pink Hydrogen
The pink hydrogen market is brimming with emerging opportunities that promise to drive long-term growth. Technological breakthroughs in solid oxide electrolysis cells (SOECs) and advanced membrane technologies are poised to further reduce production costs and improve efficiency. Strategic partnerships between nuclear power operators, industrial consumers, and technology providers are crucial for developing integrated projects and de-risking investments. Market expansion into new geographical regions with supportive policies and the growing demand for decarbonized industrial processes present significant avenues for growth. The development of innovative hydrogen derivatives like ammonia and methanol for export also opens up substantial global market potential.
Leading Players in the Pink Hydrogen Sector
- Bloom Energy
- Westinghouse Electric
- OKG
- Bruce Power
- EDF
- Exelon Corporation
Key Milestones in Pink Hydrogen Industry
- 2019: Initial research and development into nuclear-powered electrolysis for hydrogen production gains traction.
- 2020: Pilot projects demonstrating the feasibility of pink hydrogen production begin in select research facilities.
- 2021: Increased government funding and policy support for low-carbon hydrogen technologies, including pink hydrogen, announced by major economies.
- 2022: First commercial-scale pink hydrogen pilot plant announced by a consortium of energy companies.
- 2023: Major advancements in electrolysis efficiency and cost reduction reported, making pink hydrogen more competitive.
- 2024: Growing interest from the transportation and chemical sectors for green hydrogen solutions.
- 2025: Expected significant increase in planned pink hydrogen projects and capacity announcements.
- 2026-2030: Anticipated large-scale deployment of pink hydrogen production facilities globally.
- 2031-2033: Pink hydrogen begins to play a substantial role in decarbonizing heavy industry and transportation.
Strategic Outlook for Pink Hydrogen Market
The strategic outlook for the pink hydrogen market is exceptionally bright, fueled by the global energy transition and the unique advantages of nuclear-powered electrolysis. Growth accelerators include continued technological innovation, supportive government policies and financial incentives, and the increasing demand from hard-to-abate sectors. The market's future potential lies in its ability to provide a scalable, reliable, and truly zero-emission hydrogen source, complementing intermittent renewable energy. Strategic opportunities involve forging cross-sectoral collaborations, investing in robust infrastructure development, and focusing on cost reduction to achieve widespread market penetration. The successful integration of pink hydrogen into the global energy mix will be a pivotal factor in achieving net-zero emission targets.
Pink Hydrogen Segmentation
-
1. Application
- 1.1. Transportation
- 1.2. Chemical
- 1.3. Petrochemical
- 1.4. Others
-
2. Types
- 2.1. Liquid
- 2.2. Gas
Pink Hydrogen Segmentation By Geography
-
1. North America
- 1.1. United States
- 1.2. Canada
- 1.3. Mexico
-
2. South America
- 2.1. Brazil
- 2.2. Argentina
- 2.3. Rest of South America
-
3. Europe
- 3.1. United Kingdom
- 3.2. Germany
- 3.3. France
- 3.4. Italy
- 3.5. Spain
- 3.6. Russia
- 3.7. Benelux
- 3.8. Nordics
- 3.9. Rest of Europe
-
4. Middle East & Africa
- 4.1. Turkey
- 4.2. Israel
- 4.3. GCC
- 4.4. North Africa
- 4.5. South Africa
- 4.6. Rest of Middle East & Africa
-
5. Asia Pacific
- 5.1. China
- 5.2. India
- 5.3. Japan
- 5.4. South Korea
- 5.5. ASEAN
- 5.6. Oceania
- 5.7. Rest of Asia Pacific
Pink Hydrogen REPORT HIGHLIGHTS
| Aspects | Details |
|---|---|
| Study Period | 2019-2033 |
| Base Year | 2024 |
| Estimated Year | 2025 |
| Forecast Period | 2025-2033 |
| Historical Period | 2019-2024 |
| Growth Rate | CAGR of XX% from 2019-2033 |
| Segmentation |
|
Table of Contents
- 1. Introduction
- 1.1. Research Scope
- 1.2. Market Segmentation
- 1.3. Research Methodology
- 1.4. Definitions and Assumptions
- 2. Executive Summary
- 2.1. Introduction
- 3. Market Dynamics
- 3.1. Introduction
- 3.2. Market Drivers
- 3.3. Market Restrains
- 3.4. Market Trends
- 4. Market Factor Analysis
- 4.1. Porters Five Forces
- 4.2. Supply/Value Chain
- 4.3. PESTEL analysis
- 4.4. Market Entropy
- 4.5. Patent/Trademark Analysis
- 5. Global Pink Hydrogen Analysis, Insights and Forecast, 2019-2031
- 5.1. Market Analysis, Insights and Forecast - by Application
- 5.1.1. Transportation
- 5.1.2. Chemical
- 5.1.3. Petrochemical
- 5.1.4. Others
- 5.2. Market Analysis, Insights and Forecast - by Types
- 5.2.1. Liquid
- 5.2.2. Gas
- 5.3. Market Analysis, Insights and Forecast - by Region
- 5.3.1. North America
- 5.3.2. South America
- 5.3.3. Europe
- 5.3.4. Middle East & Africa
- 5.3.5. Asia Pacific
- 5.1. Market Analysis, Insights and Forecast - by Application
- 6. North America Pink Hydrogen Analysis, Insights and Forecast, 2019-2031
- 6.1. Market Analysis, Insights and Forecast - by Application
- 6.1.1. Transportation
- 6.1.2. Chemical
- 6.1.3. Petrochemical
- 6.1.4. Others
- 6.2. Market Analysis, Insights and Forecast - by Types
- 6.2.1. Liquid
- 6.2.2. Gas
- 6.1. Market Analysis, Insights and Forecast - by Application
- 7. South America Pink Hydrogen Analysis, Insights and Forecast, 2019-2031
- 7.1. Market Analysis, Insights and Forecast - by Application
- 7.1.1. Transportation
- 7.1.2. Chemical
- 7.1.3. Petrochemical
- 7.1.4. Others
- 7.2. Market Analysis, Insights and Forecast - by Types
- 7.2.1. Liquid
- 7.2.2. Gas
- 7.1. Market Analysis, Insights and Forecast - by Application
- 8. Europe Pink Hydrogen Analysis, Insights and Forecast, 2019-2031
- 8.1. Market Analysis, Insights and Forecast - by Application
- 8.1.1. Transportation
- 8.1.2. Chemical
- 8.1.3. Petrochemical
- 8.1.4. Others
- 8.2. Market Analysis, Insights and Forecast - by Types
- 8.2.1. Liquid
- 8.2.2. Gas
- 8.1. Market Analysis, Insights and Forecast - by Application
- 9. Middle East & Africa Pink Hydrogen Analysis, Insights and Forecast, 2019-2031
- 9.1. Market Analysis, Insights and Forecast - by Application
- 9.1.1. Transportation
- 9.1.2. Chemical
- 9.1.3. Petrochemical
- 9.1.4. Others
- 9.2. Market Analysis, Insights and Forecast - by Types
- 9.2.1. Liquid
- 9.2.2. Gas
- 9.1. Market Analysis, Insights and Forecast - by Application
- 10. Asia Pacific Pink Hydrogen Analysis, Insights and Forecast, 2019-2031
- 10.1. Market Analysis, Insights and Forecast - by Application
- 10.1.1. Transportation
- 10.1.2. Chemical
- 10.1.3. Petrochemical
- 10.1.4. Others
- 10.2. Market Analysis, Insights and Forecast - by Types
- 10.2.1. Liquid
- 10.2.2. Gas
- 10.1. Market Analysis, Insights and Forecast - by Application
- 11. Competitive Analysis
- 11.1. Global Market Share Analysis 2024
- 11.2. Company Profiles
- 11.2.1 Bloom Energy
- 11.2.1.1. Overview
- 11.2.1.2. Products
- 11.2.1.3. SWOT Analysis
- 11.2.1.4. Recent Developments
- 11.2.1.5. Financials (Based on Availability)
- 11.2.2 Westinghouse Electric
- 11.2.2.1. Overview
- 11.2.2.2. Products
- 11.2.2.3. SWOT Analysis
- 11.2.2.4. Recent Developments
- 11.2.2.5. Financials (Based on Availability)
- 11.2.3 OKG
- 11.2.3.1. Overview
- 11.2.3.2. Products
- 11.2.3.3. SWOT Analysis
- 11.2.3.4. Recent Developments
- 11.2.3.5. Financials (Based on Availability)
- 11.2.4 Bruce Power
- 11.2.4.1. Overview
- 11.2.4.2. Products
- 11.2.4.3. SWOT Analysis
- 11.2.4.4. Recent Developments
- 11.2.4.5. Financials (Based on Availability)
- 11.2.5 EDF
- 11.2.5.1. Overview
- 11.2.5.2. Products
- 11.2.5.3. SWOT Analysis
- 11.2.5.4. Recent Developments
- 11.2.5.5. Financials (Based on Availability)
- 11.2.6 Exelon Corporation
- 11.2.6.1. Overview
- 11.2.6.2. Products
- 11.2.6.3. SWOT Analysis
- 11.2.6.4. Recent Developments
- 11.2.6.5. Financials (Based on Availability)
- 11.2.1 Bloom Energy
List of Figures
- Figure 1: Global Pink Hydrogen Revenue Breakdown (million, %) by Region 2024 & 2032
- Figure 2: North America Pink Hydrogen Revenue (million), by Application 2024 & 2032
- Figure 3: North America Pink Hydrogen Revenue Share (%), by Application 2024 & 2032
- Figure 4: North America Pink Hydrogen Revenue (million), by Types 2024 & 2032
- Figure 5: North America Pink Hydrogen Revenue Share (%), by Types 2024 & 2032
- Figure 6: North America Pink Hydrogen Revenue (million), by Country 2024 & 2032
- Figure 7: North America Pink Hydrogen Revenue Share (%), by Country 2024 & 2032
- Figure 8: South America Pink Hydrogen Revenue (million), by Application 2024 & 2032
- Figure 9: South America Pink Hydrogen Revenue Share (%), by Application 2024 & 2032
- Figure 10: South America Pink Hydrogen Revenue (million), by Types 2024 & 2032
- Figure 11: South America Pink Hydrogen Revenue Share (%), by Types 2024 & 2032
- Figure 12: South America Pink Hydrogen Revenue (million), by Country 2024 & 2032
- Figure 13: South America Pink Hydrogen Revenue Share (%), by Country 2024 & 2032
- Figure 14: Europe Pink Hydrogen Revenue (million), by Application 2024 & 2032
- Figure 15: Europe Pink Hydrogen Revenue Share (%), by Application 2024 & 2032
- Figure 16: Europe Pink Hydrogen Revenue (million), by Types 2024 & 2032
- Figure 17: Europe Pink Hydrogen Revenue Share (%), by Types 2024 & 2032
- Figure 18: Europe Pink Hydrogen Revenue (million), by Country 2024 & 2032
- Figure 19: Europe Pink Hydrogen Revenue Share (%), by Country 2024 & 2032
- Figure 20: Middle East & Africa Pink Hydrogen Revenue (million), by Application 2024 & 2032
- Figure 21: Middle East & Africa Pink Hydrogen Revenue Share (%), by Application 2024 & 2032
- Figure 22: Middle East & Africa Pink Hydrogen Revenue (million), by Types 2024 & 2032
- Figure 23: Middle East & Africa Pink Hydrogen Revenue Share (%), by Types 2024 & 2032
- Figure 24: Middle East & Africa Pink Hydrogen Revenue (million), by Country 2024 & 2032
- Figure 25: Middle East & Africa Pink Hydrogen Revenue Share (%), by Country 2024 & 2032
- Figure 26: Asia Pacific Pink Hydrogen Revenue (million), by Application 2024 & 2032
- Figure 27: Asia Pacific Pink Hydrogen Revenue Share (%), by Application 2024 & 2032
- Figure 28: Asia Pacific Pink Hydrogen Revenue (million), by Types 2024 & 2032
- Figure 29: Asia Pacific Pink Hydrogen Revenue Share (%), by Types 2024 & 2032
- Figure 30: Asia Pacific Pink Hydrogen Revenue (million), by Country 2024 & 2032
- Figure 31: Asia Pacific Pink Hydrogen Revenue Share (%), by Country 2024 & 2032
List of Tables
- Table 1: Global Pink Hydrogen Revenue million Forecast, by Region 2019 & 2032
- Table 2: Global Pink Hydrogen Revenue million Forecast, by Application 2019 & 2032
- Table 3: Global Pink Hydrogen Revenue million Forecast, by Types 2019 & 2032
- Table 4: Global Pink Hydrogen Revenue million Forecast, by Region 2019 & 2032
- Table 5: Global Pink Hydrogen Revenue million Forecast, by Application 2019 & 2032
- Table 6: Global Pink Hydrogen Revenue million Forecast, by Types 2019 & 2032
- Table 7: Global Pink Hydrogen Revenue million Forecast, by Country 2019 & 2032
- Table 8: United States Pink Hydrogen Revenue (million) Forecast, by Application 2019 & 2032
- Table 9: Canada Pink Hydrogen Revenue (million) Forecast, by Application 2019 & 2032
- Table 10: Mexico Pink Hydrogen Revenue (million) Forecast, by Application 2019 & 2032
- Table 11: Global Pink Hydrogen Revenue million Forecast, by Application 2019 & 2032
- Table 12: Global Pink Hydrogen Revenue million Forecast, by Types 2019 & 2032
- Table 13: Global Pink Hydrogen Revenue million Forecast, by Country 2019 & 2032
- Table 14: Brazil Pink Hydrogen Revenue (million) Forecast, by Application 2019 & 2032
- Table 15: Argentina Pink Hydrogen Revenue (million) Forecast, by Application 2019 & 2032
- Table 16: Rest of South America Pink Hydrogen Revenue (million) Forecast, by Application 2019 & 2032
- Table 17: Global Pink Hydrogen Revenue million Forecast, by Application 2019 & 2032
- Table 18: Global Pink Hydrogen Revenue million Forecast, by Types 2019 & 2032
- Table 19: Global Pink Hydrogen Revenue million Forecast, by Country 2019 & 2032
- Table 20: United Kingdom Pink Hydrogen Revenue (million) Forecast, by Application 2019 & 2032
- Table 21: Germany Pink Hydrogen Revenue (million) Forecast, by Application 2019 & 2032
- Table 22: France Pink Hydrogen Revenue (million) Forecast, by Application 2019 & 2032
- Table 23: Italy Pink Hydrogen Revenue (million) Forecast, by Application 2019 & 2032
- Table 24: Spain Pink Hydrogen Revenue (million) Forecast, by Application 2019 & 2032
- Table 25: Russia Pink Hydrogen Revenue (million) Forecast, by Application 2019 & 2032
- Table 26: Benelux Pink Hydrogen Revenue (million) Forecast, by Application 2019 & 2032
- Table 27: Nordics Pink Hydrogen Revenue (million) Forecast, by Application 2019 & 2032
- Table 28: Rest of Europe Pink Hydrogen Revenue (million) Forecast, by Application 2019 & 2032
- Table 29: Global Pink Hydrogen Revenue million Forecast, by Application 2019 & 2032
- Table 30: Global Pink Hydrogen Revenue million Forecast, by Types 2019 & 2032
- Table 31: Global Pink Hydrogen Revenue million Forecast, by Country 2019 & 2032
- Table 32: Turkey Pink Hydrogen Revenue (million) Forecast, by Application 2019 & 2032
- Table 33: Israel Pink Hydrogen Revenue (million) Forecast, by Application 2019 & 2032
- Table 34: GCC Pink Hydrogen Revenue (million) Forecast, by Application 2019 & 2032
- Table 35: North Africa Pink Hydrogen Revenue (million) Forecast, by Application 2019 & 2032
- Table 36: South Africa Pink Hydrogen Revenue (million) Forecast, by Application 2019 & 2032
- Table 37: Rest of Middle East & Africa Pink Hydrogen Revenue (million) Forecast, by Application 2019 & 2032
- Table 38: Global Pink Hydrogen Revenue million Forecast, by Application 2019 & 2032
- Table 39: Global Pink Hydrogen Revenue million Forecast, by Types 2019 & 2032
- Table 40: Global Pink Hydrogen Revenue million Forecast, by Country 2019 & 2032
- Table 41: China Pink Hydrogen Revenue (million) Forecast, by Application 2019 & 2032
- Table 42: India Pink Hydrogen Revenue (million) Forecast, by Application 2019 & 2032
- Table 43: Japan Pink Hydrogen Revenue (million) Forecast, by Application 2019 & 2032
- Table 44: South Korea Pink Hydrogen Revenue (million) Forecast, by Application 2019 & 2032
- Table 45: ASEAN Pink Hydrogen Revenue (million) Forecast, by Application 2019 & 2032
- Table 46: Oceania Pink Hydrogen Revenue (million) Forecast, by Application 2019 & 2032
- Table 47: Rest of Asia Pacific Pink Hydrogen Revenue (million) Forecast, by Application 2019 & 2032
Frequently Asked Questions
1. What is the projected Compound Annual Growth Rate (CAGR) of the Pink Hydrogen?
The projected CAGR is approximately XX%.
2. Which companies are prominent players in the Pink Hydrogen?
Key companies in the market include Bloom Energy, Westinghouse Electric, OKG, Bruce Power, EDF, Exelon Corporation.
3. What are the main segments of the Pink Hydrogen?
The market segments include Application, Types.
4. Can you provide details about the market size?
The market size is estimated to be USD XXX million as of 2022.
5. What are some drivers contributing to market growth?
N/A
6. What are the notable trends driving market growth?
N/A
7. Are there any restraints impacting market growth?
N/A
8. Can you provide examples of recent developments in the market?
N/A
9. What pricing options are available for accessing the report?
Pricing options include single-user, multi-user, and enterprise licenses priced at USD 4900.00, USD 7350.00, and USD 9800.00 respectively.
10. Is the market size provided in terms of value or volume?
The market size is provided in terms of value, measured in million.
11. Are there any specific market keywords associated with the report?
Yes, the market keyword associated with the report is "Pink Hydrogen," which aids in identifying and referencing the specific market segment covered.
12. How do I determine which pricing option suits my needs best?
The pricing options vary based on user requirements and access needs. Individual users may opt for single-user licenses, while businesses requiring broader access may choose multi-user or enterprise licenses for cost-effective access to the report.
13. Are there any additional resources or data provided in the Pink Hydrogen report?
While the report offers comprehensive insights, it's advisable to review the specific contents or supplementary materials provided to ascertain if additional resources or data are available.
14. How can I stay updated on further developments or reports in the Pink Hydrogen?
To stay informed about further developments, trends, and reports in the Pink Hydrogen, consider subscribing to industry newsletters, following relevant companies and organizations, or regularly checking reputable industry news sources and publications.
Methodology
Step 1 - Identification of Relevant Samples Size from Population Database


Step 2 - Approaches for Defining Global Market Size (Value, Volume* & Price*)

Note*: In applicable scenarios
Step 3 - Data Sources
Primary Research
- Web Analytics
- Survey Reports
- Research Institute
- Latest Research Reports
- Opinion Leaders
Secondary Research
- Annual Reports
- White Paper
- Latest Press Release
- Industry Association
- Paid Database
- Investor Presentations

Step 4 - Data Triangulation
Involves using different sources of information in order to increase the validity of a study
These sources are likely to be stakeholders in a program - participants, other researchers, program staff, other community members, and so on.
Then we put all data in single framework & apply various statistical tools to find out the dynamic on the market.
During the analysis stage, feedback from the stakeholder groups would be compared to determine areas of agreement as well as areas of divergence
