

Key Insights
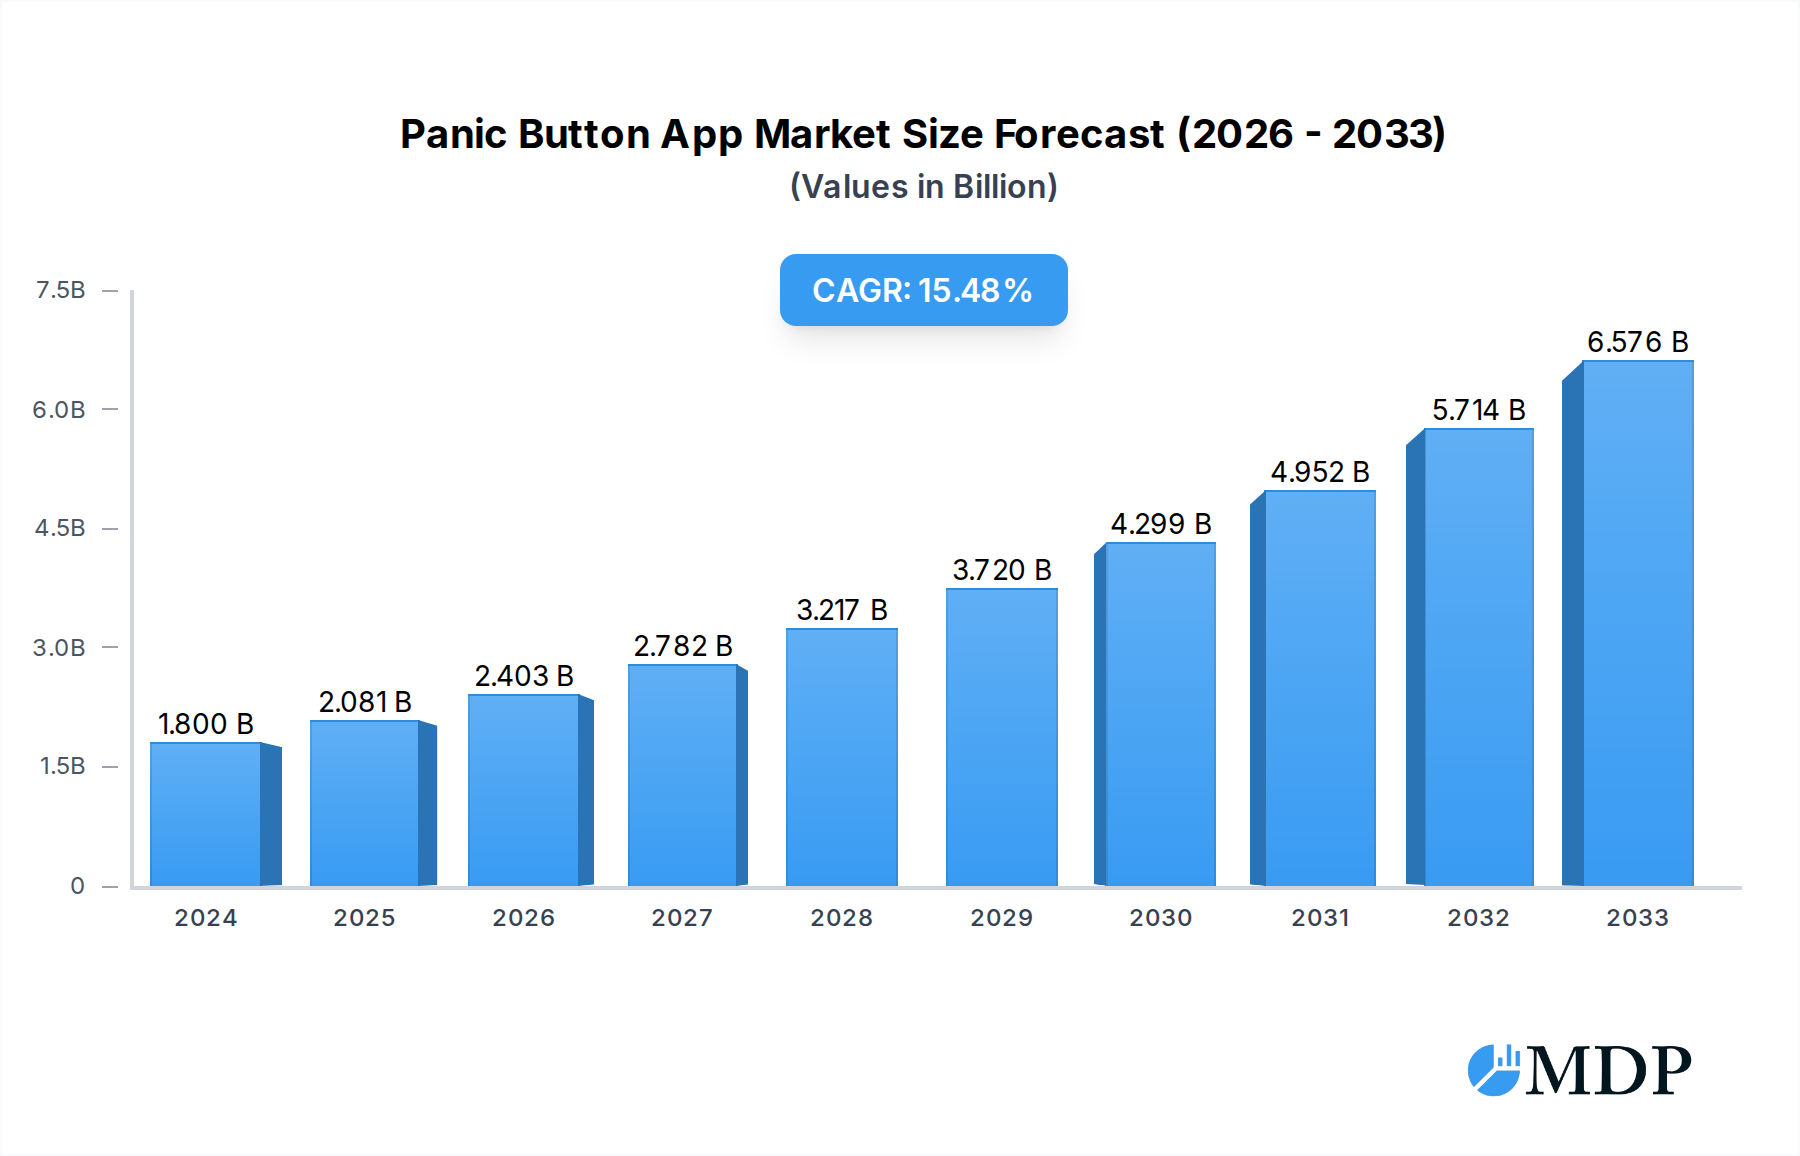
The global panic button app market is experiencing robust expansion, projected to reach an estimated $1.8 billion in 2024. This growth is fueled by an impressive CAGR of 15.6%, indicating a dynamic and rapidly evolving landscape. The increasing adoption of smartphones and a heightened global awareness of personal safety and security needs are primary drivers. This includes a growing demand for enhanced workplace safety measures, the implementation of campus-wide emergency response systems, and the provision of personal safety solutions for travelers. Emerging economies, with their expanding smartphone penetration and rising disposable incomes, are also becoming significant contributors to market growth. The proliferation of advanced features such as real-time location tracking, discreet alerts, and integration with emergency services further bolsters the market's appeal and utility.

Panic Button App Market Size (In Billion)
The market is characterized by intense competition, with a wide array of companies offering diverse solutions catering to specific needs. Innovations in app development, including AI-powered threat detection and seamless integration with wearable devices, are shaping market trends. However, challenges such as data privacy concerns and the need for reliable network connectivity in remote areas present potential restraints. Despite these hurdles, the continuous evolution of technology and the persistent need for immediate safety solutions are expected to drive sustained growth. The market is segmented across various applications, including personal safety, workplace safety, campus safety, and travel safety, with Android and iOS platforms dominating the user base. Geographically, North America and Europe currently lead the market, but the Asia Pacific region is anticipated to witness the fastest growth due to its large population and increasing adoption of digital safety solutions.
Panic Button App Company Market Share
Comprehensive Report: Panic Button App Market Analysis (2019–2033)
Unlock critical insights into the rapidly evolving Panic Button App market, a vital segment of the personal safety app, workplace safety app, and campus safety app industries. This in-depth report, covering the historical period of 2019–2024, base year of 2025, and forecast period of 2025–2033, provides actionable intelligence for stakeholders seeking to understand market dynamics, industry trends, and leading markets for Android and iOS panic button solutions. With an estimated market size projected to reach billions and a significant CAGR, this report is indispensable for anyone involved in the safety technology sector.
Panic Button App Market Dynamics & Concentration
The Panic Button App market exhibits moderate to high concentration, with a significant portion of the market share held by a few key players. Innovation drivers are primarily centered on enhanced GPS accuracy, integration with smart wearables, real-time data streaming, and the development of AI-powered threat detection. Regulatory frameworks are evolving, with an increasing focus on data privacy and emergency response protocols, influencing app development and deployment strategies. Product substitutes, such as dedicated panic alarm devices, are present but the convenience and ubiquity of smartphone-based solutions are driving rapid adoption. End-user trends reveal a growing demand for discreet and instant emergency alert systems across personal, workplace, and campus environments. Merger and acquisition (M&A) activities are on the rise as larger safety technology companies seek to consolidate their market position and acquire innovative startups. We anticipate an average of billions in M&A deal counts within the forecast period, driven by the strategic importance of comprehensive safety solutions. Market share is distributed, with the top 5 companies holding an estimated billions in collective market share.
Panic Button App Industry Trends & Analysis
The Panic Button App industry is poised for substantial growth, driven by escalating concerns for personal and collective safety worldwide. Key growth drivers include the pervasive adoption of smartphones, which provide a readily available platform for emergency alert dissemination, and the increasing awareness of the benefits of immediate, location-aware distress signaling. Technological disruptions are a constant, with advancements in IoT integration, wearable technology compatibility, and sophisticated AI algorithms for predictive safety analytics shaping the future of these applications. Consumer preferences are shifting towards user-friendly interfaces, customizable alert options, and seamless integration with existing communication channels. The competitive landscape is dynamic, characterized by both established safety solution providers and agile startups vying for market dominance. We project a Compound Annual Growth Rate (CAGR) of approximately billions for the panic button app market during the forecast period. Market penetration is expected to surge, reaching an estimated billions of users by 2033, as adoption broadens across diverse demographics and sectors. The increasing demand for integrated safety platforms, encompassing not only panic alerts but also location tracking and communication features, further fuels this upward trajectory. The evolution of cloud computing and secure data storage solutions also plays a crucial role, enabling more robust and reliable emergency response systems.
Leading Markets & Segments in Panic Button App
The Personal Safety segment is currently the dominant force within the Panic Button App market, fueled by widespread individual concerns for security and well-being. Within this segment, Android devices hold a larger market share due to their broader global penetration, although iOS platforms are rapidly closing the gap, particularly in developed economies.
Key Drivers for Personal Safety Dominance:
- Economic Policies: Growing disposable income in emerging markets translates to increased spending on personal security devices and applications.
- Infrastructure: Widespread mobile network coverage and reliable internet access are foundational for effective panic button app functionality.
- Consumer Awareness: Increased media coverage of safety incidents and successful app interventions have raised public awareness of the need for immediate alert systems.
- Technological Advancements: The affordability and accessibility of smartphones make them the primary tool for personal safety solutions.
Dominance Analysis: The widespread adoption of smartphones globally has naturally led to the dominance of the Personal Safety application. Individuals are increasingly seeking proactive measures to ensure their security, whether for daily commutes, solo activities, or during travel. The Travel Safety segment is also experiencing significant growth, driven by an increase in global tourism and business travel. Campus Safety is another key area, with educational institutions prioritizing the safety of students and staff through the implementation of integrated panic button systems. The Workplace Safety segment is witnessing a steady rise, particularly in industries with inherent risks, as employers invest in solutions to protect their employees. The Others segment, encompassing niche applications like lone worker safety in specific professions, also contributes to the overall market expansion. The continued development of cross-platform compatibility and the increasing sophistication of features tailored to specific use cases will further solidify the dominance of these segments.
Panic Button App Product Developments
Recent product developments in the Panic Button App market focus on enhancing user experience and functionality. Innovations include the integration of AI for intelligent alert prioritization, advanced location services with improved indoor positioning, and seamless integration with smartwatches and other wearable devices for discreet activation. Competitive advantages are being built through features like automated check-ins, silent alerts to pre-defined contacts and authorities, and the ability to transmit vital information such as medical history and current surroundings. These advancements cater to the growing demand for more sophisticated and integrated safety solutions across various use cases, from personal security to enterprise-level risk management.
Key Drivers of Panic Button App Growth
The Panic Button App market is experiencing robust growth propelled by several key factors. Technologically, the ubiquitous nature of smartphones, coupled with advancements in GPS accuracy and AI-driven alert systems, provides a powerful foundation. Economically, increasing disposable incomes in emerging markets and a greater emphasis on employee well-being by corporations are driving investment in safety solutions. Regulatory frameworks are also playing a crucial role, with government mandates and industry standards increasingly requiring robust emergency alert systems, particularly in workplaces and educational institutions.
Challenges in the Panic Button App Market
Despite its growth trajectory, the Panic Button App market faces several challenges. Regulatory hurdles, including varying data privacy laws and emergency response protocols across different jurisdictions, can complicate global deployment. Supply chain issues, particularly for hardware components in integrated panic button devices, can lead to production delays and increased costs. Intense competitive pressures from a multitude of players, both established and new entrants, necessitate continuous innovation and competitive pricing strategies. The psychological impact of relying solely on an app, and the potential for false alarms, also present ongoing challenges that require user education and system refinement.
Emerging Opportunities in Panic Button App
Emerging opportunities in the Panic Button App market are abundant, driven by technological breakthroughs and strategic market expansion. The integration of panic button functionalities into broader smart city initiatives and the development of decentralized, blockchain-based safety networks represent significant long-term growth catalysts. Strategic partnerships between app developers and emergency services providers, as well as collaborations with insurance companies to offer reduced premiums for users of advanced safety apps, are also poised to drive market adoption. Furthermore, the growing demand for specialized panic button solutions for vulnerable populations, such as the elderly and individuals with disabilities, presents a substantial untapped market segment.
Leading Players in the Panic Button App Sector
- Little Green Button
- LifeLine
- bSafe
- Silent Beacon
- Crises Control
- Red Panic Button
- Rave Mobile Safety
- notOK App
- Family Locator
- Raptor
- Guarnic
- PeopleSafe
- Anonymous Alerts
- SaferWatch
- AppArmor
- React Mobile
- Navigate360
- Kidgy Panic Button
- Kido Protect
- Smart Button
Key Milestones in Panic Button App Industry
- 2019: Widespread adoption of smartwatch integration for discreet panic alert activation.
- 2020: Increased focus on workplace safety panic button apps following global health events.
- 2021: Significant investment in AI for predictive threat assessment in panic alert systems.
- 2022: Emergence of community-based panic alert networks and peer-to-peer safety features.
- 2023: Standardization efforts for emergency data transmission protocols in safety apps.
- 2024: Enhanced GPS accuracy and indoor positioning capabilities becoming standard.
- 2025: Anticipated surge in enterprise adoption for lone worker safety solutions.
- 2026: Development of integrated panic button solutions for smart home ecosystems.
- 2027: Growing demand for advanced features like video streaming during emergencies.
- 2028: Expansion of panic button app services into emerging markets.
- 2029: Integration of wearable health monitoring data with panic alert systems.
- 2030: Further advancements in AI for natural language processing to interpret user distress signals.
- 2031: Increased regulatory scrutiny on data security and privacy for panic button apps.
- 2032: Development of interoperable panic button systems across different platforms and devices.
- 2033: Widespread adoption of sophisticated, multi-layered safety solutions.
Strategic Outlook for Panic Button App Market
The strategic outlook for the Panic Button App market is exceptionally positive, driven by a confluence of technological innovation and escalating global safety concerns. Growth accelerators include the continued miniaturization and enhanced capabilities of wearable technology, enabling more discreet and efficient panic alert activation. The increasing integration of these apps into broader IoT ecosystems, such as smart homes and connected vehicles, will expand their utility and market reach. Furthermore, strategic partnerships with insurance providers and the development of subscription-based premium safety services will unlock new revenue streams and enhance user engagement. The ongoing focus on data security and compliance with evolving privacy regulations will also shape future development, fostering trust and wider adoption.
Panic Button App Segmentation
-
1. Application
- 1.1. Personal Safety
- 1.2. Workplace Safety
- 1.3. Campus Safety
- 1.4. Travel Safety
- 1.5. Others
-
2. Types
- 2.1. Android
- 2.2. iOS
Panic Button App Segmentation By Geography
-
1. North America
- 1.1. United States
- 1.2. Canada
- 1.3. Mexico
-
2. South America
- 2.1. Brazil
- 2.2. Argentina
- 2.3. Rest of South America
-
3. Europe
- 3.1. United Kingdom
- 3.2. Germany
- 3.3. France
- 3.4. Italy
- 3.5. Spain
- 3.6. Russia
- 3.7. Benelux
- 3.8. Nordics
- 3.9. Rest of Europe
-
4. Middle East & Africa
- 4.1. Turkey
- 4.2. Israel
- 4.3. GCC
- 4.4. North Africa
- 4.5. South Africa
- 4.6. Rest of Middle East & Africa
-
5. Asia Pacific
- 5.1. China
- 5.2. India
- 5.3. Japan
- 5.4. South Korea
- 5.5. ASEAN
- 5.6. Oceania
- 5.7. Rest of Asia Pacific
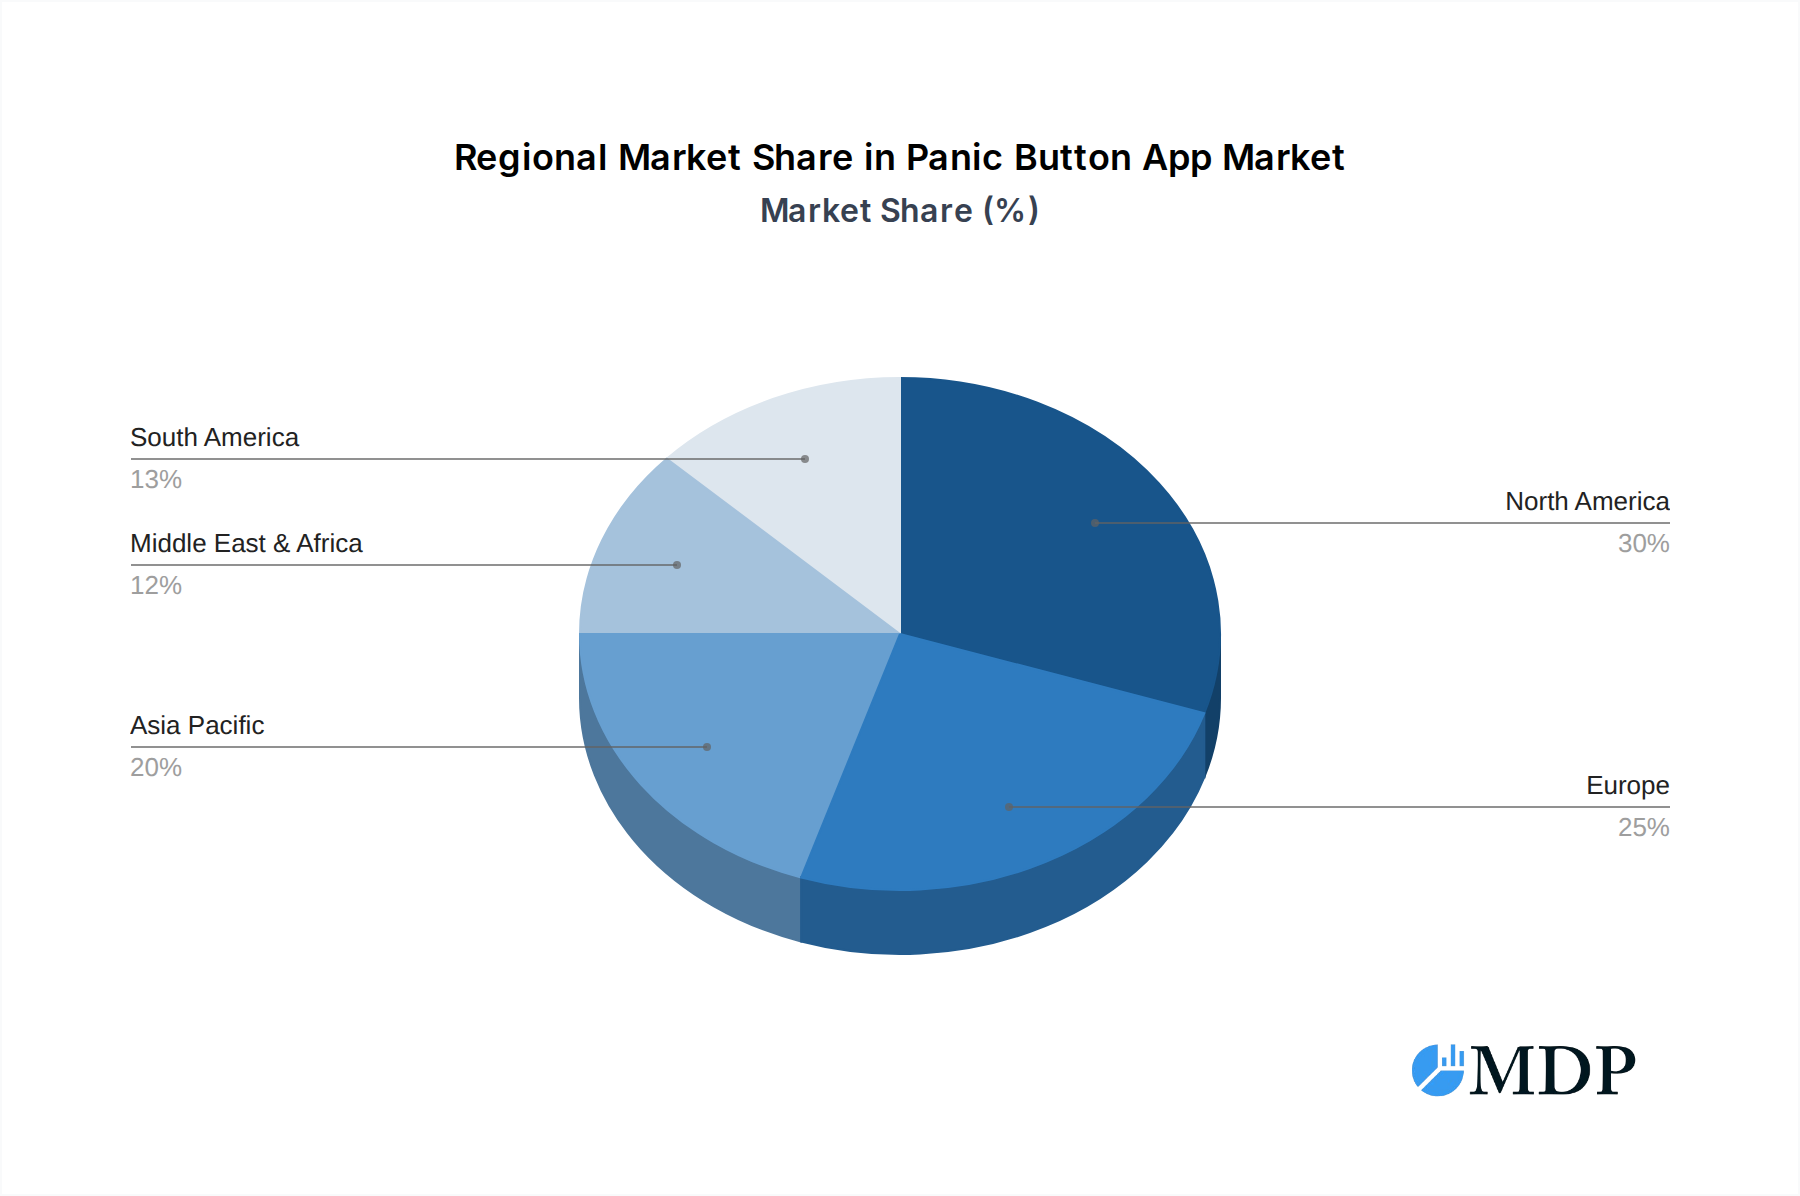
Panic Button App Regional Market Share
Geographic Coverage of Panic Button App
Panic Button App REPORT HIGHLIGHTS
| Aspects | Details |
|---|---|
| Study Period | 2020-2034 |
| Base Year | 2025 |
| Estimated Year | 2026 |
| Forecast Period | 2026-2034 |
| Historical Period | 2020-2025 |
| Growth Rate | CAGR of 15.6% from 2020-2034 |
| Segmentation |
|
Table of Contents
- 1. Introduction
- 1.1. Research Scope
- 1.2. Market Segmentation
- 1.3. Research Methodology
- 1.4. Definitions and Assumptions
- 2. Executive Summary
- 2.1. Introduction
- 3. Market Dynamics
- 3.1. Introduction
- 3.2. Market Drivers
- 3.3. Market Restrains
- 3.4. Market Trends
- 4. Market Factor Analysis
- 4.1. Porters Five Forces
- 4.2. Supply/Value Chain
- 4.3. PESTEL analysis
- 4.4. Market Entropy
- 4.5. Patent/Trademark Analysis
- 5. Global Panic Button App Analysis, Insights and Forecast, 2020-2032
- 5.1. Market Analysis, Insights and Forecast - by Application
- 5.1.1. Personal Safety
- 5.1.2. Workplace Safety
- 5.1.3. Campus Safety
- 5.1.4. Travel Safety
- 5.1.5. Others
- 5.2. Market Analysis, Insights and Forecast - by Types
- 5.2.1. Android
- 5.2.2. iOS
- 5.3. Market Analysis, Insights and Forecast - by Region
- 5.3.1. North America
- 5.3.2. South America
- 5.3.3. Europe
- 5.3.4. Middle East & Africa
- 5.3.5. Asia Pacific
- 5.1. Market Analysis, Insights and Forecast - by Application
- 6. North America Panic Button App Analysis, Insights and Forecast, 2020-2032
- 6.1. Market Analysis, Insights and Forecast - by Application
- 6.1.1. Personal Safety
- 6.1.2. Workplace Safety
- 6.1.3. Campus Safety
- 6.1.4. Travel Safety
- 6.1.5. Others
- 6.2. Market Analysis, Insights and Forecast - by Types
- 6.2.1. Android
- 6.2.2. iOS
- 6.1. Market Analysis, Insights and Forecast - by Application
- 7. South America Panic Button App Analysis, Insights and Forecast, 2020-2032
- 7.1. Market Analysis, Insights and Forecast - by Application
- 7.1.1. Personal Safety
- 7.1.2. Workplace Safety
- 7.1.3. Campus Safety
- 7.1.4. Travel Safety
- 7.1.5. Others
- 7.2. Market Analysis, Insights and Forecast - by Types
- 7.2.1. Android
- 7.2.2. iOS
- 7.1. Market Analysis, Insights and Forecast - by Application
- 8. Europe Panic Button App Analysis, Insights and Forecast, 2020-2032
- 8.1. Market Analysis, Insights and Forecast - by Application
- 8.1.1. Personal Safety
- 8.1.2. Workplace Safety
- 8.1.3. Campus Safety
- 8.1.4. Travel Safety
- 8.1.5. Others
- 8.2. Market Analysis, Insights and Forecast - by Types
- 8.2.1. Android
- 8.2.2. iOS
- 8.1. Market Analysis, Insights and Forecast - by Application
- 9. Middle East & Africa Panic Button App Analysis, Insights and Forecast, 2020-2032
- 9.1. Market Analysis, Insights and Forecast - by Application
- 9.1.1. Personal Safety
- 9.1.2. Workplace Safety
- 9.1.3. Campus Safety
- 9.1.4. Travel Safety
- 9.1.5. Others
- 9.2. Market Analysis, Insights and Forecast - by Types
- 9.2.1. Android
- 9.2.2. iOS
- 9.1. Market Analysis, Insights and Forecast - by Application
- 10. Asia Pacific Panic Button App Analysis, Insights and Forecast, 2020-2032
- 10.1. Market Analysis, Insights and Forecast - by Application
- 10.1.1. Personal Safety
- 10.1.2. Workplace Safety
- 10.1.3. Campus Safety
- 10.1.4. Travel Safety
- 10.1.5. Others
- 10.2. Market Analysis, Insights and Forecast - by Types
- 10.2.1. Android
- 10.2.2. iOS
- 10.1. Market Analysis, Insights and Forecast - by Application
- 11. Competitive Analysis
- 11.1. Global Market Share Analysis 2025
- 11.2. Company Profiles
- 11.2.1 Little Green Button
- 11.2.1.1. Overview
- 11.2.1.2. Products
- 11.2.1.3. SWOT Analysis
- 11.2.1.4. Recent Developments
- 11.2.1.5. Financials (Based on Availability)
- 11.2.2 LifeLine
- 11.2.2.1. Overview
- 11.2.2.2. Products
- 11.2.2.3. SWOT Analysis
- 11.2.2.4. Recent Developments
- 11.2.2.5. Financials (Based on Availability)
- 11.2.3 bSafe
- 11.2.3.1. Overview
- 11.2.3.2. Products
- 11.2.3.3. SWOT Analysis
- 11.2.3.4. Recent Developments
- 11.2.3.5. Financials (Based on Availability)
- 11.2.4 Silent Beacon
- 11.2.4.1. Overview
- 11.2.4.2. Products
- 11.2.4.3. SWOT Analysis
- 11.2.4.4. Recent Developments
- 11.2.4.5. Financials (Based on Availability)
- 11.2.5 Crises Control
- 11.2.5.1. Overview
- 11.2.5.2. Products
- 11.2.5.3. SWOT Analysis
- 11.2.5.4. Recent Developments
- 11.2.5.5. Financials (Based on Availability)
- 11.2.6 Red Panic Button
- 11.2.6.1. Overview
- 11.2.6.2. Products
- 11.2.6.3. SWOT Analysis
- 11.2.6.4. Recent Developments
- 11.2.6.5. Financials (Based on Availability)
- 11.2.7 Rave Mobile Safety
- 11.2.7.1. Overview
- 11.2.7.2. Products
- 11.2.7.3. SWOT Analysis
- 11.2.7.4. Recent Developments
- 11.2.7.5. Financials (Based on Availability)
- 11.2.8 notOK App
- 11.2.8.1. Overview
- 11.2.8.2. Products
- 11.2.8.3. SWOT Analysis
- 11.2.8.4. Recent Developments
- 11.2.8.5. Financials (Based on Availability)
- 11.2.9 Family Locator
- 11.2.9.1. Overview
- 11.2.9.2. Products
- 11.2.9.3. SWOT Analysis
- 11.2.9.4. Recent Developments
- 11.2.9.5. Financials (Based on Availability)
- 11.2.10 Raptor
- 11.2.10.1. Overview
- 11.2.10.2. Products
- 11.2.10.3. SWOT Analysis
- 11.2.10.4. Recent Developments
- 11.2.10.5. Financials (Based on Availability)
- 11.2.11 Guarnic
- 11.2.11.1. Overview
- 11.2.11.2. Products
- 11.2.11.3. SWOT Analysis
- 11.2.11.4. Recent Developments
- 11.2.11.5. Financials (Based on Availability)
- 11.2.12 PeopleSafe
- 11.2.12.1. Overview
- 11.2.12.2. Products
- 11.2.12.3. SWOT Analysis
- 11.2.12.4. Recent Developments
- 11.2.12.5. Financials (Based on Availability)
- 11.2.13 Anonymous Alerts
- 11.2.13.1. Overview
- 11.2.13.2. Products
- 11.2.13.3. SWOT Analysis
- 11.2.13.4. Recent Developments
- 11.2.13.5. Financials (Based on Availability)
- 11.2.14 SaferWatch
- 11.2.14.1. Overview
- 11.2.14.2. Products
- 11.2.14.3. SWOT Analysis
- 11.2.14.4. Recent Developments
- 11.2.14.5. Financials (Based on Availability)
- 11.2.15 AppArmor
- 11.2.15.1. Overview
- 11.2.15.2. Products
- 11.2.15.3. SWOT Analysis
- 11.2.15.4. Recent Developments
- 11.2.15.5. Financials (Based on Availability)
- 11.2.16 React Mobile
- 11.2.16.1. Overview
- 11.2.16.2. Products
- 11.2.16.3. SWOT Analysis
- 11.2.16.4. Recent Developments
- 11.2.16.5. Financials (Based on Availability)
- 11.2.17 Navigate360
- 11.2.17.1. Overview
- 11.2.17.2. Products
- 11.2.17.3. SWOT Analysis
- 11.2.17.4. Recent Developments
- 11.2.17.5. Financials (Based on Availability)
- 11.2.18 Kidgy Panic Button
- 11.2.18.1. Overview
- 11.2.18.2. Products
- 11.2.18.3. SWOT Analysis
- 11.2.18.4. Recent Developments
- 11.2.18.5. Financials (Based on Availability)
- 11.2.19 Kido Protect
- 11.2.19.1. Overview
- 11.2.19.2. Products
- 11.2.19.3. SWOT Analysis
- 11.2.19.4. Recent Developments
- 11.2.19.5. Financials (Based on Availability)
- 11.2.20 Smart Button
- 11.2.20.1. Overview
- 11.2.20.2. Products
- 11.2.20.3. SWOT Analysis
- 11.2.20.4. Recent Developments
- 11.2.20.5. Financials (Based on Availability)
- 11.2.1 Little Green Button
List of Figures
- Figure 1: Global Panic Button App Revenue Breakdown (undefined, %) by Region 2025 & 2033
- Figure 2: North America Panic Button App Revenue (undefined), by Application 2025 & 2033
- Figure 3: North America Panic Button App Revenue Share (%), by Application 2025 & 2033
- Figure 4: North America Panic Button App Revenue (undefined), by Types 2025 & 2033
- Figure 5: North America Panic Button App Revenue Share (%), by Types 2025 & 2033
- Figure 6: North America Panic Button App Revenue (undefined), by Country 2025 & 2033
- Figure 7: North America Panic Button App Revenue Share (%), by Country 2025 & 2033
- Figure 8: South America Panic Button App Revenue (undefined), by Application 2025 & 2033
- Figure 9: South America Panic Button App Revenue Share (%), by Application 2025 & 2033
- Figure 10: South America Panic Button App Revenue (undefined), by Types 2025 & 2033
- Figure 11: South America Panic Button App Revenue Share (%), by Types 2025 & 2033
- Figure 12: South America Panic Button App Revenue (undefined), by Country 2025 & 2033
- Figure 13: South America Panic Button App Revenue Share (%), by Country 2025 & 2033
- Figure 14: Europe Panic Button App Revenue (undefined), by Application 2025 & 2033
- Figure 15: Europe Panic Button App Revenue Share (%), by Application 2025 & 2033
- Figure 16: Europe Panic Button App Revenue (undefined), by Types 2025 & 2033
- Figure 17: Europe Panic Button App Revenue Share (%), by Types 2025 & 2033
- Figure 18: Europe Panic Button App Revenue (undefined), by Country 2025 & 2033
- Figure 19: Europe Panic Button App Revenue Share (%), by Country 2025 & 2033
- Figure 20: Middle East & Africa Panic Button App Revenue (undefined), by Application 2025 & 2033
- Figure 21: Middle East & Africa Panic Button App Revenue Share (%), by Application 2025 & 2033
- Figure 22: Middle East & Africa Panic Button App Revenue (undefined), by Types 2025 & 2033
- Figure 23: Middle East & Africa Panic Button App Revenue Share (%), by Types 2025 & 2033
- Figure 24: Middle East & Africa Panic Button App Revenue (undefined), by Country 2025 & 2033
- Figure 25: Middle East & Africa Panic Button App Revenue Share (%), by Country 2025 & 2033
- Figure 26: Asia Pacific Panic Button App Revenue (undefined), by Application 2025 & 2033
- Figure 27: Asia Pacific Panic Button App Revenue Share (%), by Application 2025 & 2033
- Figure 28: Asia Pacific Panic Button App Revenue (undefined), by Types 2025 & 2033
- Figure 29: Asia Pacific Panic Button App Revenue Share (%), by Types 2025 & 2033
- Figure 30: Asia Pacific Panic Button App Revenue (undefined), by Country 2025 & 2033
- Figure 31: Asia Pacific Panic Button App Revenue Share (%), by Country 2025 & 2033
List of Tables
- Table 1: Global Panic Button App Revenue undefined Forecast, by Application 2020 & 2033
- Table 2: Global Panic Button App Revenue undefined Forecast, by Types 2020 & 2033
- Table 3: Global Panic Button App Revenue undefined Forecast, by Region 2020 & 2033
- Table 4: Global Panic Button App Revenue undefined Forecast, by Application 2020 & 2033
- Table 5: Global Panic Button App Revenue undefined Forecast, by Types 2020 & 2033
- Table 6: Global Panic Button App Revenue undefined Forecast, by Country 2020 & 2033
- Table 7: United States Panic Button App Revenue (undefined) Forecast, by Application 2020 & 2033
- Table 8: Canada Panic Button App Revenue (undefined) Forecast, by Application 2020 & 2033
- Table 9: Mexico Panic Button App Revenue (undefined) Forecast, by Application 2020 & 2033
- Table 10: Global Panic Button App Revenue undefined Forecast, by Application 2020 & 2033
- Table 11: Global Panic Button App Revenue undefined Forecast, by Types 2020 & 2033
- Table 12: Global Panic Button App Revenue undefined Forecast, by Country 2020 & 2033
- Table 13: Brazil Panic Button App Revenue (undefined) Forecast, by Application 2020 & 2033
- Table 14: Argentina Panic Button App Revenue (undefined) Forecast, by Application 2020 & 2033
- Table 15: Rest of South America Panic Button App Revenue (undefined) Forecast, by Application 2020 & 2033
- Table 16: Global Panic Button App Revenue undefined Forecast, by Application 2020 & 2033
- Table 17: Global Panic Button App Revenue undefined Forecast, by Types 2020 & 2033
- Table 18: Global Panic Button App Revenue undefined Forecast, by Country 2020 & 2033
- Table 19: United Kingdom Panic Button App Revenue (undefined) Forecast, by Application 2020 & 2033
- Table 20: Germany Panic Button App Revenue (undefined) Forecast, by Application 2020 & 2033
- Table 21: France Panic Button App Revenue (undefined) Forecast, by Application 2020 & 2033
- Table 22: Italy Panic Button App Revenue (undefined) Forecast, by Application 2020 & 2033
- Table 23: Spain Panic Button App Revenue (undefined) Forecast, by Application 2020 & 2033
- Table 24: Russia Panic Button App Revenue (undefined) Forecast, by Application 2020 & 2033
- Table 25: Benelux Panic Button App Revenue (undefined) Forecast, by Application 2020 & 2033
- Table 26: Nordics Panic Button App Revenue (undefined) Forecast, by Application 2020 & 2033
- Table 27: Rest of Europe Panic Button App Revenue (undefined) Forecast, by Application 2020 & 2033
- Table 28: Global Panic Button App Revenue undefined Forecast, by Application 2020 & 2033
- Table 29: Global Panic Button App Revenue undefined Forecast, by Types 2020 & 2033
- Table 30: Global Panic Button App Revenue undefined Forecast, by Country 2020 & 2033
- Table 31: Turkey Panic Button App Revenue (undefined) Forecast, by Application 2020 & 2033
- Table 32: Israel Panic Button App Revenue (undefined) Forecast, by Application 2020 & 2033
- Table 33: GCC Panic Button App Revenue (undefined) Forecast, by Application 2020 & 2033
- Table 34: North Africa Panic Button App Revenue (undefined) Forecast, by Application 2020 & 2033
- Table 35: South Africa Panic Button App Revenue (undefined) Forecast, by Application 2020 & 2033
- Table 36: Rest of Middle East & Africa Panic Button App Revenue (undefined) Forecast, by Application 2020 & 2033
- Table 37: Global Panic Button App Revenue undefined Forecast, by Application 2020 & 2033
- Table 38: Global Panic Button App Revenue undefined Forecast, by Types 2020 & 2033
- Table 39: Global Panic Button App Revenue undefined Forecast, by Country 2020 & 2033
- Table 40: China Panic Button App Revenue (undefined) Forecast, by Application 2020 & 2033
- Table 41: India Panic Button App Revenue (undefined) Forecast, by Application 2020 & 2033
- Table 42: Japan Panic Button App Revenue (undefined) Forecast, by Application 2020 & 2033
- Table 43: South Korea Panic Button App Revenue (undefined) Forecast, by Application 2020 & 2033
- Table 44: ASEAN Panic Button App Revenue (undefined) Forecast, by Application 2020 & 2033
- Table 45: Oceania Panic Button App Revenue (undefined) Forecast, by Application 2020 & 2033
- Table 46: Rest of Asia Pacific Panic Button App Revenue (undefined) Forecast, by Application 2020 & 2033
Frequently Asked Questions
1. What is the projected Compound Annual Growth Rate (CAGR) of the Panic Button App?
The projected CAGR is approximately 15.6%.
2. Which companies are prominent players in the Panic Button App?
Key companies in the market include Little Green Button, LifeLine, bSafe, Silent Beacon, Crises Control, Red Panic Button, Rave Mobile Safety, notOK App, Family Locator, Raptor, Guarnic, PeopleSafe, Anonymous Alerts, SaferWatch, AppArmor, React Mobile, Navigate360, Kidgy Panic Button, Kido Protect, Smart Button.
3. What are the main segments of the Panic Button App?
The market segments include Application, Types.
4. Can you provide details about the market size?
The market size is estimated to be USD XXX N/A as of 2022.
5. What are some drivers contributing to market growth?
N/A
6. What are the notable trends driving market growth?
N/A
7. Are there any restraints impacting market growth?
N/A
8. Can you provide examples of recent developments in the market?
N/A
9. What pricing options are available for accessing the report?
Pricing options include single-user, multi-user, and enterprise licenses priced at USD 2900.00, USD 4350.00, and USD 5800.00 respectively.
10. Is the market size provided in terms of value or volume?
The market size is provided in terms of value, measured in N/A.
11. Are there any specific market keywords associated with the report?
Yes, the market keyword associated with the report is "Panic Button App," which aids in identifying and referencing the specific market segment covered.
12. How do I determine which pricing option suits my needs best?
The pricing options vary based on user requirements and access needs. Individual users may opt for single-user licenses, while businesses requiring broader access may choose multi-user or enterprise licenses for cost-effective access to the report.
13. Are there any additional resources or data provided in the Panic Button App report?
While the report offers comprehensive insights, it's advisable to review the specific contents or supplementary materials provided to ascertain if additional resources or data are available.
14. How can I stay updated on further developments or reports in the Panic Button App?
To stay informed about further developments, trends, and reports in the Panic Button App, consider subscribing to industry newsletters, following relevant companies and organizations, or regularly checking reputable industry news sources and publications.
Methodology
Step 1 - Identification of Relevant Samples Size from Population Database


Step 2 - Approaches for Defining Global Market Size (Value, Volume* & Price*)

Note*: In applicable scenarios
Step 3 - Data Sources
Primary Research
- Web Analytics
- Survey Reports
- Research Institute
- Latest Research Reports
- Opinion Leaders
Secondary Research
- Annual Reports
- White Paper
- Latest Press Release
- Industry Association
- Paid Database
- Investor Presentations

Step 4 - Data Triangulation
Involves using different sources of information in order to increase the validity of a study
These sources are likely to be stakeholders in a program - participants, other researchers, program staff, other community members, and so on.
Then we put all data in single framework & apply various statistical tools to find out the dynamic on the market.
During the analysis stage, feedback from the stakeholder groups would be compared to determine areas of agreement as well as areas of divergence