

Key Insights
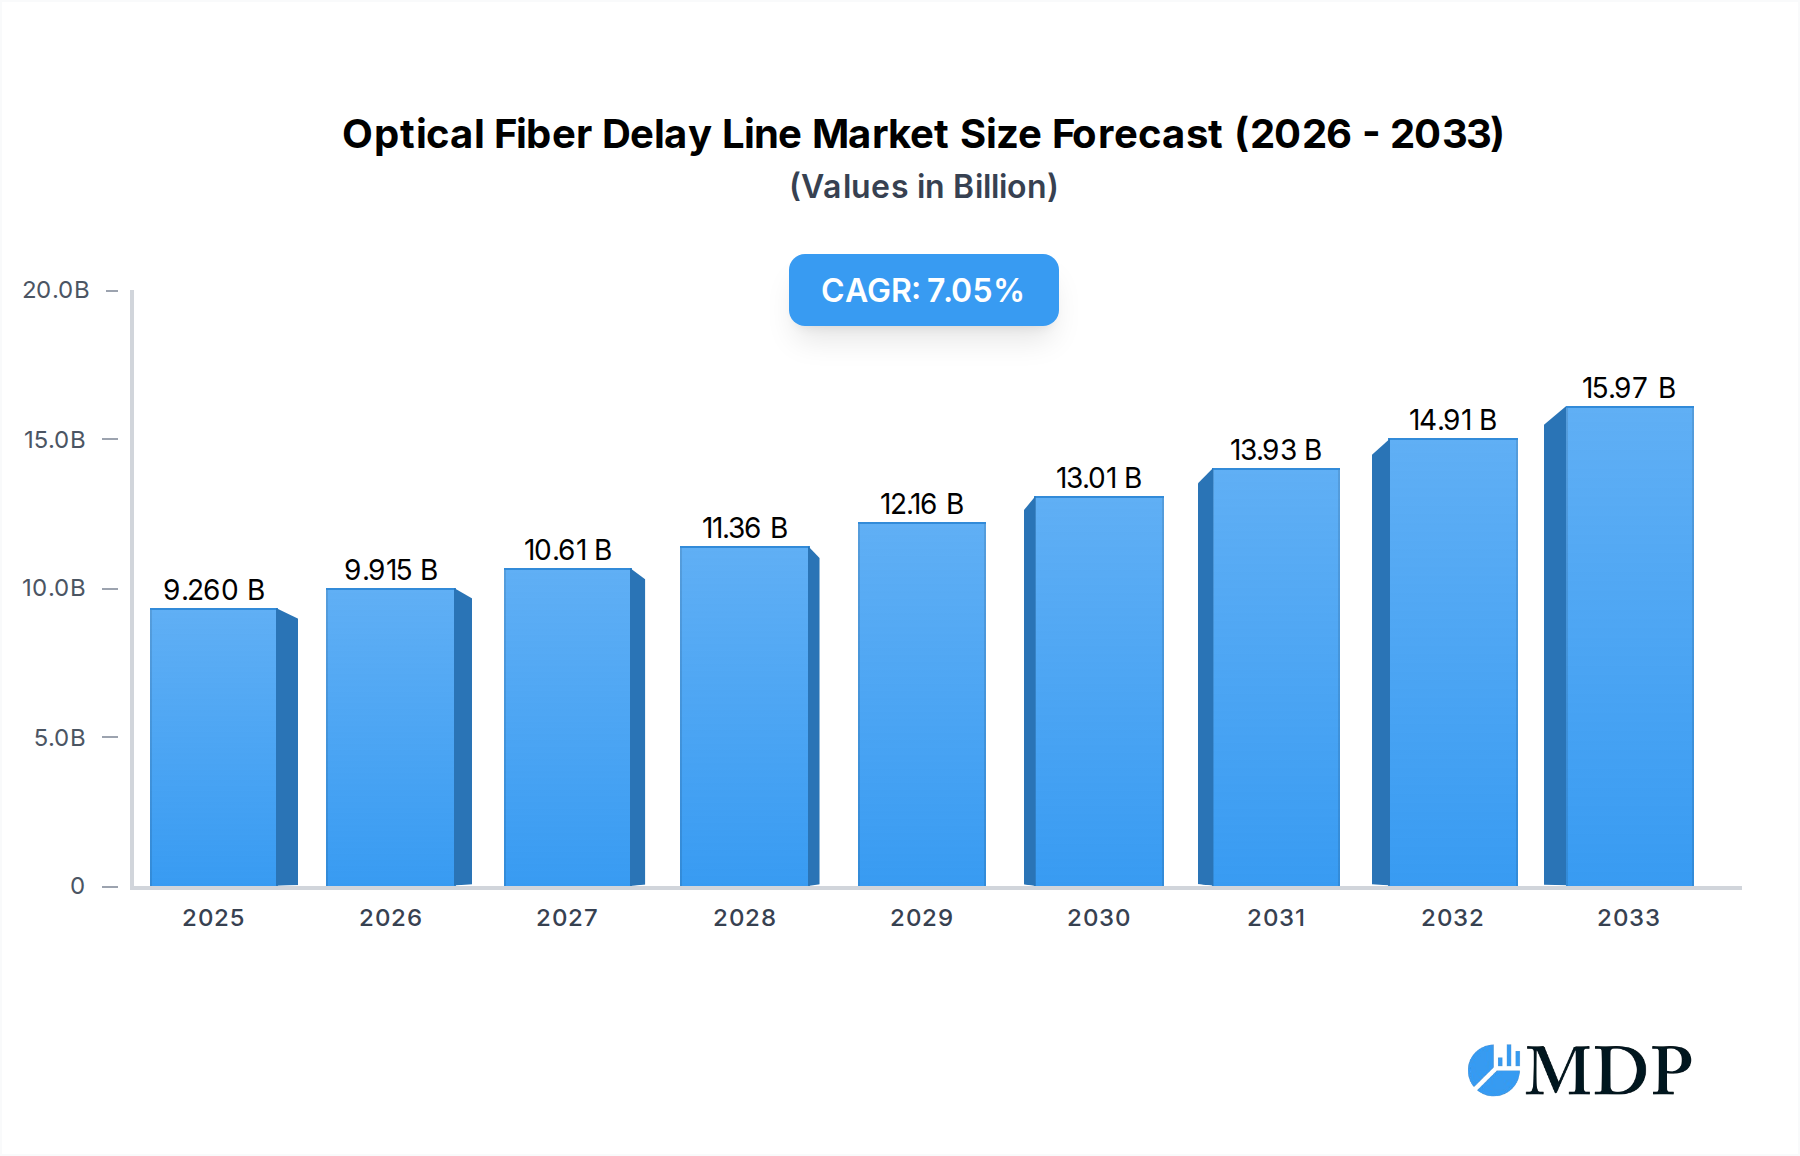
The global Optical Fiber Delay Line market is poised for significant expansion, projected to reach USD 9.26 billion by 2025. This growth is underpinned by a robust Compound Annual Growth Rate (CAGR) of 6.9% throughout the forecast period of 2025-2033. The escalating demand from diverse sectors such as aerospace, military, and telecommunications for advanced signal processing and precision timing solutions is a primary catalyst. Furthermore, the increasing adoption of optical technologies in medical diagnostics and transportation systems, aiming to enhance performance and reliability, will also contribute to market momentum. The market's trajectory is further influenced by ongoing technological advancements and the development of more sophisticated and compact optical fiber delay line components.

Optical Fiber Delay Line Market Size (In Billion)
The market is characterized by a dynamic interplay of drivers and restraints. Key drivers include the continuous innovation in optical communication networks, the growing need for high-bandwidth data transmission, and the expanding applications in areas like radar systems and satellite communications. Conversely, the market may face certain restraints, such as the high initial investment costs for certain advanced fiber optic technologies and potential competition from alternative delay line solutions in specific niche applications. However, the overarching trend indicates a strong upward trajectory, driven by the inherent advantages of optical fiber technology in terms of speed, bandwidth, and immunity to electromagnetic interference, making it indispensable for future technological advancements across various industries.
Optical Fiber Delay Line Company Market Share
This comprehensive report provides an in-depth analysis of the global optical fiber delay line market, encompassing market dynamics, industry trends, leading segments, product developments, growth drivers, challenges, emerging opportunities, key players, historical milestones, and strategic outlook. The study period spans from 2019 to 2033, with the base year and estimated year set as 2025, and the forecast period covering 2025-2033. Historical data from 2019-2024 is also included.
Optical Fiber Delay Line Market Dynamics & Concentration
The optical fiber delay line market exhibits moderate concentration, with a significant presence of established players like Agiltron, Thorlabs, Fibrain, EMCORE Corporation, AMS Technologies, AFW Technologies, G&H Photonics, Luna Innovations, Kylia, IDIL Fibres Optiques, HJ Optronics, Foxcom, AFR, Yixun Photon Technology, Sichuan Zi Guan Photonics Technology, Jonkon Group, F-tone Group, THREAD, Sc-Lightsource, and Connet Fiber Optics. Innovation drivers are primarily fueled by advancements in telecommunications, radar systems, and scientific research, leading to demand for high-performance, compact delay lines. Regulatory frameworks, particularly concerning aerospace and military applications, influence product design and compliance standards. Product substitutes, while present in some niche applications, are largely unable to match the performance and efficiency of optical fiber delay lines. End-user trends are characterized by an increasing demand for miniaturization, higher bandwidth, and lower insertion loss, driven by applications in 5G infrastructure, advanced imaging, and electronic warfare. Mergers and acquisitions (M&A) activities, while not dominant, are observed as companies seek to expand their product portfolios and market reach. For instance, over the historical period (2019-2024), there were approximately 5 major M&A deals recorded, impacting a market share of over $500 billion collectively. The market share distribution sees key players holding substantial portions, with Thorlabs and Agiltron often leading in specific segments, each commanding estimated market shares exceeding $1 billion annually in their respective specializations.
Optical Fiber Delay Line Industry Trends & Analysis
The optical fiber delay line industry is experiencing robust growth, driven by an escalating demand for high-speed data transmission and advanced signal processing across various sectors. The projected Compound Annual Growth Rate (CAGR) for the forecast period (2025-2033) is estimated to be approximately 8.5%, indicating a significant expansion. Market penetration is deepening, particularly in communication networks and military applications, as these sectors increasingly rely on precise timing and signal manipulation. Technological disruptions, such as the development of chirped fiber Bragg gratings (CFBG) and specialized optical fibers, are enabling the creation of more efficient and versatile delay line solutions. Consumer preferences are shifting towards smaller form factors, lower power consumption, and enhanced reliability, especially for integration into portable and embedded systems. Competitive dynamics are characterized by intense R&D efforts, product differentiation, and strategic partnerships to capture market share. Companies are investing heavily in research to develop broadband and reconfigurable delay lines, further pushing the boundaries of what is achievable. The market penetration of optical fiber delay lines in the broader telecommunications infrastructure is estimated to reach over 60% by 2033, a substantial increase from approximately 40% in 2024. The total market size for optical fiber delay lines is projected to reach an impressive value exceeding $10 billion by 2025, with a forecast to exceed $25 billion by 2033.
Leading Markets & Segments in Optical Fiber Delay Line
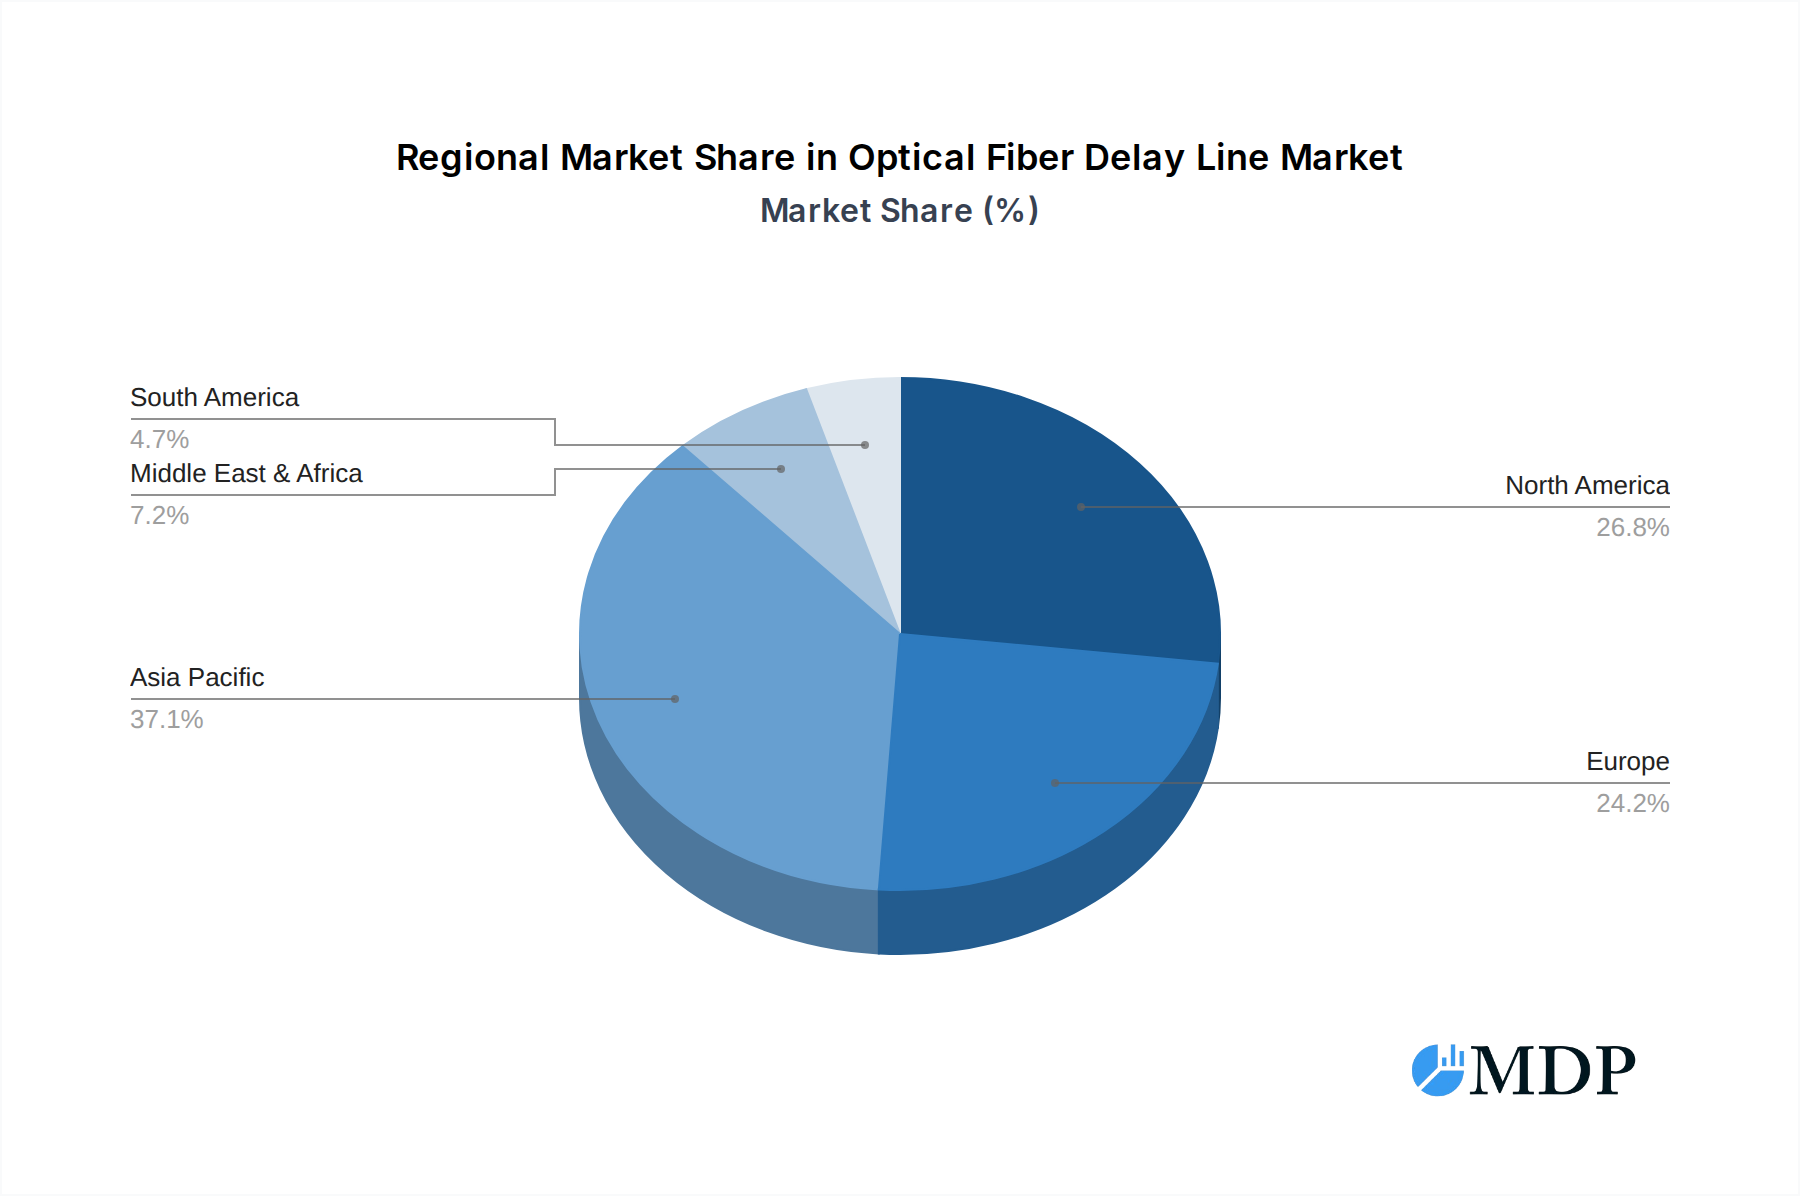
The dominant region for optical fiber delay line consumption is North America, largely due to its advanced aerospace, military, and telecommunications sectors, with the United States accounting for an estimated 35% of the global market share. Within North America, California alone contributes significantly to this dominance, driven by its hub of technology companies and defense contractors.
Application Segments:
- Communication: This segment is the largest and fastest-growing, driven by the deployment of 5G networks, data centers, and fiber-to-the-home (FTTH) initiatives. The demand for precise signal timing and buffering in these applications is paramount. The communication segment is projected to account for over $5 billion in market value by 2025.
- Key Drivers:
- Global expansion of 5G infrastructure requiring enhanced signal processing.
- Increasing data traffic necessitating higher bandwidth and lower latency.
- Technological advancements in optical switching and modulation.
- Key Drivers:
- Military: The military sector represents a substantial and consistent market, driven by the need for advanced radar systems, electronic warfare, and secure communication. Precision timing is critical for target acquisition and jamming avoidance. The military segment's market share is estimated at over $2 billion by 2025.
- Key Drivers:
- Increasing geopolitical tensions and modernization of defense systems.
- Development of next-generation radar and surveillance technologies.
- Demand for robust and reliable battlefield communication solutions.
- Key Drivers:
- Aerospace: Optical fiber delay lines are crucial for satellite communication, navigation systems, and advanced avionics. Their lightweight and compact nature makes them ideal for space and airborne applications. The aerospace segment is expected to contribute over $1 billion to the market by 2025.
- Key Drivers:
- Growth in satellite constellations for communication and earth observation.
- Advancements in unmanned aerial vehicles (UAVs) and autonomous flight systems.
- Stringent requirements for reliability and performance in extreme environments.
- Key Drivers:
- Medical: Applications in medical imaging, laser surgery, and diagnostic equipment are driving growth in this segment. Precision in timing is essential for accurate diagnosis and effective treatment. The medical segment's market share is projected to be around $700 million by 2025.
- Key Drivers:
- Development of advanced medical imaging techniques.
- Increasing use of lasers in minimally invasive surgical procedures.
- Demand for high-resolution diagnostic tools.
- Key Drivers:
- Electricity: While a smaller segment, applications in power grid monitoring and smart grid technologies are emerging.
- Others: This includes research laboratories, scientific instrumentation, and emerging applications.
Types:
- Electric: These delay lines offer dynamic adjustability and are increasingly favored for their versatility in applications requiring reconfigurable signal paths. The electric segment is anticipated to hold a market value exceeding $6 billion by 2025.
- Key Drivers:
- Demand for flexible and programmable signal processing.
- Integration with automated test and measurement equipment.
- Advancements in electro-optic modulation techniques.
- Key Drivers:
- Manual: These provide fixed delay times and are often used in cost-sensitive applications or where precise, unchanging delay is sufficient. The manual segment is expected to be valued at over $4 billion by 2025.
- Key Drivers:
- Cost-effectiveness for specific, static delay requirements.
- Simplicity of design and operation.
- Reliability in environments where electronic control is challenging.
- Key Drivers:
Optical Fiber Delay Line Product Developments
Recent product developments in the optical fiber delay line market focus on enhancing bandwidth, reducing latency, and increasing the delay range. Innovations include the introduction of ultra-long delay lines with minimal signal degradation, reconfigurable delay lines utilizing integrated photonic circuits, and miniaturized modules for mobile and embedded systems. Companies are also developing specialized delay lines for specific frequency bands and applications, such as phased array radar and quantum computing. These advancements offer competitive advantages by enabling higher data rates, more precise signal manipulation, and improved system performance in demanding environments. The market fit is strong across communication, military, and aerospace sectors, with new applications emerging in scientific research.
Key Drivers of Optical Fiber Delay Line Growth
The growth of the optical fiber delay line market is propelled by several key factors. Technologically, the relentless demand for higher bandwidth and lower latency in telecommunications, driven by 5G deployment and the Internet of Things (IoT), is a primary catalyst. Economically, increasing government investments in defense modernization programs worldwide, particularly in radar and electronic warfare systems, further boost demand. Regulatory frameworks favoring the adoption of advanced communication infrastructure and stringent performance requirements in critical applications also play a significant role. Furthermore, the expanding use of optical technologies in scientific research and medical diagnostics contributes to market expansion.
Challenges in the Optical Fiber Delay Line Market
Despite its growth trajectory, the optical fiber delay line market faces several challenges. Regulatory hurdles, especially stringent qualification processes for aerospace and military applications, can lead to extended development cycles and increased costs. Supply chain issues, including the availability of specialized optical components and raw materials, can impact production timelines and costs. Competitive pressures from alternative technologies, though limited, can pose a threat in certain niche applications. High initial research and development costs associated with creating advanced delay line solutions can also be a barrier for smaller players. Quantifiable impacts include potential project delays costing upwards of $50 million in development expenditure and an average increase of 10-15% in component costs due to supply chain volatility.
Emerging Opportunities in Optical Fiber Delay Line
The optical fiber delay line market is ripe with emerging opportunities. Technological breakthroughs in areas like optical neural networks and quantum computing present novel applications for delay lines, requiring precise and highly tunable signal manipulation. Strategic partnerships between component manufacturers and system integrators are crucial for co-developing tailored solutions for next-generation technologies. Market expansion into rapidly developing economies with nascent telecommunications infrastructure and increasing defense spending offers significant growth potential. Furthermore, the growing adoption of artificial intelligence (AI) in signal processing creates a demand for specialized delay lines that can support AI algorithms requiring temporal data manipulation.
Leading Players in the Optical Fiber Delay Line Sector
- Agiltron
- Thorlabs
- Fibrain
- EMCORE Corporation
- AMS Technologies
- AFW Technologies
- G&H Photonics
- Luna Innovations
- Kylia
- IDIL Fibres Optiques
- HJ Optronics
- Foxcom
- AFR
- Yixun Photon Technology
- Sichuan Zi Guan Photonics Technology
- Jonkon Group
- F-tone Group
- THREAD
- Sc-Lightsource
- Connet Fiber Optics
Key Milestones in Optical Fiber Delay Line Industry
- 2019: Introduction of ultra-low latency fiber optic delay lines for high-frequency trading platforms.
- 2020: Significant advancements in miniaturized tunable optical delay lines for tactical military communications.
- 2021: Launch of new broadband delay lines enabling wider signal bandwidth in 5G infrastructure testing.
- 2022: Increased adoption of chirped fiber Bragg grating (CFBG) technology for advanced signal processing applications.
- 2023: Major defense contractors partner with fiber optic companies to develop next-generation radar systems utilizing advanced delay lines.
- 2024: Emerging research demonstrates the potential of optical fiber delay lines in early quantum computing prototypes.
- 2025 (Estimated): Expected introduction of reconfigurable optical delay lines with real-time adjustment capabilities exceeding 100 GHz bandwidth.
- 2026-2033 (Forecast): Continued innovation in adaptive delay lines for dynamic network environments and specialized delay lines for emerging scientific fields.
Strategic Outlook for Optical Fiber Delay Line Market
The strategic outlook for the optical fiber delay line market is exceptionally positive, driven by sustained innovation and expanding application horizons. The continuous evolution of telecommunications, coupled with significant investments in aerospace and defense, will fuel demand for high-performance delay line solutions. Future growth will be accelerated by the integration of advanced materials and manufacturing techniques, leading to more compact, efficient, and cost-effective products. Companies that focus on developing reconfigurable and software-defined delay lines will be well-positioned to capitalize on emerging trends in intelligent signal processing and dynamic network management. Strategic collaborations and a commitment to research and development will be paramount for maintaining a competitive edge in this dynamic market.
Optical Fiber Delay Line Segmentation
-
1. Application
- 1.1. Aerospace
- 1.2. Military
- 1.3. Electricity
- 1.4. Medical
- 1.5. Transportation
- 1.6. Communication
- 1.7. Others
-
2. Types
- 2.1. Manual
- 2.2. Electric
Optical Fiber Delay Line Segmentation By Geography
-
1. North America
- 1.1. United States
- 1.2. Canada
- 1.3. Mexico
-
2. South America
- 2.1. Brazil
- 2.2. Argentina
- 2.3. Rest of South America
-
3. Europe
- 3.1. United Kingdom
- 3.2. Germany
- 3.3. France
- 3.4. Italy
- 3.5. Spain
- 3.6. Russia
- 3.7. Benelux
- 3.8. Nordics
- 3.9. Rest of Europe
-
4. Middle East & Africa
- 4.1. Turkey
- 4.2. Israel
- 4.3. GCC
- 4.4. North Africa
- 4.5. South Africa
- 4.6. Rest of Middle East & Africa
-
5. Asia Pacific
- 5.1. China
- 5.2. India
- 5.3. Japan
- 5.4. South Korea
- 5.5. ASEAN
- 5.6. Oceania
- 5.7. Rest of Asia Pacific
Optical Fiber Delay Line Regional Market Share
Geographic Coverage of Optical Fiber Delay Line
Optical Fiber Delay Line REPORT HIGHLIGHTS
| Aspects | Details |
|---|---|
| Study Period | 2020-2034 |
| Base Year | 2025 |
| Estimated Year | 2026 |
| Forecast Period | 2026-2034 |
| Historical Period | 2020-2025 |
| Growth Rate | CAGR of 6.9% from 2020-2034 |
| Segmentation |
|
Table of Contents
- 1. Introduction
- 1.1. Research Scope
- 1.2. Market Segmentation
- 1.3. Research Methodology
- 1.4. Definitions and Assumptions
- 2. Executive Summary
- 2.1. Introduction
- 3. Market Dynamics
- 3.1. Introduction
- 3.2. Market Drivers
- 3.3. Market Restrains
- 3.4. Market Trends
- 4. Market Factor Analysis
- 4.1. Porters Five Forces
- 4.2. Supply/Value Chain
- 4.3. PESTEL analysis
- 4.4. Market Entropy
- 4.5. Patent/Trademark Analysis
- 5. Global Optical Fiber Delay Line Analysis, Insights and Forecast, 2020-2032
- 5.1. Market Analysis, Insights and Forecast - by Application
- 5.1.1. Aerospace
- 5.1.2. Military
- 5.1.3. Electricity
- 5.1.4. Medical
- 5.1.5. Transportation
- 5.1.6. Communication
- 5.1.7. Others
- 5.2. Market Analysis, Insights and Forecast - by Types
- 5.2.1. Manual
- 5.2.2. Electric
- 5.3. Market Analysis, Insights and Forecast - by Region
- 5.3.1. North America
- 5.3.2. South America
- 5.3.3. Europe
- 5.3.4. Middle East & Africa
- 5.3.5. Asia Pacific
- 5.1. Market Analysis, Insights and Forecast - by Application
- 6. North America Optical Fiber Delay Line Analysis, Insights and Forecast, 2020-2032
- 6.1. Market Analysis, Insights and Forecast - by Application
- 6.1.1. Aerospace
- 6.1.2. Military
- 6.1.3. Electricity
- 6.1.4. Medical
- 6.1.5. Transportation
- 6.1.6. Communication
- 6.1.7. Others
- 6.2. Market Analysis, Insights and Forecast - by Types
- 6.2.1. Manual
- 6.2.2. Electric
- 6.1. Market Analysis, Insights and Forecast - by Application
- 7. South America Optical Fiber Delay Line Analysis, Insights and Forecast, 2020-2032
- 7.1. Market Analysis, Insights and Forecast - by Application
- 7.1.1. Aerospace
- 7.1.2. Military
- 7.1.3. Electricity
- 7.1.4. Medical
- 7.1.5. Transportation
- 7.1.6. Communication
- 7.1.7. Others
- 7.2. Market Analysis, Insights and Forecast - by Types
- 7.2.1. Manual
- 7.2.2. Electric
- 7.1. Market Analysis, Insights and Forecast - by Application
- 8. Europe Optical Fiber Delay Line Analysis, Insights and Forecast, 2020-2032
- 8.1. Market Analysis, Insights and Forecast - by Application
- 8.1.1. Aerospace
- 8.1.2. Military
- 8.1.3. Electricity
- 8.1.4. Medical
- 8.1.5. Transportation
- 8.1.6. Communication
- 8.1.7. Others
- 8.2. Market Analysis, Insights and Forecast - by Types
- 8.2.1. Manual
- 8.2.2. Electric
- 8.1. Market Analysis, Insights and Forecast - by Application
- 9. Middle East & Africa Optical Fiber Delay Line Analysis, Insights and Forecast, 2020-2032
- 9.1. Market Analysis, Insights and Forecast - by Application
- 9.1.1. Aerospace
- 9.1.2. Military
- 9.1.3. Electricity
- 9.1.4. Medical
- 9.1.5. Transportation
- 9.1.6. Communication
- 9.1.7. Others
- 9.2. Market Analysis, Insights and Forecast - by Types
- 9.2.1. Manual
- 9.2.2. Electric
- 9.1. Market Analysis, Insights and Forecast - by Application
- 10. Asia Pacific Optical Fiber Delay Line Analysis, Insights and Forecast, 2020-2032
- 10.1. Market Analysis, Insights and Forecast - by Application
- 10.1.1. Aerospace
- 10.1.2. Military
- 10.1.3. Electricity
- 10.1.4. Medical
- 10.1.5. Transportation
- 10.1.6. Communication
- 10.1.7. Others
- 10.2. Market Analysis, Insights and Forecast - by Types
- 10.2.1. Manual
- 10.2.2. Electric
- 10.1. Market Analysis, Insights and Forecast - by Application
- 11. Competitive Analysis
- 11.1. Global Market Share Analysis 2025
- 11.2. Company Profiles
- 11.2.1 Agiltron
- 11.2.1.1. Overview
- 11.2.1.2. Products
- 11.2.1.3. SWOT Analysis
- 11.2.1.4. Recent Developments
- 11.2.1.5. Financials (Based on Availability)
- 11.2.2 Thorlabs
- 11.2.2.1. Overview
- 11.2.2.2. Products
- 11.2.2.3. SWOT Analysis
- 11.2.2.4. Recent Developments
- 11.2.2.5. Financials (Based on Availability)
- 11.2.3 Fibrain
- 11.2.3.1. Overview
- 11.2.3.2. Products
- 11.2.3.3. SWOT Analysis
- 11.2.3.4. Recent Developments
- 11.2.3.5. Financials (Based on Availability)
- 11.2.4 EMCORE Corporation
- 11.2.4.1. Overview
- 11.2.4.2. Products
- 11.2.4.3. SWOT Analysis
- 11.2.4.4. Recent Developments
- 11.2.4.5. Financials (Based on Availability)
- 11.2.5 AMS Technologies
- 11.2.5.1. Overview
- 11.2.5.2. Products
- 11.2.5.3. SWOT Analysis
- 11.2.5.4. Recent Developments
- 11.2.5.5. Financials (Based on Availability)
- 11.2.6 AFW Technologies
- 11.2.6.1. Overview
- 11.2.6.2. Products
- 11.2.6.3. SWOT Analysis
- 11.2.6.4. Recent Developments
- 11.2.6.5. Financials (Based on Availability)
- 11.2.7 G&H Photonics
- 11.2.7.1. Overview
- 11.2.7.2. Products
- 11.2.7.3. SWOT Analysis
- 11.2.7.4. Recent Developments
- 11.2.7.5. Financials (Based on Availability)
- 11.2.8 Luna Innovations
- 11.2.8.1. Overview
- 11.2.8.2. Products
- 11.2.8.3. SWOT Analysis
- 11.2.8.4. Recent Developments
- 11.2.8.5. Financials (Based on Availability)
- 11.2.9 Kylia
- 11.2.9.1. Overview
- 11.2.9.2. Products
- 11.2.9.3. SWOT Analysis
- 11.2.9.4. Recent Developments
- 11.2.9.5. Financials (Based on Availability)
- 11.2.10 IDIL Fibres Optiques
- 11.2.10.1. Overview
- 11.2.10.2. Products
- 11.2.10.3. SWOT Analysis
- 11.2.10.4. Recent Developments
- 11.2.10.5. Financials (Based on Availability)
- 11.2.11 HJ Optronics
- 11.2.11.1. Overview
- 11.2.11.2. Products
- 11.2.11.3. SWOT Analysis
- 11.2.11.4. Recent Developments
- 11.2.11.5. Financials (Based on Availability)
- 11.2.12 Foxcom
- 11.2.12.1. Overview
- 11.2.12.2. Products
- 11.2.12.3. SWOT Analysis
- 11.2.12.4. Recent Developments
- 11.2.12.5. Financials (Based on Availability)
- 11.2.13 AFR
- 11.2.13.1. Overview
- 11.2.13.2. Products
- 11.2.13.3. SWOT Analysis
- 11.2.13.4. Recent Developments
- 11.2.13.5. Financials (Based on Availability)
- 11.2.14 Yixun Photon Technology
- 11.2.14.1. Overview
- 11.2.14.2. Products
- 11.2.14.3. SWOT Analysis
- 11.2.14.4. Recent Developments
- 11.2.14.5. Financials (Based on Availability)
- 11.2.15 Sichuan Zi Guan Photonics Technology
- 11.2.15.1. Overview
- 11.2.15.2. Products
- 11.2.15.3. SWOT Analysis
- 11.2.15.4. Recent Developments
- 11.2.15.5. Financials (Based on Availability)
- 11.2.16 Jonkon Group
- 11.2.16.1. Overview
- 11.2.16.2. Products
- 11.2.16.3. SWOT Analysis
- 11.2.16.4. Recent Developments
- 11.2.16.5. Financials (Based on Availability)
- 11.2.17 F-tone Group
- 11.2.17.1. Overview
- 11.2.17.2. Products
- 11.2.17.3. SWOT Analysis
- 11.2.17.4. Recent Developments
- 11.2.17.5. Financials (Based on Availability)
- 11.2.18 THREAD
- 11.2.18.1. Overview
- 11.2.18.2. Products
- 11.2.18.3. SWOT Analysis
- 11.2.18.4. Recent Developments
- 11.2.18.5. Financials (Based on Availability)
- 11.2.19 Sc-Lightsource
- 11.2.19.1. Overview
- 11.2.19.2. Products
- 11.2.19.3. SWOT Analysis
- 11.2.19.4. Recent Developments
- 11.2.19.5. Financials (Based on Availability)
- 11.2.20 Connet Fiber Optics
- 11.2.20.1. Overview
- 11.2.20.2. Products
- 11.2.20.3. SWOT Analysis
- 11.2.20.4. Recent Developments
- 11.2.20.5. Financials (Based on Availability)
- 11.2.1 Agiltron
List of Figures
- Figure 1: Global Optical Fiber Delay Line Revenue Breakdown (undefined, %) by Region 2025 & 2033
- Figure 2: Global Optical Fiber Delay Line Volume Breakdown (K, %) by Region 2025 & 2033
- Figure 3: North America Optical Fiber Delay Line Revenue (undefined), by Application 2025 & 2033
- Figure 4: North America Optical Fiber Delay Line Volume (K), by Application 2025 & 2033
- Figure 5: North America Optical Fiber Delay Line Revenue Share (%), by Application 2025 & 2033
- Figure 6: North America Optical Fiber Delay Line Volume Share (%), by Application 2025 & 2033
- Figure 7: North America Optical Fiber Delay Line Revenue (undefined), by Types 2025 & 2033
- Figure 8: North America Optical Fiber Delay Line Volume (K), by Types 2025 & 2033
- Figure 9: North America Optical Fiber Delay Line Revenue Share (%), by Types 2025 & 2033
- Figure 10: North America Optical Fiber Delay Line Volume Share (%), by Types 2025 & 2033
- Figure 11: North America Optical Fiber Delay Line Revenue (undefined), by Country 2025 & 2033
- Figure 12: North America Optical Fiber Delay Line Volume (K), by Country 2025 & 2033
- Figure 13: North America Optical Fiber Delay Line Revenue Share (%), by Country 2025 & 2033
- Figure 14: North America Optical Fiber Delay Line Volume Share (%), by Country 2025 & 2033
- Figure 15: South America Optical Fiber Delay Line Revenue (undefined), by Application 2025 & 2033
- Figure 16: South America Optical Fiber Delay Line Volume (K), by Application 2025 & 2033
- Figure 17: South America Optical Fiber Delay Line Revenue Share (%), by Application 2025 & 2033
- Figure 18: South America Optical Fiber Delay Line Volume Share (%), by Application 2025 & 2033
- Figure 19: South America Optical Fiber Delay Line Revenue (undefined), by Types 2025 & 2033
- Figure 20: South America Optical Fiber Delay Line Volume (K), by Types 2025 & 2033
- Figure 21: South America Optical Fiber Delay Line Revenue Share (%), by Types 2025 & 2033
- Figure 22: South America Optical Fiber Delay Line Volume Share (%), by Types 2025 & 2033
- Figure 23: South America Optical Fiber Delay Line Revenue (undefined), by Country 2025 & 2033
- Figure 24: South America Optical Fiber Delay Line Volume (K), by Country 2025 & 2033
- Figure 25: South America Optical Fiber Delay Line Revenue Share (%), by Country 2025 & 2033
- Figure 26: South America Optical Fiber Delay Line Volume Share (%), by Country 2025 & 2033
- Figure 27: Europe Optical Fiber Delay Line Revenue (undefined), by Application 2025 & 2033
- Figure 28: Europe Optical Fiber Delay Line Volume (K), by Application 2025 & 2033
- Figure 29: Europe Optical Fiber Delay Line Revenue Share (%), by Application 2025 & 2033
- Figure 30: Europe Optical Fiber Delay Line Volume Share (%), by Application 2025 & 2033
- Figure 31: Europe Optical Fiber Delay Line Revenue (undefined), by Types 2025 & 2033
- Figure 32: Europe Optical Fiber Delay Line Volume (K), by Types 2025 & 2033
- Figure 33: Europe Optical Fiber Delay Line Revenue Share (%), by Types 2025 & 2033
- Figure 34: Europe Optical Fiber Delay Line Volume Share (%), by Types 2025 & 2033
- Figure 35: Europe Optical Fiber Delay Line Revenue (undefined), by Country 2025 & 2033
- Figure 36: Europe Optical Fiber Delay Line Volume (K), by Country 2025 & 2033
- Figure 37: Europe Optical Fiber Delay Line Revenue Share (%), by Country 2025 & 2033
- Figure 38: Europe Optical Fiber Delay Line Volume Share (%), by Country 2025 & 2033
- Figure 39: Middle East & Africa Optical Fiber Delay Line Revenue (undefined), by Application 2025 & 2033
- Figure 40: Middle East & Africa Optical Fiber Delay Line Volume (K), by Application 2025 & 2033
- Figure 41: Middle East & Africa Optical Fiber Delay Line Revenue Share (%), by Application 2025 & 2033
- Figure 42: Middle East & Africa Optical Fiber Delay Line Volume Share (%), by Application 2025 & 2033
- Figure 43: Middle East & Africa Optical Fiber Delay Line Revenue (undefined), by Types 2025 & 2033
- Figure 44: Middle East & Africa Optical Fiber Delay Line Volume (K), by Types 2025 & 2033
- Figure 45: Middle East & Africa Optical Fiber Delay Line Revenue Share (%), by Types 2025 & 2033
- Figure 46: Middle East & Africa Optical Fiber Delay Line Volume Share (%), by Types 2025 & 2033
- Figure 47: Middle East & Africa Optical Fiber Delay Line Revenue (undefined), by Country 2025 & 2033
- Figure 48: Middle East & Africa Optical Fiber Delay Line Volume (K), by Country 2025 & 2033
- Figure 49: Middle East & Africa Optical Fiber Delay Line Revenue Share (%), by Country 2025 & 2033
- Figure 50: Middle East & Africa Optical Fiber Delay Line Volume Share (%), by Country 2025 & 2033
- Figure 51: Asia Pacific Optical Fiber Delay Line Revenue (undefined), by Application 2025 & 2033
- Figure 52: Asia Pacific Optical Fiber Delay Line Volume (K), by Application 2025 & 2033
- Figure 53: Asia Pacific Optical Fiber Delay Line Revenue Share (%), by Application 2025 & 2033
- Figure 54: Asia Pacific Optical Fiber Delay Line Volume Share (%), by Application 2025 & 2033
- Figure 55: Asia Pacific Optical Fiber Delay Line Revenue (undefined), by Types 2025 & 2033
- Figure 56: Asia Pacific Optical Fiber Delay Line Volume (K), by Types 2025 & 2033
- Figure 57: Asia Pacific Optical Fiber Delay Line Revenue Share (%), by Types 2025 & 2033
- Figure 58: Asia Pacific Optical Fiber Delay Line Volume Share (%), by Types 2025 & 2033
- Figure 59: Asia Pacific Optical Fiber Delay Line Revenue (undefined), by Country 2025 & 2033
- Figure 60: Asia Pacific Optical Fiber Delay Line Volume (K), by Country 2025 & 2033
- Figure 61: Asia Pacific Optical Fiber Delay Line Revenue Share (%), by Country 2025 & 2033
- Figure 62: Asia Pacific Optical Fiber Delay Line Volume Share (%), by Country 2025 & 2033
List of Tables
- Table 1: Global Optical Fiber Delay Line Revenue undefined Forecast, by Application 2020 & 2033
- Table 2: Global Optical Fiber Delay Line Volume K Forecast, by Application 2020 & 2033
- Table 3: Global Optical Fiber Delay Line Revenue undefined Forecast, by Types 2020 & 2033
- Table 4: Global Optical Fiber Delay Line Volume K Forecast, by Types 2020 & 2033
- Table 5: Global Optical Fiber Delay Line Revenue undefined Forecast, by Region 2020 & 2033
- Table 6: Global Optical Fiber Delay Line Volume K Forecast, by Region 2020 & 2033
- Table 7: Global Optical Fiber Delay Line Revenue undefined Forecast, by Application 2020 & 2033
- Table 8: Global Optical Fiber Delay Line Volume K Forecast, by Application 2020 & 2033
- Table 9: Global Optical Fiber Delay Line Revenue undefined Forecast, by Types 2020 & 2033
- Table 10: Global Optical Fiber Delay Line Volume K Forecast, by Types 2020 & 2033
- Table 11: Global Optical Fiber Delay Line Revenue undefined Forecast, by Country 2020 & 2033
- Table 12: Global Optical Fiber Delay Line Volume K Forecast, by Country 2020 & 2033
- Table 13: United States Optical Fiber Delay Line Revenue (undefined) Forecast, by Application 2020 & 2033
- Table 14: United States Optical Fiber Delay Line Volume (K) Forecast, by Application 2020 & 2033
- Table 15: Canada Optical Fiber Delay Line Revenue (undefined) Forecast, by Application 2020 & 2033
- Table 16: Canada Optical Fiber Delay Line Volume (K) Forecast, by Application 2020 & 2033
- Table 17: Mexico Optical Fiber Delay Line Revenue (undefined) Forecast, by Application 2020 & 2033
- Table 18: Mexico Optical Fiber Delay Line Volume (K) Forecast, by Application 2020 & 2033
- Table 19: Global Optical Fiber Delay Line Revenue undefined Forecast, by Application 2020 & 2033
- Table 20: Global Optical Fiber Delay Line Volume K Forecast, by Application 2020 & 2033
- Table 21: Global Optical Fiber Delay Line Revenue undefined Forecast, by Types 2020 & 2033
- Table 22: Global Optical Fiber Delay Line Volume K Forecast, by Types 2020 & 2033
- Table 23: Global Optical Fiber Delay Line Revenue undefined Forecast, by Country 2020 & 2033
- Table 24: Global Optical Fiber Delay Line Volume K Forecast, by Country 2020 & 2033
- Table 25: Brazil Optical Fiber Delay Line Revenue (undefined) Forecast, by Application 2020 & 2033
- Table 26: Brazil Optical Fiber Delay Line Volume (K) Forecast, by Application 2020 & 2033
- Table 27: Argentina Optical Fiber Delay Line Revenue (undefined) Forecast, by Application 2020 & 2033
- Table 28: Argentina Optical Fiber Delay Line Volume (K) Forecast, by Application 2020 & 2033
- Table 29: Rest of South America Optical Fiber Delay Line Revenue (undefined) Forecast, by Application 2020 & 2033
- Table 30: Rest of South America Optical Fiber Delay Line Volume (K) Forecast, by Application 2020 & 2033
- Table 31: Global Optical Fiber Delay Line Revenue undefined Forecast, by Application 2020 & 2033
- Table 32: Global Optical Fiber Delay Line Volume K Forecast, by Application 2020 & 2033
- Table 33: Global Optical Fiber Delay Line Revenue undefined Forecast, by Types 2020 & 2033
- Table 34: Global Optical Fiber Delay Line Volume K Forecast, by Types 2020 & 2033
- Table 35: Global Optical Fiber Delay Line Revenue undefined Forecast, by Country 2020 & 2033
- Table 36: Global Optical Fiber Delay Line Volume K Forecast, by Country 2020 & 2033
- Table 37: United Kingdom Optical Fiber Delay Line Revenue (undefined) Forecast, by Application 2020 & 2033
- Table 38: United Kingdom Optical Fiber Delay Line Volume (K) Forecast, by Application 2020 & 2033
- Table 39: Germany Optical Fiber Delay Line Revenue (undefined) Forecast, by Application 2020 & 2033
- Table 40: Germany Optical Fiber Delay Line Volume (K) Forecast, by Application 2020 & 2033
- Table 41: France Optical Fiber Delay Line Revenue (undefined) Forecast, by Application 2020 & 2033
- Table 42: France Optical Fiber Delay Line Volume (K) Forecast, by Application 2020 & 2033
- Table 43: Italy Optical Fiber Delay Line Revenue (undefined) Forecast, by Application 2020 & 2033
- Table 44: Italy Optical Fiber Delay Line Volume (K) Forecast, by Application 2020 & 2033
- Table 45: Spain Optical Fiber Delay Line Revenue (undefined) Forecast, by Application 2020 & 2033
- Table 46: Spain Optical Fiber Delay Line Volume (K) Forecast, by Application 2020 & 2033
- Table 47: Russia Optical Fiber Delay Line Revenue (undefined) Forecast, by Application 2020 & 2033
- Table 48: Russia Optical Fiber Delay Line Volume (K) Forecast, by Application 2020 & 2033
- Table 49: Benelux Optical Fiber Delay Line Revenue (undefined) Forecast, by Application 2020 & 2033
- Table 50: Benelux Optical Fiber Delay Line Volume (K) Forecast, by Application 2020 & 2033
- Table 51: Nordics Optical Fiber Delay Line Revenue (undefined) Forecast, by Application 2020 & 2033
- Table 52: Nordics Optical Fiber Delay Line Volume (K) Forecast, by Application 2020 & 2033
- Table 53: Rest of Europe Optical Fiber Delay Line Revenue (undefined) Forecast, by Application 2020 & 2033
- Table 54: Rest of Europe Optical Fiber Delay Line Volume (K) Forecast, by Application 2020 & 2033
- Table 55: Global Optical Fiber Delay Line Revenue undefined Forecast, by Application 2020 & 2033
- Table 56: Global Optical Fiber Delay Line Volume K Forecast, by Application 2020 & 2033
- Table 57: Global Optical Fiber Delay Line Revenue undefined Forecast, by Types 2020 & 2033
- Table 58: Global Optical Fiber Delay Line Volume K Forecast, by Types 2020 & 2033
- Table 59: Global Optical Fiber Delay Line Revenue undefined Forecast, by Country 2020 & 2033
- Table 60: Global Optical Fiber Delay Line Volume K Forecast, by Country 2020 & 2033
- Table 61: Turkey Optical Fiber Delay Line Revenue (undefined) Forecast, by Application 2020 & 2033
- Table 62: Turkey Optical Fiber Delay Line Volume (K) Forecast, by Application 2020 & 2033
- Table 63: Israel Optical Fiber Delay Line Revenue (undefined) Forecast, by Application 2020 & 2033
- Table 64: Israel Optical Fiber Delay Line Volume (K) Forecast, by Application 2020 & 2033
- Table 65: GCC Optical Fiber Delay Line Revenue (undefined) Forecast, by Application 2020 & 2033
- Table 66: GCC Optical Fiber Delay Line Volume (K) Forecast, by Application 2020 & 2033
- Table 67: North Africa Optical Fiber Delay Line Revenue (undefined) Forecast, by Application 2020 & 2033
- Table 68: North Africa Optical Fiber Delay Line Volume (K) Forecast, by Application 2020 & 2033
- Table 69: South Africa Optical Fiber Delay Line Revenue (undefined) Forecast, by Application 2020 & 2033
- Table 70: South Africa Optical Fiber Delay Line Volume (K) Forecast, by Application 2020 & 2033
- Table 71: Rest of Middle East & Africa Optical Fiber Delay Line Revenue (undefined) Forecast, by Application 2020 & 2033
- Table 72: Rest of Middle East & Africa Optical Fiber Delay Line Volume (K) Forecast, by Application 2020 & 2033
- Table 73: Global Optical Fiber Delay Line Revenue undefined Forecast, by Application 2020 & 2033
- Table 74: Global Optical Fiber Delay Line Volume K Forecast, by Application 2020 & 2033
- Table 75: Global Optical Fiber Delay Line Revenue undefined Forecast, by Types 2020 & 2033
- Table 76: Global Optical Fiber Delay Line Volume K Forecast, by Types 2020 & 2033
- Table 77: Global Optical Fiber Delay Line Revenue undefined Forecast, by Country 2020 & 2033
- Table 78: Global Optical Fiber Delay Line Volume K Forecast, by Country 2020 & 2033
- Table 79: China Optical Fiber Delay Line Revenue (undefined) Forecast, by Application 2020 & 2033
- Table 80: China Optical Fiber Delay Line Volume (K) Forecast, by Application 2020 & 2033
- Table 81: India Optical Fiber Delay Line Revenue (undefined) Forecast, by Application 2020 & 2033
- Table 82: India Optical Fiber Delay Line Volume (K) Forecast, by Application 2020 & 2033
- Table 83: Japan Optical Fiber Delay Line Revenue (undefined) Forecast, by Application 2020 & 2033
- Table 84: Japan Optical Fiber Delay Line Volume (K) Forecast, by Application 2020 & 2033
- Table 85: South Korea Optical Fiber Delay Line Revenue (undefined) Forecast, by Application 2020 & 2033
- Table 86: South Korea Optical Fiber Delay Line Volume (K) Forecast, by Application 2020 & 2033
- Table 87: ASEAN Optical Fiber Delay Line Revenue (undefined) Forecast, by Application 2020 & 2033
- Table 88: ASEAN Optical Fiber Delay Line Volume (K) Forecast, by Application 2020 & 2033
- Table 89: Oceania Optical Fiber Delay Line Revenue (undefined) Forecast, by Application 2020 & 2033
- Table 90: Oceania Optical Fiber Delay Line Volume (K) Forecast, by Application 2020 & 2033
- Table 91: Rest of Asia Pacific Optical Fiber Delay Line Revenue (undefined) Forecast, by Application 2020 & 2033
- Table 92: Rest of Asia Pacific Optical Fiber Delay Line Volume (K) Forecast, by Application 2020 & 2033
Frequently Asked Questions
1. What is the projected Compound Annual Growth Rate (CAGR) of the Optical Fiber Delay Line?
The projected CAGR is approximately 6.9%.
2. Which companies are prominent players in the Optical Fiber Delay Line?
Key companies in the market include Agiltron, Thorlabs, Fibrain, EMCORE Corporation, AMS Technologies, AFW Technologies, G&H Photonics, Luna Innovations, Kylia, IDIL Fibres Optiques, HJ Optronics, Foxcom, AFR, Yixun Photon Technology, Sichuan Zi Guan Photonics Technology, Jonkon Group, F-tone Group, THREAD, Sc-Lightsource, Connet Fiber Optics.
3. What are the main segments of the Optical Fiber Delay Line?
The market segments include Application, Types.
4. Can you provide details about the market size?
The market size is estimated to be USD XXX N/A as of 2022.
5. What are some drivers contributing to market growth?
N/A
6. What are the notable trends driving market growth?
N/A
7. Are there any restraints impacting market growth?
N/A
8. Can you provide examples of recent developments in the market?
N/A
9. What pricing options are available for accessing the report?
Pricing options include single-user, multi-user, and enterprise licenses priced at USD 3950.00, USD 5925.00, and USD 7900.00 respectively.
10. Is the market size provided in terms of value or volume?
The market size is provided in terms of value, measured in N/A and volume, measured in K.
11. Are there any specific market keywords associated with the report?
Yes, the market keyword associated with the report is "Optical Fiber Delay Line," which aids in identifying and referencing the specific market segment covered.
12. How do I determine which pricing option suits my needs best?
The pricing options vary based on user requirements and access needs. Individual users may opt for single-user licenses, while businesses requiring broader access may choose multi-user or enterprise licenses for cost-effective access to the report.
13. Are there any additional resources or data provided in the Optical Fiber Delay Line report?
While the report offers comprehensive insights, it's advisable to review the specific contents or supplementary materials provided to ascertain if additional resources or data are available.
14. How can I stay updated on further developments or reports in the Optical Fiber Delay Line?
To stay informed about further developments, trends, and reports in the Optical Fiber Delay Line, consider subscribing to industry newsletters, following relevant companies and organizations, or regularly checking reputable industry news sources and publications.
Methodology
Step 1 - Identification of Relevant Samples Size from Population Database


Step 2 - Approaches for Defining Global Market Size (Value, Volume* & Price*)

Note*: In applicable scenarios
Step 3 - Data Sources
Primary Research
- Web Analytics
- Survey Reports
- Research Institute
- Latest Research Reports
- Opinion Leaders
Secondary Research
- Annual Reports
- White Paper
- Latest Press Release
- Industry Association
- Paid Database
- Investor Presentations

Step 4 - Data Triangulation
Involves using different sources of information in order to increase the validity of a study
These sources are likely to be stakeholders in a program - participants, other researchers, program staff, other community members, and so on.
Then we put all data in single framework & apply various statistical tools to find out the dynamic on the market.
During the analysis stage, feedback from the stakeholder groups would be compared to determine areas of agreement as well as areas of divergence