

Key Insights
The North American Testing, Inspection, and Certification (TIC) market is projected for robust expansion, fueled by escalating regulatory demands, a paramount focus on product safety and quality, and the increasing imperative for environmental adherence. The market, valued at $1125.21 million in the base year of 2025, is anticipated to grow at a Compound Annual Growth Rate (CAGR) of 4.88% from 2025 to 2033. Key growth catalysts include stringent environmental regulations in sectors such as oil & gas and manufacturing, prompting significant investment in TIC services. Heightened consumer awareness regarding product safety and sustainability further boosts demand for independent verification. The market is segmented by end-user, with prominent contributions from consumer goods & retail, environmental testing (effluent, water, soil, air), food & agriculture, and manufacturing. Geographically, the United States leads the North American market, followed by Canada, driven by their substantial economies and established regulatory frameworks. The trend towards outsourcing TIC services is accelerating, driven by cost efficiencies and access to specialized expertise.
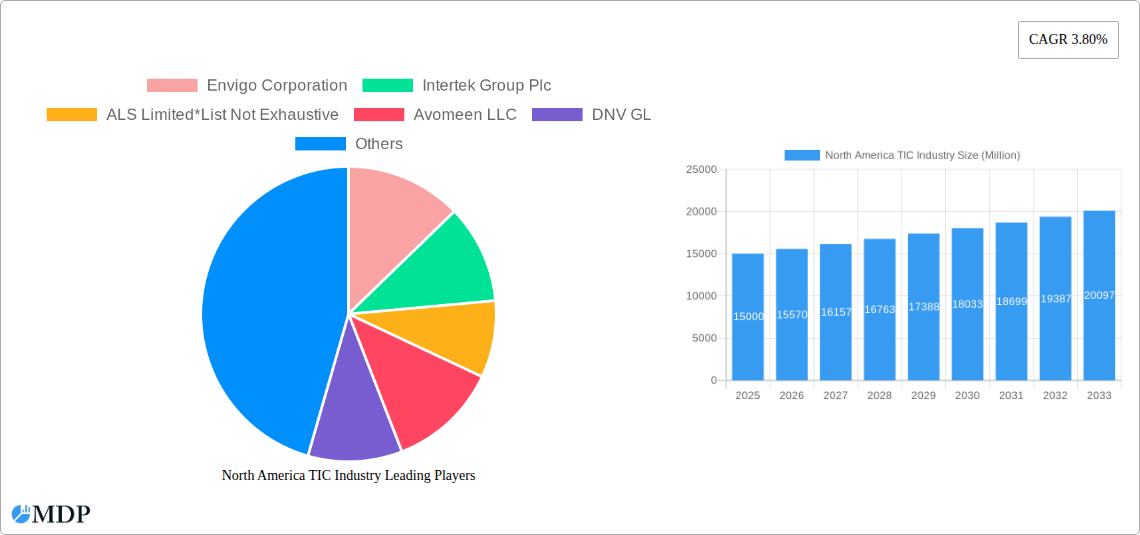
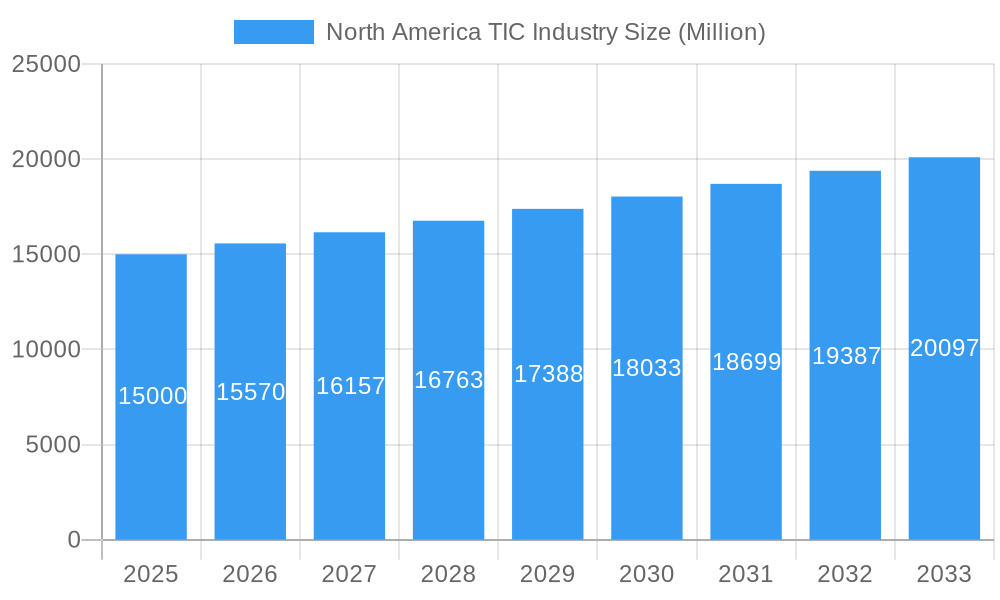
North America TIC Industry Market Size (In Billion)
The outlook for the North American TIC market remains highly positive, with sustained growth anticipated through 2033. Technological advancements, including advanced analytical techniques and process digitalization, are poised to enhance efficiency and accuracy. Potential challenges include economic volatility impacting investment and intense competition with diverse pricing models. Continued emphasis on sustainability and regulatory compliance will be pivotal. Growth within specific segments, particularly environmental testing, is expected to surpass the market average, aligning with the global drive for environmental protection and responsible resource management.
North America TIC Industry Company Market Share
North America TIC Industry Market Report: 2019-2033
This comprehensive report provides an in-depth analysis of the North America Testing, Inspection, and Certification (TIC) industry, covering market dynamics, leading players, key trends, and future growth prospects from 2019 to 2033. With a focus on the United States and Canada, this report is essential for industry stakeholders, investors, and strategic decision-makers seeking actionable insights into this dynamic sector. The report incorporates detailed data and analysis across various segments, including by end-user vertical and service type, providing a granular view of market performance and future potential. The study period covers 2019-2033, with 2025 as the base and estimated year.
North America TIC Industry Market Dynamics & Concentration
The North American TIC market, valued at $xx Million in 2024, is characterized by moderate concentration with several large global players and numerous smaller specialized firms. Market share is fragmented, with the top five companies holding approximately xx% of the market in 2024. Key innovation drivers include advancements in digital technologies (AI, IoT, automation), stricter regulatory compliance needs across diverse sectors (e.g., environmental regulations, product safety standards), and growing demand for efficient and reliable testing solutions. The regulatory landscape is complex and varies across jurisdictions, impacting both market entry and operational costs. Substitute products are limited, but some niche services face competition from alternative methods. End-user trends indicate a shift towards outsourced TIC services, driven by factors like cost optimization and access to specialized expertise. M&A activities are frequent, reflecting consolidation within the industry. Between 2019 and 2024, approximately xx M&A deals were recorded, primarily driven by large players acquiring smaller firms to expand their service offerings and geographic reach.
- Market Concentration: Moderately fragmented, top 5 players hold approximately xx% market share (2024).
- Innovation Drivers: Digital technologies, stricter regulations, demand for efficient solutions.
- M&A Activity: Approximately xx deals between 2019 and 2024.
North America TIC Industry Industry Trends & Analysis
The North American TIC industry is experiencing robust growth, driven by several key factors. Stringent regulations across sectors like food safety, environmental protection, and product safety necessitate increased testing and certification. The rising adoption of advanced technologies like AI and automation is enhancing efficiency and accuracy in testing processes. Consumer preferences are shifting towards products with demonstrably high quality and safety standards, boosting demand for TIC services. Furthermore, the increasing focus on supply chain resilience and risk management is propelling growth. The market’s competitive dynamics are characterized by intense competition among established players, alongside the emergence of niche players offering specialized services. The market is expected to grow at a CAGR of xx% from 2025 to 2033, reaching an estimated value of $xx Million by 2033. Market penetration is highest in established sectors like manufacturing and oil & gas, but considerable growth potential exists in emerging areas like renewable energy and sustainable technologies.
Leading Markets & Segments in North America TIC Industry
The United States dominates the North American TIC market, accounting for approximately xx% of the total revenue in 2024, primarily driven by its large and diverse economy, robust regulatory framework, and high concentration of major industry players. Canada holds a significant share, primarily due to its strong manufacturing and resource sectors. Among end-user verticals, the Manufacturing and Industrial Goods segment led the market in 2024, followed by the Oil and Gas and Environmental sectors. The Outsourced segment is experiencing faster growth than In-house, driven by factors such as cost efficiency and access to specialized expertise.
- Key Drivers for the United States: Strong economy, robust regulatory framework, large industrial base.
- Key Drivers for Canada: Resource-rich economy, strong manufacturing sector.
- Dominant End-User Vertical: Manufacturing and Industrial Goods (2024).
- Fastest-Growing Segment: Outsourced TIC services.
North America TIC Industry Product Developments
Recent product innovations in the TIC industry focus on enhanced automation, AI-powered analysis, and digitalization of testing processes. These advancements improve efficiency, reduce testing times, and enhance the accuracy and reliability of results. The industry is also witnessing increased development of specialized testing services catering to specific industry needs, particularly in emerging areas like renewable energy and sustainable technologies. These innovations are designed to ensure alignment with evolving regulatory requirements and enhance the overall value proposition for clients.
Key Drivers of North America TIC Industry Growth
Several factors fuel the growth of the North American TIC industry. Firstly, stringent government regulations necessitate rigorous testing and certification across various sectors, ensuring product safety and environmental compliance. Secondly, advancements in technology like AI and automation are improving the efficiency and accuracy of testing processes, making them more cost-effective. Thirdly, the rising consumer demand for high-quality and safe products further increases the reliance on TIC services. The growth of emerging industries like renewable energy and sustainable technologies creates new opportunities for specialized testing and certification services.
Challenges in the North America TIC Industry Market
The North American TIC market faces several challenges. Evolving and often complex regulatory landscapes pose hurdles for companies, increasing compliance costs. Supply chain disruptions can affect the availability of testing equipment and materials. Intense competition, especially from large multinational corporations, puts pressure on smaller players’ profit margins. These factors can lead to reduced market share and potential financial constraints for some companies. The estimated impact of these challenges on market growth is approximately xx% reduction in the projected CAGR.
Emerging Opportunities in North America TIC Industry
The North American TIC industry offers significant long-term growth opportunities. Advancements in technologies like AI and blockchain provide opportunities for innovation and enhanced service offerings. Strategic partnerships between TIC providers and technology companies can foster accelerated adoption of cutting-edge solutions. Expanding into emerging markets and specialized niches, such as renewable energy and sustainable technologies, offers substantial potential for market expansion and revenue diversification.
Leading Players in the North America TIC Industry Sector
- Envigo Corporation
- Intertek Group Plc
- ALS Limited
- Avomeen LLC
- DNV GL
- Applus Services SA
- AB Sciex LLC
- SGS SA
- Mistras Group
- DEKRA SE
- Bureau Veritas
- UL LLC
- TUV SUD
Key Milestones in North America TIC Industry Industry
- September 2022: SGS SA acquired Penumbra Security Inc., strengthening its cybersecurity testing capabilities.
- March 2022: DEKRA selected to develop a Vehicle-Grid Innovation Laboratory (ViGIL), expanding its EV testing services.
Strategic Outlook for North America TIC Industry Market
The North American TIC market presents substantial future potential, driven by technological advancements, increasing regulatory scrutiny, and the growing demand for safe and high-quality products across various industries. Companies pursuing strategic partnerships, investing in R&D, and expanding their service offerings into emerging sectors are poised for strong growth. Focus on digital transformation and sustainability will be key to navigating the evolving market landscape and capturing significant market share in the years to come.
North America TIC Industry Segmentation
-
1. Type
- 1.1. Outsourced
- 1.2. In-house
-
2. End-User Vertical
- 2.1. Consumer Goods and Retail
- 2.2. Environmental (Effluent, Water, Soil, Air)
- 2.3. Food and Agriculture
- 2.4. Manufacturing and Industrial Goods
- 2.5. Oil and Gas
- 2.6. Construction and Engineering
- 2.7. Other End-user Verticals
North America TIC Industry Segmentation By Geography
-
1. North America
- 1.1. United States
- 1.2. Canada
- 1.3. Mexico
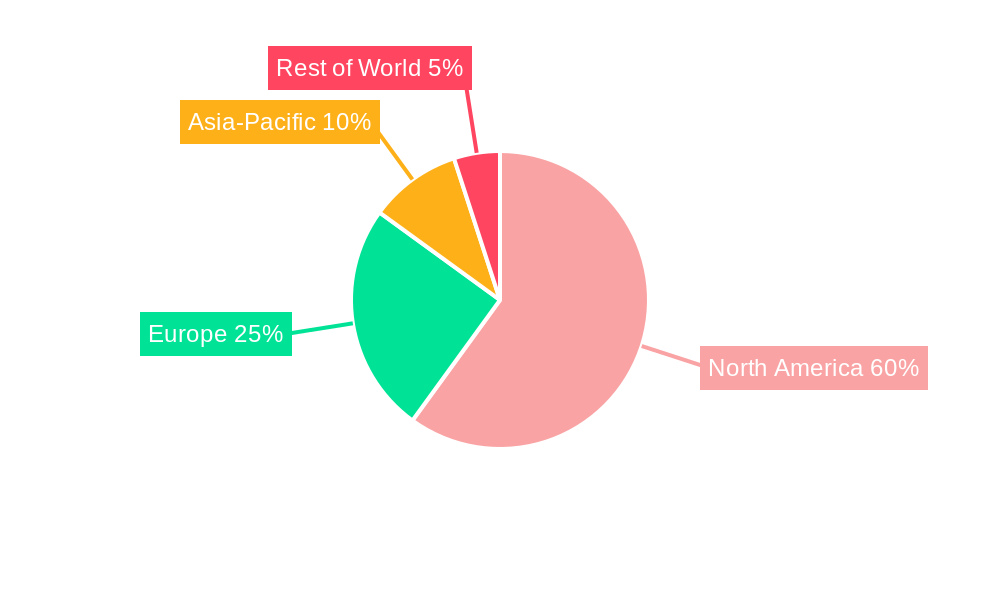
North America TIC Industry Regional Market Share
Geographic Coverage of North America TIC Industry
North America TIC Industry REPORT HIGHLIGHTS
| Aspects | Details |
|---|---|
| Study Period | 2020-2034 |
| Base Year | 2025 |
| Estimated Year | 2026 |
| Forecast Period | 2026-2034 |
| Historical Period | 2020-2025 |
| Growth Rate | CAGR of 4.88% from 2020-2034 |
| Segmentation |
|
Table of Contents
- 1. Introduction
- 1.1. Research Scope
- 1.2. Market Segmentation
- 1.3. Research Objective
- 1.4. Definitions and Assumptions
- 2. Executive Summary
- 2.1. Market Snapshot
- 3. Market Dynamics
- 3.1. Market Drivers
- 3.2. Market Restrains
- 3.3. Market Trends
- 3.4. Market Opportunities
- 4. Market Factor Analysis
- 4.1. Porters Five Forces
- 4.1.1. Bargaining Power of Suppliers
- 4.1.2. Bargaining Power of Buyers
- 4.1.3. Threat of New Entrants
- 4.1.4. Threat of Substitutes
- 4.1.5. Competitive Rivalry
- 4.2. PESTEL analysis
- 4.3. BCG Analysis
- 4.3.1. Stars (High Growth, High Market Share)
- 4.3.2. Cash Cows (Low Growth, High Market Share)
- 4.3.3. Question Mark (High Growth, Low Market Share)
- 4.3.4. Dogs (Low Growth, Low Market Share)
- 4.4. Ansoff Matrix Analysis
- 4.5. Supply Chain Analysis
- 4.6. Regulatory Landscape
- 4.7. Current Market Potential and Opportunity Assessment (TAM–SAM–SOM Framework)
- 4.8. MDP Analyst Note
- 4.1. Porters Five Forces
- 5. Market Analysis, Insights and Forecast 2021-2033
- 5.1. Market Analysis, Insights and Forecast - by Type
- 5.1.1. Outsourced
- 5.1.2. In-house
- 5.2. Market Analysis, Insights and Forecast - by End-User Vertical
- 5.2.1. Consumer Goods and Retail
- 5.2.2. Environmental (Effluent, Water, Soil, Air)
- 5.2.3. Food and Agriculture
- 5.2.4. Manufacturing and Industrial Goods
- 5.2.5. Oil and Gas
- 5.2.6. Construction and Engineering
- 5.2.7. Other End-user Verticals
- 5.3. Market Analysis, Insights and Forecast - by Region
- 5.3.1. North America
- 5.1. Market Analysis, Insights and Forecast - by Type
- 6. North America TIC Industry Analysis, Insights and Forecast, 2021-2033
- 6.1. Market Analysis, Insights and Forecast - by Type
- 6.1.1. Outsourced
- 6.1.2. In-house
- 6.2. Market Analysis, Insights and Forecast - by End-User Vertical
- 6.2.1. Consumer Goods and Retail
- 6.2.2. Environmental (Effluent, Water, Soil, Air)
- 6.2.3. Food and Agriculture
- 6.2.4. Manufacturing and Industrial Goods
- 6.2.5. Oil and Gas
- 6.2.6. Construction and Engineering
- 6.2.7. Other End-user Verticals
- 6.1. Market Analysis, Insights and Forecast - by Type
- 7. Competitive Analysis
- 7.1. Company Profiles
- 7.1.1 Envigo Corporation
- 7.1.1.1. Company Overview
- 7.1.1.2. Products
- 7.1.1.3. Company Financials
- 7.1.1.4. SWOT Analysis
- 7.1.2 Intertek Group Plc
- 7.1.2.1. Company Overview
- 7.1.2.2. Products
- 7.1.2.3. Company Financials
- 7.1.2.4. SWOT Analysis
- 7.1.3 ALS Limited*List Not Exhaustive
- 7.1.3.1. Company Overview
- 7.1.3.2. Products
- 7.1.3.3. Company Financials
- 7.1.3.4. SWOT Analysis
- 7.1.4 Avomeen LLC
- 7.1.4.1. Company Overview
- 7.1.4.2. Products
- 7.1.4.3. Company Financials
- 7.1.4.4. SWOT Analysis
- 7.1.5 DNV GL
- 7.1.5.1. Company Overview
- 7.1.5.2. Products
- 7.1.5.3. Company Financials
- 7.1.5.4. SWOT Analysis
- 7.1.6 Applus Services SA
- 7.1.6.1. Company Overview
- 7.1.6.2. Products
- 7.1.6.3. Company Financials
- 7.1.6.4. SWOT Analysis
- 7.1.7 AB Sciex LLC
- 7.1.7.1. Company Overview
- 7.1.7.2. Products
- 7.1.7.3. Company Financials
- 7.1.7.4. SWOT Analysis
- 7.1.8 SGS SA
- 7.1.8.1. Company Overview
- 7.1.8.2. Products
- 7.1.8.3. Company Financials
- 7.1.8.4. SWOT Analysis
- 7.1.9 Mistras Group
- 7.1.9.1. Company Overview
- 7.1.9.2. Products
- 7.1.9.3. Company Financials
- 7.1.9.4. SWOT Analysis
- 7.1.10 DEKRA SE
- 7.1.10.1. Company Overview
- 7.1.10.2. Products
- 7.1.10.3. Company Financials
- 7.1.10.4. SWOT Analysis
- 7.1.11 Bureau Veritas
- 7.1.11.1. Company Overview
- 7.1.11.2. Products
- 7.1.11.3. Company Financials
- 7.1.11.4. SWOT Analysis
- 7.1.12 UL LLC
- 7.1.12.1. Company Overview
- 7.1.12.2. Products
- 7.1.12.3. Company Financials
- 7.1.12.4. SWOT Analysis
- 7.1.13 TUV SUD
- 7.1.13.1. Company Overview
- 7.1.13.2. Products
- 7.1.13.3. Company Financials
- 7.1.13.4. SWOT Analysis
- 7.1.1 Envigo Corporation
- 7.2. Market Entropy
- 7.2.1 Company's Key Areas Served
- 7.2.2 Recent Developments
- 7.3. Company Market Share Analysis 2025
- 7.3.1 Top 5 Companies Market Share Analysis
- 7.3.2 Top 3 Companies Market Share Analysis
- 7.4. List of Potential Customers
- 8. Research Methodology
List of Figures
- Figure 1: North America TIC Industry Revenue Breakdown (million, %) by Product 2025 & 2033
- Figure 2: North America TIC Industry Share (%) by Company 2025
List of Tables
- Table 1: North America TIC Industry Revenue million Forecast, by Type 2020 & 2033
- Table 2: North America TIC Industry Revenue million Forecast, by End-User Vertical 2020 & 2033
- Table 3: North America TIC Industry Revenue million Forecast, by Region 2020 & 2033
- Table 4: North America TIC Industry Revenue million Forecast, by Type 2020 & 2033
- Table 5: North America TIC Industry Revenue million Forecast, by End-User Vertical 2020 & 2033
- Table 6: North America TIC Industry Revenue million Forecast, by Country 2020 & 2033
- Table 7: United States North America TIC Industry Revenue (million) Forecast, by Application 2020 & 2033
- Table 8: Canada North America TIC Industry Revenue (million) Forecast, by Application 2020 & 2033
- Table 9: Mexico North America TIC Industry Revenue (million) Forecast, by Application 2020 & 2033
Frequently Asked Questions
1. What is the projected Compound Annual Growth Rate (CAGR) of the North America TIC Industry?
The projected CAGR is approximately 4.88%.
2. Which companies are prominent players in the North America TIC Industry?
Key companies in the market include Envigo Corporation, Intertek Group Plc, ALS Limited*List Not Exhaustive, Avomeen LLC, DNV GL, Applus Services SA, AB Sciex LLC, SGS SA, Mistras Group, DEKRA SE, Bureau Veritas, UL LLC, TUV SUD.
3. What are the main segments of the North America TIC Industry?
The market segments include Type, End-User Vertical.
4. Can you provide details about the market size?
The market size is estimated to be USD 1125.21 million as of 2022.
5. What are some drivers contributing to market growth?
Highly Developed Regulatory Framework; Growing Demand For Outsourced Servic.
6. What are the notable trends driving market growth?
Automotive Industry Holds Significant Market Share.
7. Are there any restraints impacting market growth?
Entry Barriers for New Players and Standardization Concerns Especially in the Case of Inter-border Transactions.
8. Can you provide examples of recent developments in the market?
September 2022: SGS SA acquired Penumbra Security Inc., a recognized leader in different types of information security conformance testing to government standards and regulatory compliance for multinational companies. In addition, the company is accredited by the National Voluntary Laboratory Programs for Federal Information Processing Standard test methods (FIPS 140-2/3). This helps in the further development of TIC services for the company.
9. What pricing options are available for accessing the report?
Pricing options include single-user, multi-user, and enterprise licenses priced at USD 4750, USD 4950, and USD 6800 respectively.
10. Is the market size provided in terms of value or volume?
The market size is provided in terms of value, measured in million.
11. Are there any specific market keywords associated with the report?
Yes, the market keyword associated with the report is "North America TIC Industry," which aids in identifying and referencing the specific market segment covered.
12. How do I determine which pricing option suits my needs best?
The pricing options vary based on user requirements and access needs. Individual users may opt for single-user licenses, while businesses requiring broader access may choose multi-user or enterprise licenses for cost-effective access to the report.
13. Are there any additional resources or data provided in the North America TIC Industry report?
While the report offers comprehensive insights, it's advisable to review the specific contents or supplementary materials provided to ascertain if additional resources or data are available.
14. How can I stay updated on further developments or reports in the North America TIC Industry?
To stay informed about further developments, trends, and reports in the North America TIC Industry, consider subscribing to industry newsletters, following relevant companies and organizations, or regularly checking reputable industry news sources and publications.
Methodology
Step 1 - Identification of Relevant Samples Size from Population Database


Step 2 - Approaches for Defining Global Market Size (Value, Volume* & Price*)

Note*: In applicable scenarios
Step 3 - Data Sources
Primary Research
- Web Analytics
- Survey Reports
- Research Institute
- Latest Research Reports
- Opinion Leaders
Secondary Research
- Annual Reports
- White Paper
- Latest Press Release
- Industry Association
- Paid Database
- Investor Presentations

Step 4 - Data Triangulation
Involves using different sources of information in order to increase the validity of a study
These sources are likely to be stakeholders in a program - participants, other researchers, program staff, other community members, and so on.
Then we put all data in single framework & apply various statistical tools to find out the dynamic on the market.
During the analysis stage, feedback from the stakeholder groups would be compared to determine areas of agreement as well as areas of divergence