

Key Insights
The North American gas turbine power generation market is poised for significant expansion, fueled by escalating energy needs and the imperative for highly efficient and dependable power solutions. The market, projected at $22.6 billion by 2025, is anticipated to grow at a Compound Annual Growth Rate (CAGR) of 11.2% through 2033. Key growth drivers include the ongoing energy transition, which requires flexible generation to complement intermittent renewables, and the modernization of aging power infrastructure. Industrialization and economic development are also amplifying electricity demand across diverse sectors. Combined cycle gas turbines are favored for their superior efficiency, and mid-sized units (31-120 MW) dominate demand. Leading companies such as Solar Turbines Inc., Siemens AG, and General Electric Company are at the forefront, leveraging technological prowess and established networks.
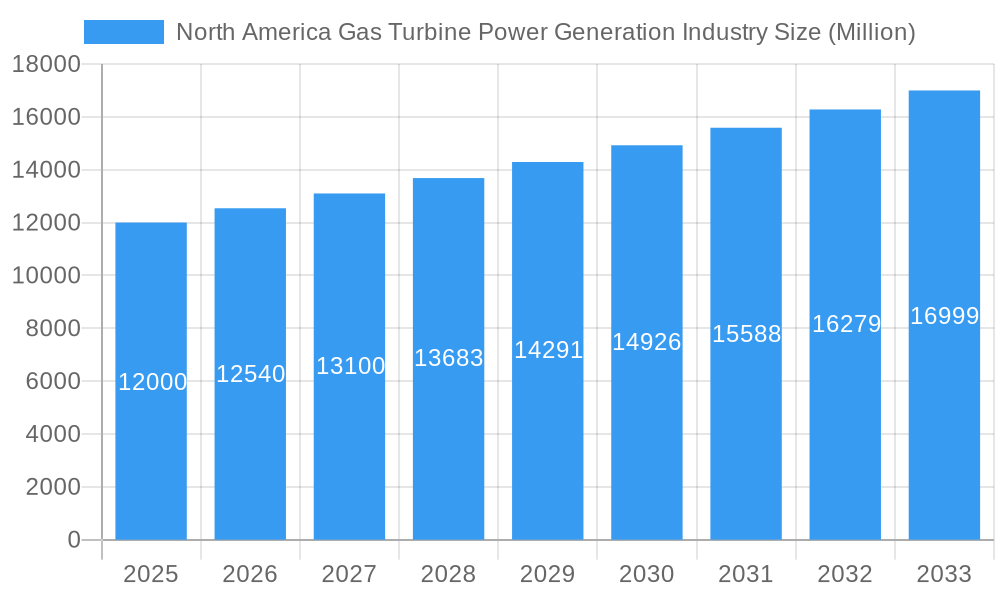
North America Gas Turbine Power Generation Industry Market Size (In Billion)
Potential restraints include evolving emissions regulations and fluctuating natural gas prices. Nevertheless, technological advancements in efficiency and environmental performance underpin a positive long-term outlook. Opportunities exist within specific end-user segments and regional markets. Stakeholders are expected to prioritize innovation in digitalization and predictive maintenance to enhance competitiveness, optimize efficiency, and manage operational costs. The North American gas turbine market presents considerable investment potential for entities capable of meeting the region's evolving energy demands.
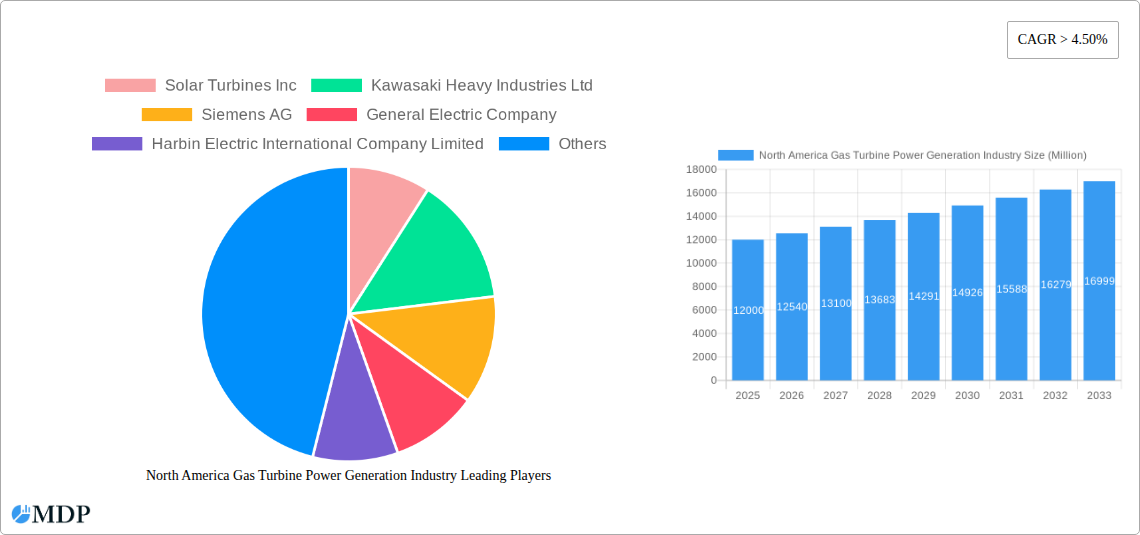
North America Gas Turbine Power Generation Industry Company Market Share
North America Gas Turbine Power Generation Industry: A Comprehensive Market Report (2019-2033)
Unlock the potential of the North American gas turbine power generation market with this in-depth analysis. This comprehensive report provides a detailed overview of the industry's dynamics, trends, and future prospects from 2019 to 2033, focusing on key players, segments, and growth drivers. Benefit from actionable insights to inform your strategic decisions and gain a competitive edge. The report covers crucial aspects including market size (in Millions), CAGR, market share analysis, and forecasts, based on the base year 2025 and an estimated year of 2025.
North America Gas Turbine Power Generation Industry Market Dynamics & Concentration
The North American gas turbine power generation market exhibits a moderately concentrated landscape, with key players such as General Electric Company, Siemens AG, and Rolls-Royce Holding PLC holding significant market share. The market share of these top three players is estimated at xx% in 2025. Innovation drives intense competition, focusing on efficiency improvements, reduced emissions, and digitalization. Stringent environmental regulations, particularly concerning greenhouse gas emissions, are shaping the industry's trajectory. Product substitutes, such as renewable energy sources (solar, wind), are increasingly competitive, necessitating continuous technological advancements in gas turbine technology to maintain market relevance. M&A activities have been relatively moderate in recent years, with an estimated xx M&A deals concluded between 2019 and 2024. End-user trends indicate a growing demand for flexible and efficient power generation solutions, particularly in the power sector.
- Market Concentration: High (xx% market share held by top 3 players in 2025).
- Innovation Drivers: Efficiency gains, emission reduction, digitalization.
- Regulatory Framework: Stringent environmental regulations driving technological advancements.
- Product Substitutes: Renewable energy sources (solar, wind).
- End-User Trends: Demand for flexible and efficient power generation.
- M&A Activity: Moderate (xx deals between 2019-2024).
North America Gas Turbine Power Generation Industry Industry Trends & Analysis
The North American gas turbine power generation market is poised for steady growth, driven by increasing electricity demand, particularly in rapidly developing regions. Technological disruptions, such as the integration of advanced materials and digital technologies, are enhancing the efficiency and reliability of gas turbines. Consumer preferences are shifting towards cleaner energy sources, prompting manufacturers to focus on emission reduction technologies. Intense competition among leading players necessitates continuous innovation and cost optimization strategies. The market is estimated to exhibit a CAGR of xx% during the forecast period (2025-2033), with market penetration of xx% by 2033 in the power sector. This growth trajectory is significantly influenced by government incentives for cleaner energy and modernization of existing power infrastructure.
Leading Markets & Segments in North America Gas Turbine Power Generation Industry
The power sector dominates the end-user landscape, accounting for approximately xx% of the total market demand in 2025. The 31 to 120 MW capacity segment holds the largest market share (xx%) driven by the need for mid-range power generation solutions. Combined cycle gas turbines account for the significant majority (xx%) of the market share.
Key Drivers by Segment:
- Power Sector: Growing electricity demand, infrastructure upgrades, and government incentives for efficient power generation.
- Oil & Gas Sector: Demand for power generation in remote locations and process applications.
- Other End-User Industries: Industrial processes requiring reliable and efficient power.
- Capacity (31-120 MW): Optimum balance between capital cost and power output.
- Combined Cycle: High efficiency and lower emissions compared to open-cycle.
North America Gas Turbine Power Generation Industry Product Developments
Recent product innovations focus on improved efficiency, reduced emissions, and enhanced digital capabilities. Manufacturers are integrating advanced materials and digital controls to optimize performance and reduce operational costs. These developments enhance the market fit by addressing growing environmental concerns and the need for flexible power generation. The market is witnessing the integration of AI and predictive maintenance capabilities into gas turbines, enhancing operational efficiency and reliability.
Key Drivers of North America Gas Turbine Power Generation Industry Growth
Several factors drive the growth of the North American gas turbine power generation market. Firstly, the increasing demand for electricity fuels market expansion. Secondly, government regulations promoting cleaner energy sources encourage investment in advanced gas turbine technologies with reduced emissions. Thirdly, technological advancements continually enhance efficiency and reliability, fostering wider adoption.
Challenges in the North America Gas Turbine Power Generation Industry Market
The market faces challenges like stringent environmental regulations increasing production costs, supply chain disruptions impacting material availability and pricing, and intense competition from renewable energy sources affecting market share. These factors may collectively impede market growth by xx% by 2033.
Emerging Opportunities in North America Gas Turbine Power Generation Industry
Emerging opportunities include the integration of gas turbines into hybrid power systems, combining them with renewable energy sources for enhanced efficiency and grid stability. Strategic partnerships and collaborations amongst industry players are driving technological advancements. Market expansion into underserved regions is also poised for significant growth.
Leading Players in the North America Gas Turbine Power Generation Industry Sector
- Solar Turbines Inc
- Kawasaki Heavy Industries Ltd
- Siemens AG
- General Electric Company
- Harbin Electric International Company Limited
- Capstone Turbine Corporation
- Mitsubishi Heavy Industries Ltd
- Rolls-Royce Holding PLC
Key Milestones in North America Gas Turbine Power Generation Industry Industry
- 2020: Introduction of a new high-efficiency gas turbine model by Siemens AG.
- 2021: Merger between two smaller gas turbine manufacturers.
- 2022: Launch of a digital platform for predictive maintenance by General Electric Company.
- 2023: Government incentives announced for adopting advanced gas turbine technologies.
- 2024: Significant investments in R&D for emission reduction technologies.
Strategic Outlook for North America Gas Turbine Power Generation Industry Market
The North American gas turbine power generation market holds significant future potential, fueled by the continued need for reliable and efficient power generation. Strategic opportunities lie in focusing on cleaner technologies, improving operational efficiency through digitalization, and exploring partnerships to expand into new markets and applications. The market is expected to continue to grow at a moderate rate, driven by technological advancements and government policies supporting a cleaner energy mix.
North America Gas Turbine Power Generation Industry Segmentation
-
1. Capacity
- 1.1. Less than 30 MW
- 1.2. 31 to 120 MW
- 1.3. Above 120
-
2. Type
- 2.1. Combined Cycle
- 2.2. Open Cycle
-
3. End-User Industries
- 3.1. Power
- 3.2. Oil and Gas
- 3.3. Other End-User Industries
-
4. Geography
- 4.1. United States
- 4.2. Canada
- 4.3. Restof North America
North America Gas Turbine Power Generation Industry Segmentation By Geography
- 1. United States
- 2. Canada
- 3. Restof North America
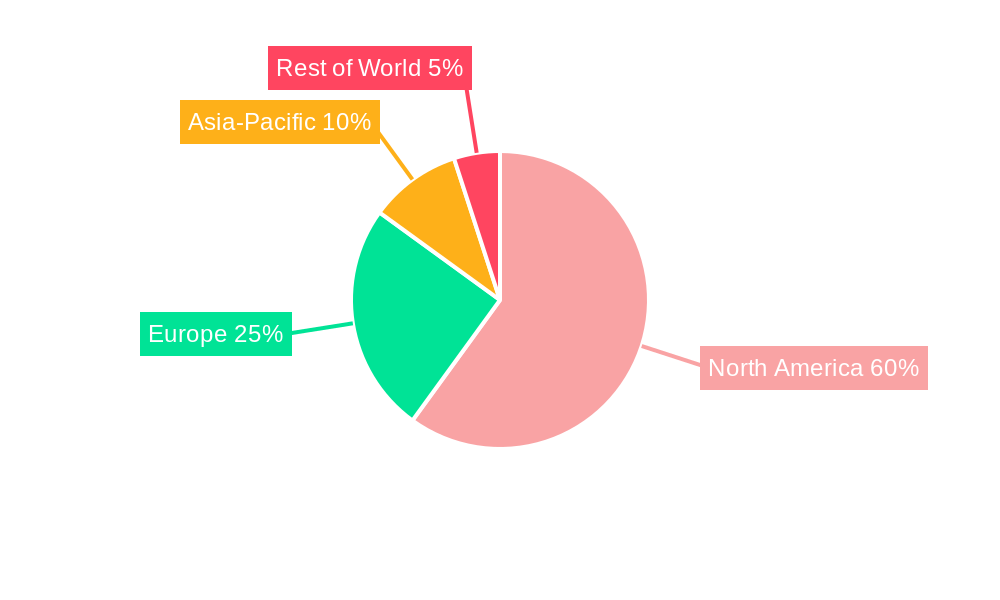
North America Gas Turbine Power Generation Industry Regional Market Share
Geographic Coverage of North America Gas Turbine Power Generation Industry
North America Gas Turbine Power Generation Industry REPORT HIGHLIGHTS
| Aspects | Details |
|---|---|
| Study Period | 2020-2034 |
| Base Year | 2025 |
| Estimated Year | 2026 |
| Forecast Period | 2026-2034 |
| Historical Period | 2020-2025 |
| Growth Rate | CAGR of 11.2% from 2020-2034 |
| Segmentation |
|
Table of Contents
- 1. Introduction
- 1.1. Research Scope
- 1.2. Market Segmentation
- 1.3. Research Methodology
- 1.4. Definitions and Assumptions
- 2. Executive Summary
- 2.1. Introduction
- 3. Market Dynamics
- 3.1. Introduction
- 3.2. Market Drivers
- 3.2.1. 4.; Supportive Government Policies and Incentives4.; Environmental Concerns
- 3.3. Market Restrains
- 3.3.1. 4.; Fossil Fuel Subsidies
- 3.4. Market Trends
- 3.4.1. Power Generation Application is Expected to Dominate the Market
- 4. Market Factor Analysis
- 4.1. Porters Five Forces
- 4.2. Supply/Value Chain
- 4.3. PESTEL analysis
- 4.4. Market Entropy
- 4.5. Patent/Trademark Analysis
- 5. North America Gas Turbine Power Generation Industry Analysis, Insights and Forecast, 2020-2032
- 5.1. Market Analysis, Insights and Forecast - by Capacity
- 5.1.1. Less than 30 MW
- 5.1.2. 31 to 120 MW
- 5.1.3. Above 120
- 5.2. Market Analysis, Insights and Forecast - by Type
- 5.2.1. Combined Cycle
- 5.2.2. Open Cycle
- 5.3. Market Analysis, Insights and Forecast - by End-User Industries
- 5.3.1. Power
- 5.3.2. Oil and Gas
- 5.3.3. Other End-User Industries
- 5.4. Market Analysis, Insights and Forecast - by Geography
- 5.4.1. United States
- 5.4.2. Canada
- 5.4.3. Restof North America
- 5.5. Market Analysis, Insights and Forecast - by Region
- 5.5.1. United States
- 5.5.2. Canada
- 5.5.3. Restof North America
- 5.1. Market Analysis, Insights and Forecast - by Capacity
- 6. United States North America Gas Turbine Power Generation Industry Analysis, Insights and Forecast, 2020-2032
- 6.1. Market Analysis, Insights and Forecast - by Capacity
- 6.1.1. Less than 30 MW
- 6.1.2. 31 to 120 MW
- 6.1.3. Above 120
- 6.2. Market Analysis, Insights and Forecast - by Type
- 6.2.1. Combined Cycle
- 6.2.2. Open Cycle
- 6.3. Market Analysis, Insights and Forecast - by End-User Industries
- 6.3.1. Power
- 6.3.2. Oil and Gas
- 6.3.3. Other End-User Industries
- 6.4. Market Analysis, Insights and Forecast - by Geography
- 6.4.1. United States
- 6.4.2. Canada
- 6.4.3. Restof North America
- 6.1. Market Analysis, Insights and Forecast - by Capacity
- 7. Canada North America Gas Turbine Power Generation Industry Analysis, Insights and Forecast, 2020-2032
- 7.1. Market Analysis, Insights and Forecast - by Capacity
- 7.1.1. Less than 30 MW
- 7.1.2. 31 to 120 MW
- 7.1.3. Above 120
- 7.2. Market Analysis, Insights and Forecast - by Type
- 7.2.1. Combined Cycle
- 7.2.2. Open Cycle
- 7.3. Market Analysis, Insights and Forecast - by End-User Industries
- 7.3.1. Power
- 7.3.2. Oil and Gas
- 7.3.3. Other End-User Industries
- 7.4. Market Analysis, Insights and Forecast - by Geography
- 7.4.1. United States
- 7.4.2. Canada
- 7.4.3. Restof North America
- 7.1. Market Analysis, Insights and Forecast - by Capacity
- 8. Restof North America North America Gas Turbine Power Generation Industry Analysis, Insights and Forecast, 2020-2032
- 8.1. Market Analysis, Insights and Forecast - by Capacity
- 8.1.1. Less than 30 MW
- 8.1.2. 31 to 120 MW
- 8.1.3. Above 120
- 8.2. Market Analysis, Insights and Forecast - by Type
- 8.2.1. Combined Cycle
- 8.2.2. Open Cycle
- 8.3. Market Analysis, Insights and Forecast - by End-User Industries
- 8.3.1. Power
- 8.3.2. Oil and Gas
- 8.3.3. Other End-User Industries
- 8.4. Market Analysis, Insights and Forecast - by Geography
- 8.4.1. United States
- 8.4.2. Canada
- 8.4.3. Restof North America
- 8.1. Market Analysis, Insights and Forecast - by Capacity
- 9. Competitive Analysis
- 9.1. Market Share Analysis 2025
- 9.2. Company Profiles
- 9.2.1 Solar Turbines Inc
- 9.2.1.1. Overview
- 9.2.1.2. Products
- 9.2.1.3. SWOT Analysis
- 9.2.1.4. Recent Developments
- 9.2.1.5. Financials (Based on Availability)
- 9.2.2 Kawasaki Heavy Industries Ltd
- 9.2.2.1. Overview
- 9.2.2.2. Products
- 9.2.2.3. SWOT Analysis
- 9.2.2.4. Recent Developments
- 9.2.2.5. Financials (Based on Availability)
- 9.2.3 Siemens AG
- 9.2.3.1. Overview
- 9.2.3.2. Products
- 9.2.3.3. SWOT Analysis
- 9.2.3.4. Recent Developments
- 9.2.3.5. Financials (Based on Availability)
- 9.2.4 General Electric Company
- 9.2.4.1. Overview
- 9.2.4.2. Products
- 9.2.4.3. SWOT Analysis
- 9.2.4.4. Recent Developments
- 9.2.4.5. Financials (Based on Availability)
- 9.2.5 Harbin Electric International Company Limited
- 9.2.5.1. Overview
- 9.2.5.2. Products
- 9.2.5.3. SWOT Analysis
- 9.2.5.4. Recent Developments
- 9.2.5.5. Financials (Based on Availability)
- 9.2.6 Capstone Turbine Corporation
- 9.2.6.1. Overview
- 9.2.6.2. Products
- 9.2.6.3. SWOT Analysis
- 9.2.6.4. Recent Developments
- 9.2.6.5. Financials (Based on Availability)
- 9.2.7 Mitsubishi Heavy Industries Ltd
- 9.2.7.1. Overview
- 9.2.7.2. Products
- 9.2.7.3. SWOT Analysis
- 9.2.7.4. Recent Developments
- 9.2.7.5. Financials (Based on Availability)
- 9.2.8 Rolls-Royce Holding PLC
- 9.2.8.1. Overview
- 9.2.8.2. Products
- 9.2.8.3. SWOT Analysis
- 9.2.8.4. Recent Developments
- 9.2.8.5. Financials (Based on Availability)
- 9.2.1 Solar Turbines Inc
List of Figures
- Figure 1: North America Gas Turbine Power Generation Industry Revenue Breakdown (billion, %) by Product 2025 & 2033
- Figure 2: North America Gas Turbine Power Generation Industry Share (%) by Company 2025
List of Tables
- Table 1: North America Gas Turbine Power Generation Industry Revenue billion Forecast, by Capacity 2020 & 2033
- Table 2: North America Gas Turbine Power Generation Industry Revenue billion Forecast, by Type 2020 & 2033
- Table 3: North America Gas Turbine Power Generation Industry Revenue billion Forecast, by End-User Industries 2020 & 2033
- Table 4: North America Gas Turbine Power Generation Industry Revenue billion Forecast, by Geography 2020 & 2033
- Table 5: North America Gas Turbine Power Generation Industry Revenue billion Forecast, by Region 2020 & 2033
- Table 6: North America Gas Turbine Power Generation Industry Revenue billion Forecast, by Capacity 2020 & 2033
- Table 7: North America Gas Turbine Power Generation Industry Revenue billion Forecast, by Type 2020 & 2033
- Table 8: North America Gas Turbine Power Generation Industry Revenue billion Forecast, by End-User Industries 2020 & 2033
- Table 9: North America Gas Turbine Power Generation Industry Revenue billion Forecast, by Geography 2020 & 2033
- Table 10: North America Gas Turbine Power Generation Industry Revenue billion Forecast, by Country 2020 & 2033
- Table 11: North America Gas Turbine Power Generation Industry Revenue billion Forecast, by Capacity 2020 & 2033
- Table 12: North America Gas Turbine Power Generation Industry Revenue billion Forecast, by Type 2020 & 2033
- Table 13: North America Gas Turbine Power Generation Industry Revenue billion Forecast, by End-User Industries 2020 & 2033
- Table 14: North America Gas Turbine Power Generation Industry Revenue billion Forecast, by Geography 2020 & 2033
- Table 15: North America Gas Turbine Power Generation Industry Revenue billion Forecast, by Country 2020 & 2033
- Table 16: North America Gas Turbine Power Generation Industry Revenue billion Forecast, by Capacity 2020 & 2033
- Table 17: North America Gas Turbine Power Generation Industry Revenue billion Forecast, by Type 2020 & 2033
- Table 18: North America Gas Turbine Power Generation Industry Revenue billion Forecast, by End-User Industries 2020 & 2033
- Table 19: North America Gas Turbine Power Generation Industry Revenue billion Forecast, by Geography 2020 & 2033
- Table 20: North America Gas Turbine Power Generation Industry Revenue billion Forecast, by Country 2020 & 2033
Frequently Asked Questions
1. What is the projected Compound Annual Growth Rate (CAGR) of the North America Gas Turbine Power Generation Industry?
The projected CAGR is approximately 11.2%.
2. Which companies are prominent players in the North America Gas Turbine Power Generation Industry?
Key companies in the market include Solar Turbines Inc, Kawasaki Heavy Industries Ltd, Siemens AG, General Electric Company, Harbin Electric International Company Limited, Capstone Turbine Corporation, Mitsubishi Heavy Industries Ltd, Rolls-Royce Holding PLC.
3. What are the main segments of the North America Gas Turbine Power Generation Industry?
The market segments include Capacity, Type, End-User Industries, Geography.
4. Can you provide details about the market size?
The market size is estimated to be USD 22.6 billion as of 2022.
5. What are some drivers contributing to market growth?
4.; Supportive Government Policies and Incentives4.; Environmental Concerns.
6. What are the notable trends driving market growth?
Power Generation Application is Expected to Dominate the Market.
7. Are there any restraints impacting market growth?
4.; Fossil Fuel Subsidies.
8. Can you provide examples of recent developments in the market?
N/A
9. What pricing options are available for accessing the report?
Pricing options include single-user, multi-user, and enterprise licenses priced at USD 4750, USD 5250, and USD 8750 respectively.
10. Is the market size provided in terms of value or volume?
The market size is provided in terms of value, measured in billion.
11. Are there any specific market keywords associated with the report?
Yes, the market keyword associated with the report is "North America Gas Turbine Power Generation Industry," which aids in identifying and referencing the specific market segment covered.
12. How do I determine which pricing option suits my needs best?
The pricing options vary based on user requirements and access needs. Individual users may opt for single-user licenses, while businesses requiring broader access may choose multi-user or enterprise licenses for cost-effective access to the report.
13. Are there any additional resources or data provided in the North America Gas Turbine Power Generation Industry report?
While the report offers comprehensive insights, it's advisable to review the specific contents or supplementary materials provided to ascertain if additional resources or data are available.
14. How can I stay updated on further developments or reports in the North America Gas Turbine Power Generation Industry?
To stay informed about further developments, trends, and reports in the North America Gas Turbine Power Generation Industry, consider subscribing to industry newsletters, following relevant companies and organizations, or regularly checking reputable industry news sources and publications.
Methodology
Step 1 - Identification of Relevant Samples Size from Population Database


Step 2 - Approaches for Defining Global Market Size (Value, Volume* & Price*)

Note*: In applicable scenarios
Step 3 - Data Sources
Primary Research
- Web Analytics
- Survey Reports
- Research Institute
- Latest Research Reports
- Opinion Leaders
Secondary Research
- Annual Reports
- White Paper
- Latest Press Release
- Industry Association
- Paid Database
- Investor Presentations

Step 4 - Data Triangulation
Involves using different sources of information in order to increase the validity of a study
These sources are likely to be stakeholders in a program - participants, other researchers, program staff, other community members, and so on.
Then we put all data in single framework & apply various statistical tools to find out the dynamic on the market.
During the analysis stage, feedback from the stakeholder groups would be compared to determine areas of agreement as well as areas of divergence