

Key Insights
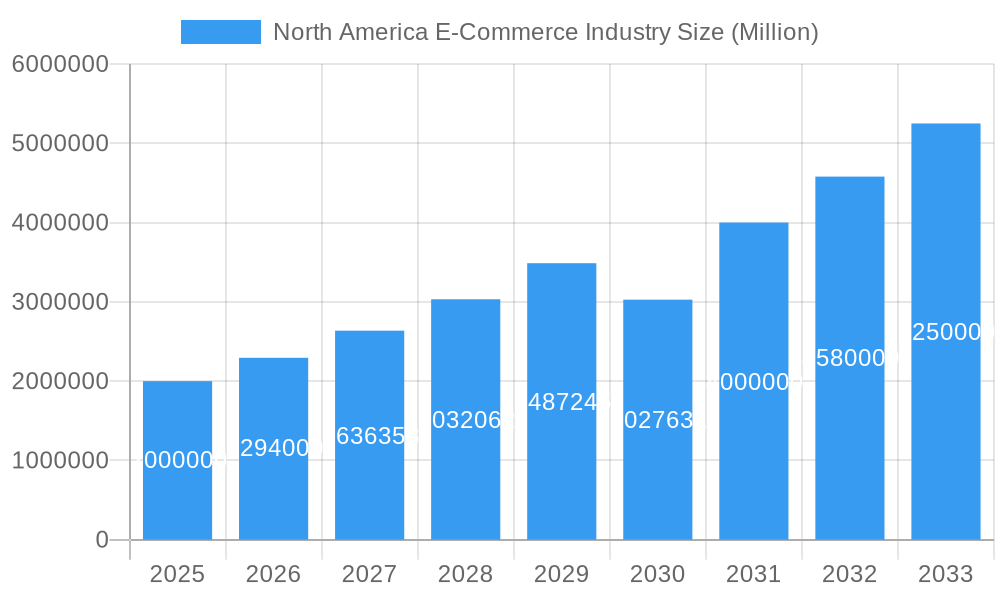
The North American e-commerce market, a dynamic sector encompassing beauty & personal care, consumer electronics, fashion & apparel, food & beverage, and furniture & home, is poised for significant expansion. Fueled by escalating internet and smartphone penetration, alongside a pronounced consumer preference for online shopping convenience, the market is projected to reach $3333.8 million by 2024, exhibiting a Compound Annual Growth Rate (CAGR) of 18.1%. Major e-commerce leaders are strategically investing in advanced logistics, superior customer experiences, and diversified product portfolios to leverage this burgeoning market. The United States continues to lead in revenue generation, followed by Canada and Mexico. Mexico, in particular, presents substantial growth opportunities driven by increasing middle-class incomes and broader internet accessibility. Intense competition among established players and agile emerging brands like SHEIN is fostering innovation and price competitiveness, benefiting consumers directly through enhanced mobile commerce adoption and integrated omnichannel strategies.
North America E-Commerce Industry Market Size (In Billion)
Within the North American e-commerce ecosystem, consumer electronics and fashion & apparel segments are anticipated to lead growth, propelled by rapid technological advancements and evolving fashion trends. The food & beverage sector, while experiencing growth, faces logistical challenges and consumer preferences for freshness. The furniture & home segment shows strong potential, supported by home improvement trends and the convenience of online purchasing and delivery. Key considerations for industry participants include robust cybersecurity measures, efficient logistics, and exceptional customer service. Despite these challenges, the North American e-commerce market presents a highly positive outlook, signaling considerable investment prospects and sustained growth.
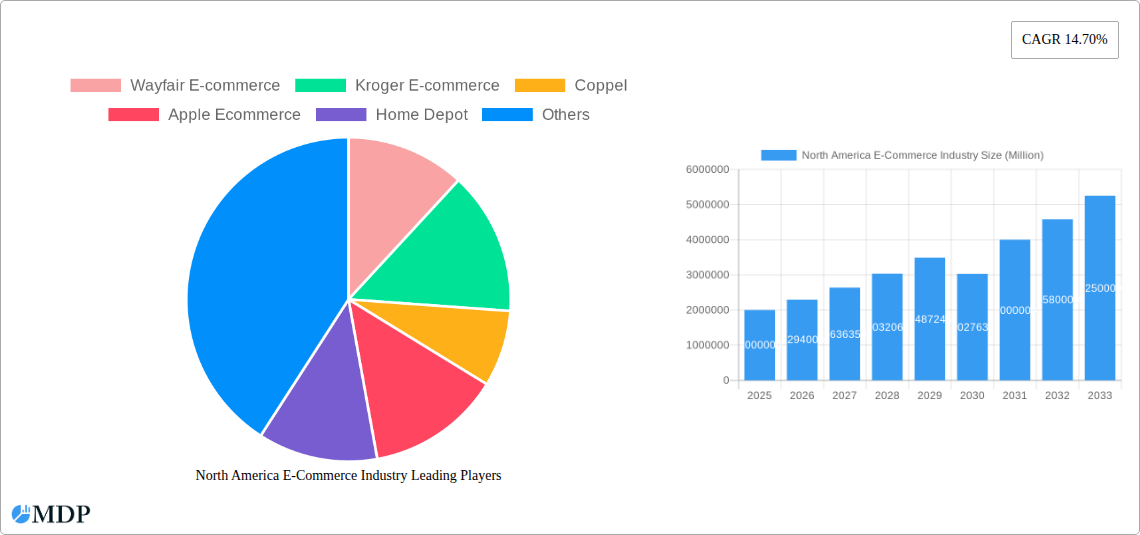
North America E-Commerce Industry Company Market Share
North America E-Commerce Industry Report: 2019-2033
This comprehensive report provides an in-depth analysis of the North American e-commerce market, covering the period 2019-2033. It offers invaluable insights into market dynamics, trends, leading players, and future opportunities, equipping stakeholders with the knowledge to make informed strategic decisions. The report incorporates data from the historical period (2019-2024), the base year (2025), and provides forecasts for the period 2025-2033. Key players analyzed include Amazon com Inc, Walmart Inc, Target, Best Buy, Home Depot, COSTCO, Apple Ecommerce, Kroger E-commerce, Wayfair E-commerce, and Shien, across key segments like Beauty & Personal Care, Consumer Electronics, Fashion & Apparel, Food & Beverage, and Furniture & Home, within the United States and Canada. The report projects a market value exceeding xx Million by 2033.
North America E-Commerce Industry Market Dynamics & Concentration
The North American e-commerce market exhibits a high degree of concentration, with a few dominant players controlling a significant market share. Amazon com Inc. and Walmart Inc. currently hold the largest shares, followed by Target and other key players. However, the market is characterized by ongoing innovation, fueled by advancements in technology such as artificial intelligence (AI) and machine learning (ML), driving personalized shopping experiences and improved logistics. Regulatory frameworks, including data privacy regulations and antitrust laws, significantly influence market dynamics. The emergence of e-commerce marketplaces and the growth of social commerce also contribute to competitive intensity. Product substitutes, such as traditional brick-and-mortar retail, continue to exert pressure. Consumer preferences are shifting towards convenience, personalization, and omnichannel experiences. M&A activity remains significant, with xx deals recorded in the historical period. This consolidation trend is expected to continue, further shaping the market landscape.
- Market Share: Amazon com Inc. (xx%), Walmart Inc. (xx%), Target (xx%), Others (xx%) (2025 Estimates)
- M&A Deal Counts: xx (2019-2024)
- Key Innovation Drivers: AI, ML, Blockchain, Augmented Reality (AR)
- Regulatory Focus: Data privacy, antitrust, consumer protection
North America E-Commerce Industry Industry Trends & Analysis
The North American e-commerce market is experiencing robust growth, driven by rising internet penetration, increasing smartphone adoption, and a growing preference for online shopping convenience. The market's Compound Annual Growth Rate (CAGR) is projected to be xx% during the forecast period (2025-2033). Technological disruptions, such as the rise of mobile commerce and the increasing adoption of omnichannel strategies, significantly influence market dynamics. Consumer preferences are shifting towards personalized experiences, seamless delivery options, and increased transparency and authenticity. Competitive dynamics are intense, with companies continuously innovating to improve customer experience, enhance supply chain efficiency, and optimize pricing strategies. Market penetration is high in urban areas, but opportunities remain in rural markets. The increasing importance of sustainable practices and ethical sourcing is also shaping consumer behavior.
Leading Markets & Segments in North America E-Commerce Industry
The United States dominates the North American e-commerce market, accounting for a significantly larger share than Canada. This dominance stems from its larger population, higher internet penetration, and more mature e-commerce ecosystem. Within the B2C segment, Consumer Electronics and Fashion & Apparel are the leading segments, driven by high consumer demand and a wide range of product offerings.
Key Drivers of Dominance:
- United States: Stronger economy, higher disposable incomes, advanced logistics infrastructure, established e-commerce ecosystem.
- Consumer Electronics: High demand for gadgets and technological advancements, competitive pricing strategies.
- Fashion & Apparel: Wide variety of styles and brands available online, competitive pricing, ease of returns and exchanges.
Dominance Analysis: The US market's sheer size, coupled with consumer preferences for online shopping and strong technological infrastructure, establishes it as the clear leader. Similarly, Consumer Electronics and Fashion & Apparel benefits from high consumer demand, diverse product offerings, and established online retail infrastructure.
North America E-Commerce Industry Product Developments
Product innovations are heavily influenced by technological advancements, including AI-powered recommendations, personalized shopping experiences, improved search functionality, and augmented reality applications. Companies are continuously developing innovative solutions to enhance customer engagement, improve product discovery, and streamline the checkout process. These innovations enhance customer experience and improve conversion rates. The focus is on creating a more seamless and personalized shopping experience. The market fit for these innovations is strong, as consumers increasingly value convenience, personalization, and engaging shopping experiences.
Key Drivers of North America E-Commerce Industry Growth
Several factors drive the growth of the North American e-commerce industry. Technological advancements, particularly in mobile commerce and AI-powered personalization, are pivotal. Favorable economic conditions and increased consumer spending contribute to market expansion. Government initiatives promoting digitalization and e-commerce adoption also play a significant role. Furthermore, the growing popularity of online marketplaces and social commerce platforms fuels market growth. For example, the increased adoption of mobile payment systems has streamlined the shopping process, contributing to sales growth.
Challenges in the North America E-Commerce Industry Market
The North American e-commerce industry faces significant challenges. Intense competition leads to pricing pressures and necessitates continuous innovation. Supply chain disruptions can cause delays and increased costs, impacting profitability. Stringent regulations, such as data privacy laws and tax policies, create compliance burdens. Cybersecurity threats pose a risk to consumer data and business operations. These challenges collectively impact overall market profitability and growth. For example, supply chain disruptions in 2022 resulted in xx Million in lost revenue for some companies.
Emerging Opportunities in North America E-Commerce Industry
The long-term growth of the North American e-commerce industry is driven by several emerging opportunities. The expansion of e-commerce into new markets, particularly rural areas, offers significant potential. Advancements in technologies like AI and augmented reality can create more immersive and personalized shopping experiences. Strategic partnerships between retailers and technology providers can unlock new capabilities and market access. Finally, the growing adoption of sustainable and ethical practices within the industry can attract environmentally conscious consumers.
Leading Players in the North America E-Commerce Industry Sector
Key Milestones in North America E-Commerce Industry Industry
- 2020: Significant surge in e-commerce due to COVID-19 pandemic lockdowns.
- 2021: Increased adoption of Buy Now Pay Later (BNPL) services.
- 2022: Supply chain disruptions impacting delivery times and costs.
- 2023: Continued growth in mobile commerce and social commerce.
- 2024: Increased focus on sustainability and ethical sourcing.
Strategic Outlook for North America E-Commerce Industry Market
The future of the North American e-commerce market appears bright, with continued growth driven by technological advancements, expanding consumer base, and evolving consumer preferences. Strategic opportunities lie in personalization, omnichannel integration, and sustainable practices. Companies that can effectively leverage technology, optimize their supply chains, and offer exceptional customer experiences are poised for success. The market's potential for growth is immense, with opportunities for both established players and new entrants to thrive.
North America E-Commerce Industry Segmentation
-
1. Type
- 1.1. B2C E-commerce
- 1.2. B2B E-commerce
-
2. Industry vertical
- 2.1. Beauty & Personal Care
- 2.2. Consumer Electronics
- 2.3. Fashion & Apparel
- 2.4. Food & Beverage
- 2.5. Furniture & Home
North America E-Commerce Industry Segmentation By Geography
-
1. North America
- 1.1. United States
- 1.2. Canada
- 1.3. Mexico
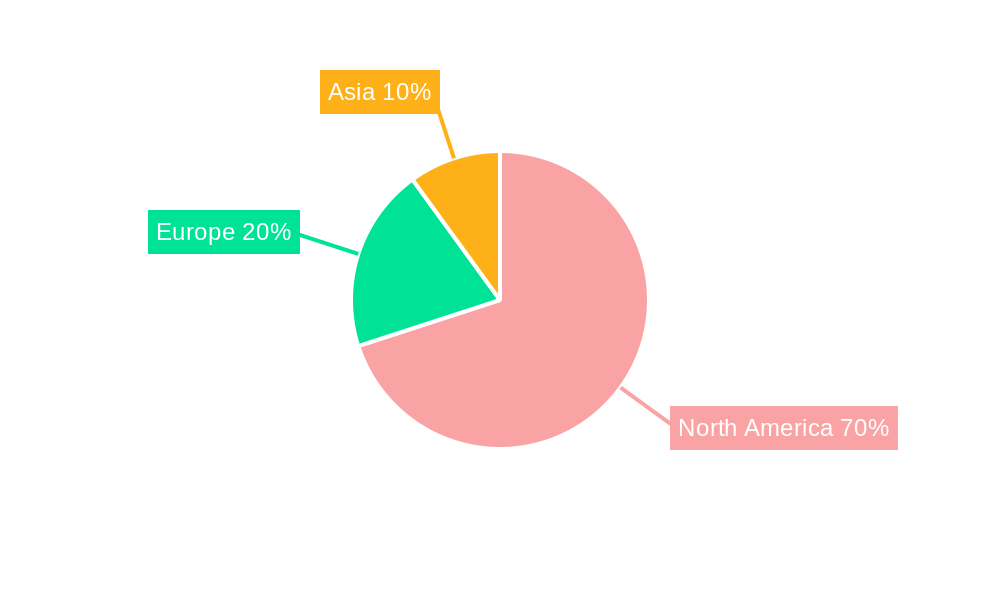
North America E-Commerce Industry Regional Market Share
Geographic Coverage of North America E-Commerce Industry
North America E-Commerce Industry REPORT HIGHLIGHTS
| Aspects | Details |
|---|---|
| Study Period | 2020-2034 |
| Base Year | 2025 |
| Estimated Year | 2026 |
| Forecast Period | 2026-2034 |
| Historical Period | 2020-2025 |
| Growth Rate | CAGR of 18.1% from 2020-2034 |
| Segmentation |
|
Table of Contents
- 1. Introduction
- 1.1. Research Scope
- 1.2. Market Segmentation
- 1.3. Research Objective
- 1.4. Definitions and Assumptions
- 2. Executive Summary
- 2.1. Market Snapshot
- 3. Market Dynamics
- 3.1. Market Drivers
- 3.2. Market Restrains
- 3.3. Market Trends
- 3.4. Market Opportunities
- 4. Market Factor Analysis
- 4.1. Porters Five Forces
- 4.1.1. Bargaining Power of Suppliers
- 4.1.2. Bargaining Power of Buyers
- 4.1.3. Threat of New Entrants
- 4.1.4. Threat of Substitutes
- 4.1.5. Competitive Rivalry
- 4.2. PESTEL analysis
- 4.3. BCG Analysis
- 4.3.1. Stars (High Growth, High Market Share)
- 4.3.2. Cash Cows (Low Growth, High Market Share)
- 4.3.3. Question Mark (High Growth, Low Market Share)
- 4.3.4. Dogs (Low Growth, Low Market Share)
- 4.4. Ansoff Matrix Analysis
- 4.5. Supply Chain Analysis
- 4.6. Regulatory Landscape
- 4.7. Current Market Potential and Opportunity Assessment (TAM–SAM–SOM Framework)
- 4.8. MDP Analyst Note
- 4.1. Porters Five Forces
- 5. Market Analysis, Insights and Forecast 2021-2033
- 5.1. Market Analysis, Insights and Forecast - by Type
- 5.1.1. B2C E-commerce
- 5.1.2. B2B E-commerce
- 5.2. Market Analysis, Insights and Forecast - by Industry vertical
- 5.2.1. Beauty & Personal Care
- 5.2.2. Consumer Electronics
- 5.2.3. Fashion & Apparel
- 5.2.4. Food & Beverage
- 5.2.5. Furniture & Home
- 5.3. Market Analysis, Insights and Forecast - by Region
- 5.3.1. North America
- 5.1. Market Analysis, Insights and Forecast - by Type
- 6. North America E-Commerce Industry Analysis, Insights and Forecast, 2021-2033
- 6.1. Market Analysis, Insights and Forecast - by Type
- 6.1.1. B2C E-commerce
- 6.1.2. B2B E-commerce
- 6.2. Market Analysis, Insights and Forecast - by Industry vertical
- 6.2.1. Beauty & Personal Care
- 6.2.2. Consumer Electronics
- 6.2.3. Fashion & Apparel
- 6.2.4. Food & Beverage
- 6.2.5. Furniture & Home
- 6.1. Market Analysis, Insights and Forecast - by Type
- 7. Competitive Analysis
- 7.1. Company Profiles
- 7.1.1 Wayfair E-commerce
- 7.1.1.1. Company Overview
- 7.1.1.2. Products
- 7.1.1.3. Company Financials
- 7.1.1.4. SWOT Analysis
- 7.1.2 Kroger E-commerce
- 7.1.2.1. Company Overview
- 7.1.2.2. Products
- 7.1.2.3. Company Financials
- 7.1.2.4. SWOT Analysis
- 7.1.3 Coppel
- 7.1.3.1. Company Overview
- 7.1.3.2. Products
- 7.1.3.3. Company Financials
- 7.1.3.4. SWOT Analysis
- 7.1.4 Apple Ecommerce
- 7.1.4.1. Company Overview
- 7.1.4.2. Products
- 7.1.4.3. Company Financials
- 7.1.4.4. SWOT Analysis
- 7.1.5 Home Depot
- 7.1.5.1. Company Overview
- 7.1.5.2. Products
- 7.1.5.3. Company Financials
- 7.1.5.4. SWOT Analysis
- 7.1.6 Best Buy
- 7.1.6.1. Company Overview
- 7.1.6.2. Products
- 7.1.6.3. Company Financials
- 7.1.6.4. SWOT Analysis
- 7.1.7 COSTCO
- 7.1.7.1. Company Overview
- 7.1.7.2. Products
- 7.1.7.3. Company Financials
- 7.1.7.4. SWOT Analysis
- 7.1.8 Amazon com Inc
- 7.1.8.1. Company Overview
- 7.1.8.2. Products
- 7.1.8.3. Company Financials
- 7.1.8.4. SWOT Analysis
- 7.1.9 Target
- 7.1.9.1. Company Overview
- 7.1.9.2. Products
- 7.1.9.3. Company Financials
- 7.1.9.4. SWOT Analysis
- 7.1.10 Walmart Inc
- 7.1.10.1. Company Overview
- 7.1.10.2. Products
- 7.1.10.3. Company Financials
- 7.1.10.4. SWOT Analysis
- 7.1.11 Shien
- 7.1.11.1. Company Overview
- 7.1.11.2. Products
- 7.1.11.3. Company Financials
- 7.1.11.4. SWOT Analysis
- 7.1.1 Wayfair E-commerce
- 7.2. Market Entropy
- 7.2.1 Company's Key Areas Served
- 7.2.2 Recent Developments
- 7.3. Company Market Share Analysis 2025
- 7.3.1 Top 5 Companies Market Share Analysis
- 7.3.2 Top 3 Companies Market Share Analysis
- 7.4. List of Potential Customers
- 8. Research Methodology
List of Figures
- Figure 1: North America E-Commerce Industry Revenue Breakdown (million, %) by Product 2025 & 2033
- Figure 2: North America E-Commerce Industry Share (%) by Company 2025
List of Tables
- Table 1: North America E-Commerce Industry Revenue million Forecast, by Type 2020 & 2033
- Table 2: North America E-Commerce Industry Volume K Unit Forecast, by Type 2020 & 2033
- Table 3: North America E-Commerce Industry Revenue million Forecast, by Industry vertical 2020 & 2033
- Table 4: North America E-Commerce Industry Volume K Unit Forecast, by Industry vertical 2020 & 2033
- Table 5: North America E-Commerce Industry Revenue million Forecast, by Region 2020 & 2033
- Table 6: North America E-Commerce Industry Volume K Unit Forecast, by Region 2020 & 2033
- Table 7: North America E-Commerce Industry Revenue million Forecast, by Type 2020 & 2033
- Table 8: North America E-Commerce Industry Volume K Unit Forecast, by Type 2020 & 2033
- Table 9: North America E-Commerce Industry Revenue million Forecast, by Industry vertical 2020 & 2033
- Table 10: North America E-Commerce Industry Volume K Unit Forecast, by Industry vertical 2020 & 2033
- Table 11: North America E-Commerce Industry Revenue million Forecast, by Country 2020 & 2033
- Table 12: North America E-Commerce Industry Volume K Unit Forecast, by Country 2020 & 2033
- Table 13: United States North America E-Commerce Industry Revenue (million) Forecast, by Application 2020 & 2033
- Table 14: United States North America E-Commerce Industry Volume (K Unit) Forecast, by Application 2020 & 2033
- Table 15: Canada North America E-Commerce Industry Revenue (million) Forecast, by Application 2020 & 2033
- Table 16: Canada North America E-Commerce Industry Volume (K Unit) Forecast, by Application 2020 & 2033
- Table 17: Mexico North America E-Commerce Industry Revenue (million) Forecast, by Application 2020 & 2033
- Table 18: Mexico North America E-Commerce Industry Volume (K Unit) Forecast, by Application 2020 & 2033
Frequently Asked Questions
1. What is the projected Compound Annual Growth Rate (CAGR) of the North America E-Commerce Industry?
The projected CAGR is approximately 18.1%.
2. Which companies are prominent players in the North America E-Commerce Industry?
Key companies in the market include Wayfair E-commerce, Kroger E-commerce, Coppel, Apple Ecommerce, Home Depot, Best Buy, COSTCO, Amazon com Inc, Target, Walmart Inc, Shien.
3. What are the main segments of the North America E-Commerce Industry?
The market segments include Type , Industry vertical.
4. Can you provide details about the market size?
The market size is estimated to be USD 3333.8 million as of 2022.
5. What are some drivers contributing to market growth?
Increase in the Adoption of Latest Technology; Increasing Consumer Interest towards Convenient Shopping solutions.
6. What are the notable trends driving market growth?
Consumer Interest in Convenient Shopping Solutions is driving the E-Commerce market to grow..
7. Are there any restraints impacting market growth?
Privacy and Copyright Issues among E-sellers and Book Writers.
8. Can you provide examples of recent developments in the market?
N/A
9. What pricing options are available for accessing the report?
Pricing options include single-user, multi-user, and enterprise licenses priced at USD 3800, USD 4500, and USD 5800 respectively.
10. Is the market size provided in terms of value or volume?
The market size is provided in terms of value, measured in million and volume, measured in K Unit.
11. Are there any specific market keywords associated with the report?
Yes, the market keyword associated with the report is "North America E-Commerce Industry," which aids in identifying and referencing the specific market segment covered.
12. How do I determine which pricing option suits my needs best?
The pricing options vary based on user requirements and access needs. Individual users may opt for single-user licenses, while businesses requiring broader access may choose multi-user or enterprise licenses for cost-effective access to the report.
13. Are there any additional resources or data provided in the North America E-Commerce Industry report?
While the report offers comprehensive insights, it's advisable to review the specific contents or supplementary materials provided to ascertain if additional resources or data are available.
14. How can I stay updated on further developments or reports in the North America E-Commerce Industry?
To stay informed about further developments, trends, and reports in the North America E-Commerce Industry, consider subscribing to industry newsletters, following relevant companies and organizations, or regularly checking reputable industry news sources and publications.
Methodology
Step 1 - Identification of Relevant Samples Size from Population Database


Step 2 - Approaches for Defining Global Market Size (Value, Volume* & Price*)

Note*: In applicable scenarios
Step 3 - Data Sources
Primary Research
- Web Analytics
- Survey Reports
- Research Institute
- Latest Research Reports
- Opinion Leaders
Secondary Research
- Annual Reports
- White Paper
- Latest Press Release
- Industry Association
- Paid Database
- Investor Presentations

Step 4 - Data Triangulation
Involves using different sources of information in order to increase the validity of a study
These sources are likely to be stakeholders in a program - participants, other researchers, program staff, other community members, and so on.
Then we put all data in single framework & apply various statistical tools to find out the dynamic on the market.
During the analysis stage, feedback from the stakeholder groups would be compared to determine areas of agreement as well as areas of divergence