

Key Insights
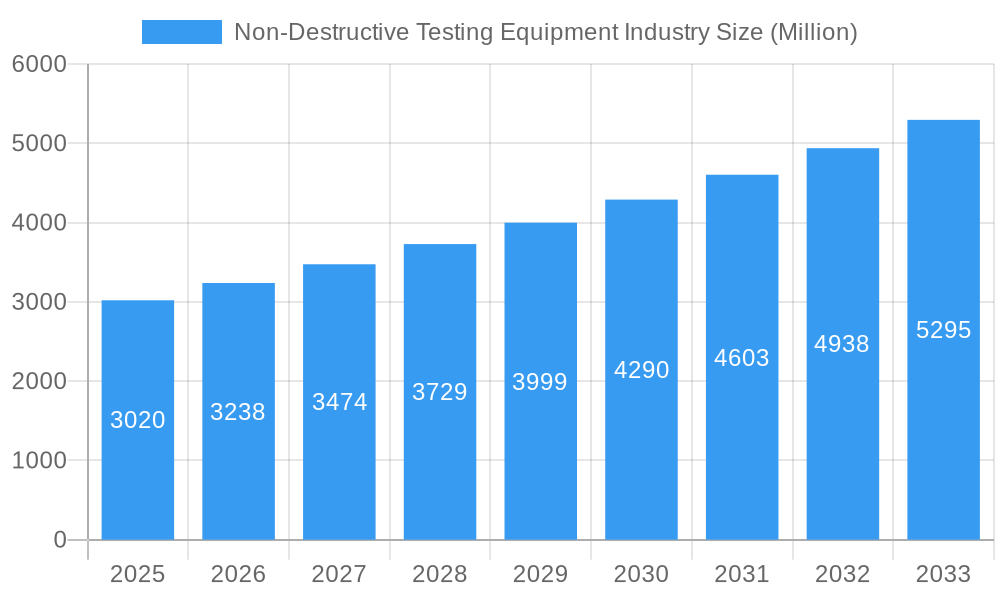
The Non-Destructive Testing (NDT) equipment market, valued at $3.02 billion in 2025, is projected to experience robust growth, driven by the increasing demand for infrastructure development, stringent safety regulations across various industries, and the rising adoption of advanced NDT techniques. The Compound Annual Growth Rate (CAGR) of 7.20% from 2019 to 2024 suggests a consistently expanding market. Key drivers include the growing need for quality control and assurance in manufacturing processes, particularly in sectors like aerospace & defense, automotive, and oil & gas, where equipment failure can have catastrophic consequences. Technological advancements, such as the integration of AI and machine learning in NDT equipment for improved accuracy and efficiency, are further fueling market expansion. While challenges exist, such as the high initial investment costs associated with advanced equipment and the need for skilled personnel, the overall market outlook remains positive, with substantial growth expected throughout the forecast period (2025-2033). Specific segments like radiography and ultrasonic testing equipment are likely to maintain significant market share due to their established reliability and widespread applications. The increasing adoption of non-destructive testing in emerging economies will significantly contribute to future growth.
Non-Destructive Testing Equipment Industry Market Size (In Billion)
The geographical distribution of the market shows strong presence across North America and Europe, driven by mature industries and robust regulatory frameworks. However, Asia-Pacific is anticipated to witness the fastest growth, owing to rapid industrialization and infrastructure development in countries like China and India. The competitive landscape is characterized by a mix of established multinational corporations and specialized NDT equipment manufacturers. Continuous innovation, strategic partnerships, and mergers and acquisitions will likely shape the market dynamics in the coming years, leading to a more consolidated yet technologically advanced landscape. The focus on developing portable and user-friendly equipment, coupled with the increasing demand for remote inspection technologies, will further influence market segmentation and growth trajectories within the NDT equipment sector.
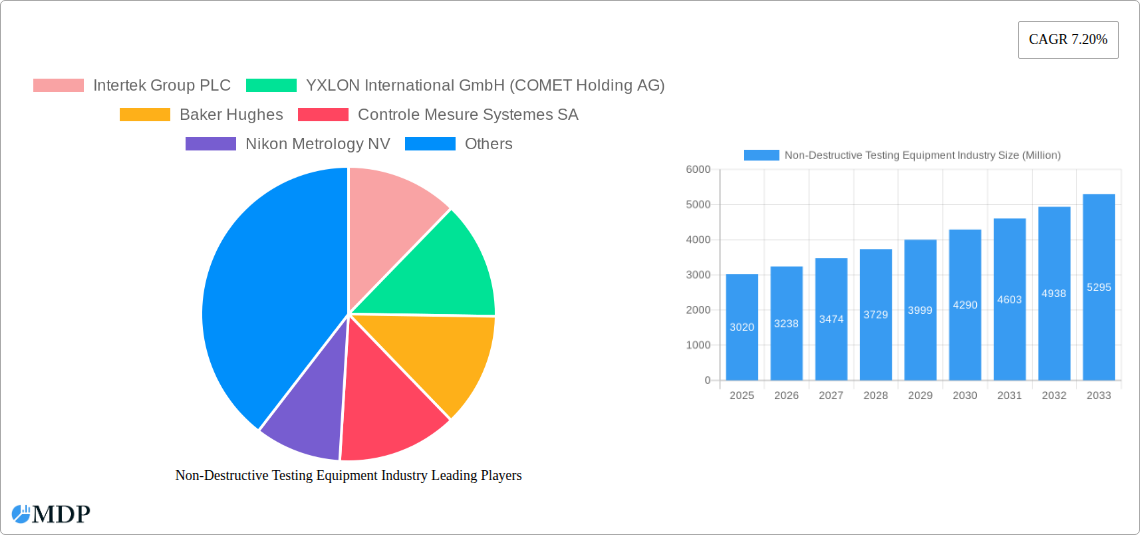
Non-Destructive Testing Equipment Industry Company Market Share
Non-Destructive Testing (NDT) Equipment Market: A Comprehensive Report (2019-2033)
This comprehensive report provides an in-depth analysis of the Non-Destructive Testing (NDT) equipment market, offering actionable insights for stakeholders across the industry value chain. With a study period spanning 2019-2033, a base year of 2025, and a forecast period of 2025-2033, this report leverages historical data (2019-2024) to project future market trends. The market is valued at xx Million in 2025 and is projected to reach xx Million by 2033, exhibiting a CAGR of xx%. This report analyzes market dynamics, leading players, technological advancements, and key growth opportunities within the NDT equipment sector.
Non-Destructive Testing Equipment Industry Market Dynamics & Concentration
The NDT equipment market is characterized by a moderately concentrated landscape with several multinational corporations and specialized players holding significant market share. Intertek Group PLC, YXLON International GmbH (COMET Holding AG), and Baker Hughes are among the leading players, collectively accounting for an estimated xx% of the market in 2025. Market concentration is influenced by factors such as economies of scale, technological expertise, and global reach.
Key Market Dynamics:
- Innovation Drivers: Continuous advancements in NDT technologies, including AI-powered image analysis and automated inspection systems, drive market growth. The development of more efficient and portable equipment caters to evolving industry needs.
- Regulatory Frameworks: Stringent safety regulations across various end-user industries, particularly in oil & gas and aerospace, mandate the use of NDT equipment, fueling market demand.
- Product Substitutes: Limited viable substitutes exist for NDT technologies; however, advancements in alternative inspection methods could pose a minor challenge in niche applications.
- End-User Trends: Growing demand for improved safety, reduced downtime, and enhanced quality control across diverse industries drives the adoption of sophisticated NDT equipment.
- M&A Activities: The past five years have witnessed xx M&A deals in the NDT equipment sector, with larger players consolidating their market position through strategic acquisitions of smaller specialized firms. This consolidation trend is expected to continue.
Non-Destructive Testing Equipment Industry Industry Trends & Analysis
The NDT equipment market is experiencing robust growth, driven by several key factors. Increasing infrastructure development, particularly in emerging economies, coupled with stricter safety regulations across various industries, is significantly boosting demand. The global market size is projected to grow from xx Million in 2025 to xx Million by 2033, demonstrating a notable expansion. This growth is further propelled by the adoption of advanced technologies, such as automated systems and AI-powered analysis tools that enhance efficiency and accuracy. The automotive and aerospace sectors are major contributors to this growth trajectory, fueled by the need for rigorous quality control in manufacturing and maintenance processes. The market penetration of advanced NDT technologies like phased array ultrasonic testing and digital radiography is rapidly increasing, replacing conventional methods. Competitive dynamics are shaped by technological innovation, product differentiation, and the ability to provide comprehensive service packages, including equipment sales, maintenance, and training.
Leading Markets & Segments in Non-Destructive Testing Equipment Industry
The Oil and Gas sector remains the dominant end-user industry for NDT equipment, accounting for approximately xx% of the market share in 2025, followed by Aerospace & Defense and Power & Energy. Geographically, North America and Europe are currently the largest markets. However, Asia-Pacific is projected to experience the fastest growth rate over the forecast period due to rapid industrialization and infrastructure development.
Key Drivers by Segment:
- By Technology:
- Ultrasonic Testing Equipment: Driven by its versatility and effectiveness in various applications.
- Radiography Testing Equipment: High demand in aerospace and heavy industries.
- Magnetic Particle Testing Equipment: Widely used in automotive and manufacturing.
- By End-user Industry:
- Oil and Gas: Stringent safety and regulatory requirements drive high adoption.
- Aerospace and Defense: High demand for advanced NDT solutions due to safety-critical applications.
- Power and Energy: Inspection and maintenance needs of power generation assets.
Dominance Analysis: The dominance of Oil and Gas is primarily due to its stringent safety protocols and the critical need for asset integrity management in offshore and onshore operations. The Aerospace and Defense sector’s high demand is linked to its stringent quality control needs, while the strong growth projected for the Asia-Pacific region is directly tied to its rapid infrastructural growth and industrialization.
Non-Destructive Testing Equipment Industry Product Developments
Recent product innovations focus on enhancing portability, automation, and data analysis capabilities. New systems integrate advanced imaging techniques with AI algorithms for improved defect detection and analysis. Manufacturers are also focusing on developing user-friendly interfaces and providing comprehensive software packages for data management and reporting. This focus on user experience and data-driven insights drives competitive advantages in the market.
Key Drivers of Non-Destructive Testing Equipment Industry Growth
The primary drivers of market growth include:
- Stringent safety regulations: Increased emphasis on asset integrity and safety across industries.
- Technological advancements: Development of advanced NDT technologies, like AI-powered inspection and automation.
- Infrastructure development: Global investments in infrastructure projects necessitate rigorous quality control.
- Rising demand in emerging economies: Rapid industrialization in developing countries fuels market expansion.
Challenges in the Non-Destructive Testing Equipment Industry Market
The market faces challenges, including:
- High initial investment costs: Advanced NDT equipment can be expensive, posing a barrier for smaller companies.
- Specialized skill requirements: Operating and interpreting data from advanced NDT systems necessitates skilled personnel.
- Supply chain disruptions: Global supply chain issues can impact the availability and cost of components.
Emerging Opportunities in the Non-Destructive Testing Equipment Industry
Significant opportunities exist in:
- Development of AI-powered NDT solutions: Enhanced automation and data analysis capabilities.
- Expansion into emerging markets: Untapped potential in developing economies with growing infrastructure development.
- Strategic partnerships: Collaboration between equipment manufacturers and service providers to offer integrated solutions.
Leading Players in the Non-Destructive Testing Equipment Industry Sector
- Intertek Group PLC
- YXLON International GmbH (COMET Holding AG)
- Baker Hughes
- Controle Mesure Systemes SA
- Nikon Metrology NV
- Fujifilm Corporation
- Mistras Group Inc
- OkoNDT Group
- Innospection Limited
- Applus+ Laboratories
- Bureau Veritas SA
- Olympus Corporation
- Magnaflux Corp
Key Milestones in Non-Destructive Testing Equipment Industry Industry
- May 2023: MP Machinery and Testing announced the release of proprietary material testing equipment, expanding the capabilities of NDT in various sectors.
- May 2023: The American Petroleum Institute (API) signed MoUs with ASNT and NDTMA, promoting high-quality NDT in the oil and gas industry and enhancing safety standards.
Strategic Outlook for Non-Destructive Testing Equipment Industry Market
The NDT equipment market is poised for significant growth, driven by technological advancements, rising safety concerns, and expanding infrastructure projects globally. Strategic opportunities lie in developing innovative solutions, focusing on user-friendliness, and expanding into new markets, particularly in rapidly developing economies. Companies that embrace technological innovation and strategic partnerships will be best positioned to capture the substantial market potential.
Non-Destructive Testing Equipment Industry Segmentation
-
1. Technology
- 1.1. Radiography Testing Equipment
- 1.2. Ultrasonic Testing Equipment
- 1.3. Magnetic Particle Testing Equipment
- 1.4. Liquid Penetrant Testing Equipment
- 1.5. Visual Inspection Equipment
- 1.6. Eddy Current Equipment
- 1.7. Other Technologies Equipment
-
2. End-user Industry
- 2.1. Oil and Gas
- 2.2. Power and Energy
- 2.3. Aerospace and Defense
- 2.4. Automotive and Transportation
- 2.5. Construction
- 2.6. Other End-user Industries
Non-Destructive Testing Equipment Industry Segmentation By Geography
-
1. North America
- 1.1. United States
- 1.2. Canada
-
2. Europe
- 2.1. United Kingdom
- 2.2. Germany
- 2.3. France
- 2.4. Russia
- 2.5. Italy
-
3. Asia
- 3.1. China
- 3.2. India
- 3.3. South Korea
- 4. Australia and New Zealand
-
5. Latin America
- 5.1. Mexico
- 5.2. Brazil
- 5.3. Argentina
-
6. Middle East and Africa
- 6.1. Saudi Arabia
- 6.2. United Arab Emirates
- 6.3. Qatar
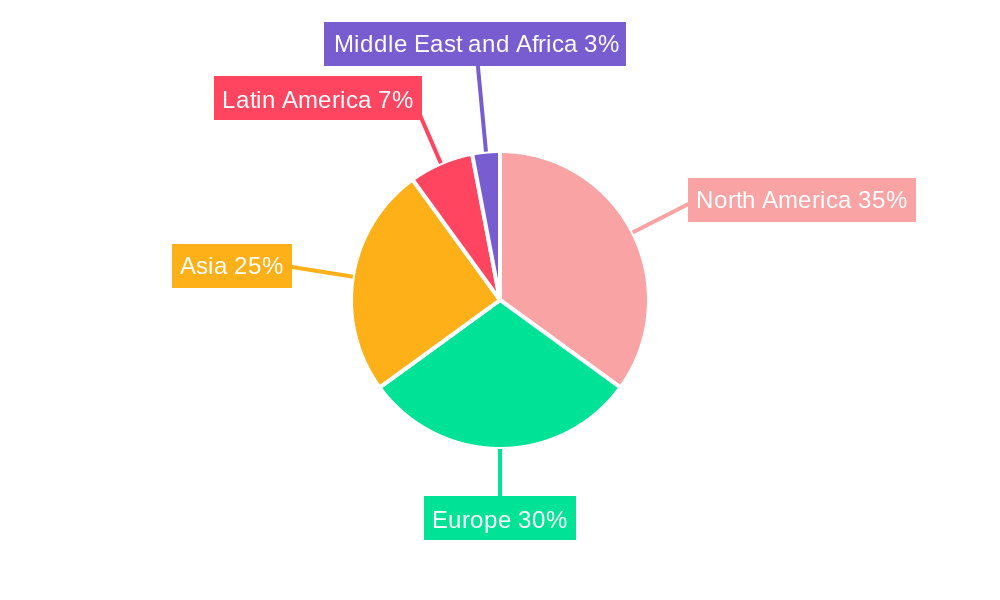
Non-Destructive Testing Equipment Industry Regional Market Share
Geographic Coverage of Non-Destructive Testing Equipment Industry
Non-Destructive Testing Equipment Industry REPORT HIGHLIGHTS
| Aspects | Details |
|---|---|
| Study Period | 2020-2034 |
| Base Year | 2025 |
| Estimated Year | 2026 |
| Forecast Period | 2026-2034 |
| Historical Period | 2020-2025 |
| Growth Rate | CAGR of 7.20% from 2020-2034 |
| Segmentation |
|
Table of Contents
- 1. Introduction
- 1.1. Research Scope
- 1.2. Market Segmentation
- 1.3. Research Objective
- 1.4. Definitions and Assumptions
- 2. Executive Summary
- 2.1. Market Snapshot
- 3. Market Dynamics
- 3.1. Market Drivers
- 3.2. Market Restrains
- 3.3. Market Trends
- 3.4. Market Opportunities
- 4. Market Factor Analysis
- 4.1. Porters Five Forces
- 4.1.1. Bargaining Power of Suppliers
- 4.1.2. Bargaining Power of Buyers
- 4.1.3. Threat of New Entrants
- 4.1.4. Threat of Substitutes
- 4.1.5. Competitive Rivalry
- 4.2. PESTEL analysis
- 4.3. BCG Analysis
- 4.3.1. Stars (High Growth, High Market Share)
- 4.3.2. Cash Cows (Low Growth, High Market Share)
- 4.3.3. Question Mark (High Growth, Low Market Share)
- 4.3.4. Dogs (Low Growth, Low Market Share)
- 4.4. Ansoff Matrix Analysis
- 4.5. Supply Chain Analysis
- 4.6. Regulatory Landscape
- 4.7. Current Market Potential and Opportunity Assessment (TAM–SAM–SOM Framework)
- 4.8. MDP Analyst Note
- 4.1. Porters Five Forces
- 5. Market Analysis, Insights and Forecast 2021-2033
- 5.1. Market Analysis, Insights and Forecast - by Technology
- 5.1.1. Radiography Testing Equipment
- 5.1.2. Ultrasonic Testing Equipment
- 5.1.3. Magnetic Particle Testing Equipment
- 5.1.4. Liquid Penetrant Testing Equipment
- 5.1.5. Visual Inspection Equipment
- 5.1.6. Eddy Current Equipment
- 5.1.7. Other Technologies Equipment
- 5.2. Market Analysis, Insights and Forecast - by End-user Industry
- 5.2.1. Oil and Gas
- 5.2.2. Power and Energy
- 5.2.3. Aerospace and Defense
- 5.2.4. Automotive and Transportation
- 5.2.5. Construction
- 5.2.6. Other End-user Industries
- 5.3. Market Analysis, Insights and Forecast - by Region
- 5.3.1. North America
- 5.3.2. Europe
- 5.3.3. Asia
- 5.3.4. Australia and New Zealand
- 5.3.5. Latin America
- 5.3.6. Middle East and Africa
- 5.1. Market Analysis, Insights and Forecast - by Technology
- 6. Global Non-Destructive Testing Equipment Industry Analysis, Insights and Forecast, 2021-2033
- 6.1. Market Analysis, Insights and Forecast - by Technology
- 6.1.1. Radiography Testing Equipment
- 6.1.2. Ultrasonic Testing Equipment
- 6.1.3. Magnetic Particle Testing Equipment
- 6.1.4. Liquid Penetrant Testing Equipment
- 6.1.5. Visual Inspection Equipment
- 6.1.6. Eddy Current Equipment
- 6.1.7. Other Technologies Equipment
- 6.2. Market Analysis, Insights and Forecast - by End-user Industry
- 6.2.1. Oil and Gas
- 6.2.2. Power and Energy
- 6.2.3. Aerospace and Defense
- 6.2.4. Automotive and Transportation
- 6.2.5. Construction
- 6.2.6. Other End-user Industries
- 6.1. Market Analysis, Insights and Forecast - by Technology
- 7. North America Non-Destructive Testing Equipment Industry Analysis, Insights and Forecast, 2020-2032
- 7.1. Market Analysis, Insights and Forecast - by Technology
- 7.1.1. Radiography Testing Equipment
- 7.1.2. Ultrasonic Testing Equipment
- 7.1.3. Magnetic Particle Testing Equipment
- 7.1.4. Liquid Penetrant Testing Equipment
- 7.1.5. Visual Inspection Equipment
- 7.1.6. Eddy Current Equipment
- 7.1.7. Other Technologies Equipment
- 7.2. Market Analysis, Insights and Forecast - by End-user Industry
- 7.2.1. Oil and Gas
- 7.2.2. Power and Energy
- 7.2.3. Aerospace and Defense
- 7.2.4. Automotive and Transportation
- 7.2.5. Construction
- 7.2.6. Other End-user Industries
- 7.1. Market Analysis, Insights and Forecast - by Technology
- 8. Europe Non-Destructive Testing Equipment Industry Analysis, Insights and Forecast, 2020-2032
- 8.1. Market Analysis, Insights and Forecast - by Technology
- 8.1.1. Radiography Testing Equipment
- 8.1.2. Ultrasonic Testing Equipment
- 8.1.3. Magnetic Particle Testing Equipment
- 8.1.4. Liquid Penetrant Testing Equipment
- 8.1.5. Visual Inspection Equipment
- 8.1.6. Eddy Current Equipment
- 8.1.7. Other Technologies Equipment
- 8.2. Market Analysis, Insights and Forecast - by End-user Industry
- 8.2.1. Oil and Gas
- 8.2.2. Power and Energy
- 8.2.3. Aerospace and Defense
- 8.2.4. Automotive and Transportation
- 8.2.5. Construction
- 8.2.6. Other End-user Industries
- 8.1. Market Analysis, Insights and Forecast - by Technology
- 9. Asia Non-Destructive Testing Equipment Industry Analysis, Insights and Forecast, 2020-2032
- 9.1. Market Analysis, Insights and Forecast - by Technology
- 9.1.1. Radiography Testing Equipment
- 9.1.2. Ultrasonic Testing Equipment
- 9.1.3. Magnetic Particle Testing Equipment
- 9.1.4. Liquid Penetrant Testing Equipment
- 9.1.5. Visual Inspection Equipment
- 9.1.6. Eddy Current Equipment
- 9.1.7. Other Technologies Equipment
- 9.2. Market Analysis, Insights and Forecast - by End-user Industry
- 9.2.1. Oil and Gas
- 9.2.2. Power and Energy
- 9.2.3. Aerospace and Defense
- 9.2.4. Automotive and Transportation
- 9.2.5. Construction
- 9.2.6. Other End-user Industries
- 9.1. Market Analysis, Insights and Forecast - by Technology
- 10. Australia and New Zealand Non-Destructive Testing Equipment Industry Analysis, Insights and Forecast, 2020-2032
- 10.1. Market Analysis, Insights and Forecast - by Technology
- 10.1.1. Radiography Testing Equipment
- 10.1.2. Ultrasonic Testing Equipment
- 10.1.3. Magnetic Particle Testing Equipment
- 10.1.4. Liquid Penetrant Testing Equipment
- 10.1.5. Visual Inspection Equipment
- 10.1.6. Eddy Current Equipment
- 10.1.7. Other Technologies Equipment
- 10.2. Market Analysis, Insights and Forecast - by End-user Industry
- 10.2.1. Oil and Gas
- 10.2.2. Power and Energy
- 10.2.3. Aerospace and Defense
- 10.2.4. Automotive and Transportation
- 10.2.5. Construction
- 10.2.6. Other End-user Industries
- 10.1. Market Analysis, Insights and Forecast - by Technology
- 11. Latin America Non-Destructive Testing Equipment Industry Analysis, Insights and Forecast, 2020-2032
- 11.1. Market Analysis, Insights and Forecast - by Technology
- 11.1.1. Radiography Testing Equipment
- 11.1.2. Ultrasonic Testing Equipment
- 11.1.3. Magnetic Particle Testing Equipment
- 11.1.4. Liquid Penetrant Testing Equipment
- 11.1.5. Visual Inspection Equipment
- 11.1.6. Eddy Current Equipment
- 11.1.7. Other Technologies Equipment
- 11.2. Market Analysis, Insights and Forecast - by End-user Industry
- 11.2.1. Oil and Gas
- 11.2.2. Power and Energy
- 11.2.3. Aerospace and Defense
- 11.2.4. Automotive and Transportation
- 11.2.5. Construction
- 11.2.6. Other End-user Industries
- 11.1. Market Analysis, Insights and Forecast - by Technology
- 12. Middle East and Africa Non-Destructive Testing Equipment Industry Analysis, Insights and Forecast, 2020-2032
- 12.1. Market Analysis, Insights and Forecast - by Technology
- 12.1.1. Radiography Testing Equipment
- 12.1.2. Ultrasonic Testing Equipment
- 12.1.3. Magnetic Particle Testing Equipment
- 12.1.4. Liquid Penetrant Testing Equipment
- 12.1.5. Visual Inspection Equipment
- 12.1.6. Eddy Current Equipment
- 12.1.7. Other Technologies Equipment
- 12.2. Market Analysis, Insights and Forecast - by End-user Industry
- 12.2.1. Oil and Gas
- 12.2.2. Power and Energy
- 12.2.3. Aerospace and Defense
- 12.2.4. Automotive and Transportation
- 12.2.5. Construction
- 12.2.6. Other End-user Industries
- 12.1. Market Analysis, Insights and Forecast - by Technology
- 13. Competitive Analysis
- 13.1. Company Profiles
- 13.1.1 Intertek Group PLC
- 13.1.1.1. Company Overview
- 13.1.1.2. Products
- 13.1.1.3. Company Financials
- 13.1.1.4. SWOT Analysis
- 13.1.2 YXLON International GmbH (COMET Holding AG)
- 13.1.2.1. Company Overview
- 13.1.2.2. Products
- 13.1.2.3. Company Financials
- 13.1.2.4. SWOT Analysis
- 13.1.3 Baker Hughes
- 13.1.3.1. Company Overview
- 13.1.3.2. Products
- 13.1.3.3. Company Financials
- 13.1.3.4. SWOT Analysis
- 13.1.4 Controle Mesure Systemes SA
- 13.1.4.1. Company Overview
- 13.1.4.2. Products
- 13.1.4.3. Company Financials
- 13.1.4.4. SWOT Analysis
- 13.1.5 Nikon Metrology NV
- 13.1.5.1. Company Overview
- 13.1.5.2. Products
- 13.1.5.3. Company Financials
- 13.1.5.4. SWOT Analysis
- 13.1.6 Fujifilm Corporation
- 13.1.6.1. Company Overview
- 13.1.6.2. Products
- 13.1.6.3. Company Financials
- 13.1.6.4. SWOT Analysis
- 13.1.7 Mistras Group Inc
- 13.1.7.1. Company Overview
- 13.1.7.2. Products
- 13.1.7.3. Company Financials
- 13.1.7.4. SWOT Analysis
- 13.1.8 OkoNDT Group
- 13.1.8.1. Company Overview
- 13.1.8.2. Products
- 13.1.8.3. Company Financials
- 13.1.8.4. SWOT Analysis
- 13.1.9 Innospection Limited
- 13.1.9.1. Company Overview
- 13.1.9.2. Products
- 13.1.9.3. Company Financials
- 13.1.9.4. SWOT Analysis
- 13.1.10 Applus+ Laboratories
- 13.1.10.1. Company Overview
- 13.1.10.2. Products
- 13.1.10.3. Company Financials
- 13.1.10.4. SWOT Analysis
- 13.1.11 Bureau Veritas SA
- 13.1.11.1. Company Overview
- 13.1.11.2. Products
- 13.1.11.3. Company Financials
- 13.1.11.4. SWOT Analysis
- 13.1.12 Olympus Corporation
- 13.1.12.1. Company Overview
- 13.1.12.2. Products
- 13.1.12.3. Company Financials
- 13.1.12.4. SWOT Analysis
- 13.1.13 Magnaflux Corp
- 13.1.13.1. Company Overview
- 13.1.13.2. Products
- 13.1.13.3. Company Financials
- 13.1.13.4. SWOT Analysis
- 13.1.1 Intertek Group PLC
- 13.2. Market Entropy
- 13.2.1 Company's Key Areas Served
- 13.2.2 Recent Developments
- 13.3. Company Market Share Analysis 2025
- 13.3.1 Top 5 Companies Market Share Analysis
- 13.3.2 Top 3 Companies Market Share Analysis
- 13.4. List of Potential Customers
- 14. Research Methodology
List of Figures
- Figure 1: Global Non-Destructive Testing Equipment Industry Revenue Breakdown (Million, %) by Region 2025 & 2033
- Figure 2: North America Non-Destructive Testing Equipment Industry Revenue (Million), by Technology 2025 & 2033
- Figure 3: North America Non-Destructive Testing Equipment Industry Revenue Share (%), by Technology 2025 & 2033
- Figure 4: North America Non-Destructive Testing Equipment Industry Revenue (Million), by End-user Industry 2025 & 2033
- Figure 5: North America Non-Destructive Testing Equipment Industry Revenue Share (%), by End-user Industry 2025 & 2033
- Figure 6: North America Non-Destructive Testing Equipment Industry Revenue (Million), by Country 2025 & 2033
- Figure 7: North America Non-Destructive Testing Equipment Industry Revenue Share (%), by Country 2025 & 2033
- Figure 8: Europe Non-Destructive Testing Equipment Industry Revenue (Million), by Technology 2025 & 2033
- Figure 9: Europe Non-Destructive Testing Equipment Industry Revenue Share (%), by Technology 2025 & 2033
- Figure 10: Europe Non-Destructive Testing Equipment Industry Revenue (Million), by End-user Industry 2025 & 2033
- Figure 11: Europe Non-Destructive Testing Equipment Industry Revenue Share (%), by End-user Industry 2025 & 2033
- Figure 12: Europe Non-Destructive Testing Equipment Industry Revenue (Million), by Country 2025 & 2033
- Figure 13: Europe Non-Destructive Testing Equipment Industry Revenue Share (%), by Country 2025 & 2033
- Figure 14: Asia Non-Destructive Testing Equipment Industry Revenue (Million), by Technology 2025 & 2033
- Figure 15: Asia Non-Destructive Testing Equipment Industry Revenue Share (%), by Technology 2025 & 2033
- Figure 16: Asia Non-Destructive Testing Equipment Industry Revenue (Million), by End-user Industry 2025 & 2033
- Figure 17: Asia Non-Destructive Testing Equipment Industry Revenue Share (%), by End-user Industry 2025 & 2033
- Figure 18: Asia Non-Destructive Testing Equipment Industry Revenue (Million), by Country 2025 & 2033
- Figure 19: Asia Non-Destructive Testing Equipment Industry Revenue Share (%), by Country 2025 & 2033
- Figure 20: Australia and New Zealand Non-Destructive Testing Equipment Industry Revenue (Million), by Technology 2025 & 2033
- Figure 21: Australia and New Zealand Non-Destructive Testing Equipment Industry Revenue Share (%), by Technology 2025 & 2033
- Figure 22: Australia and New Zealand Non-Destructive Testing Equipment Industry Revenue (Million), by End-user Industry 2025 & 2033
- Figure 23: Australia and New Zealand Non-Destructive Testing Equipment Industry Revenue Share (%), by End-user Industry 2025 & 2033
- Figure 24: Australia and New Zealand Non-Destructive Testing Equipment Industry Revenue (Million), by Country 2025 & 2033
- Figure 25: Australia and New Zealand Non-Destructive Testing Equipment Industry Revenue Share (%), by Country 2025 & 2033
- Figure 26: Latin America Non-Destructive Testing Equipment Industry Revenue (Million), by Technology 2025 & 2033
- Figure 27: Latin America Non-Destructive Testing Equipment Industry Revenue Share (%), by Technology 2025 & 2033
- Figure 28: Latin America Non-Destructive Testing Equipment Industry Revenue (Million), by End-user Industry 2025 & 2033
- Figure 29: Latin America Non-Destructive Testing Equipment Industry Revenue Share (%), by End-user Industry 2025 & 2033
- Figure 30: Latin America Non-Destructive Testing Equipment Industry Revenue (Million), by Country 2025 & 2033
- Figure 31: Latin America Non-Destructive Testing Equipment Industry Revenue Share (%), by Country 2025 & 2033
- Figure 32: Middle East and Africa Non-Destructive Testing Equipment Industry Revenue (Million), by Technology 2025 & 2033
- Figure 33: Middle East and Africa Non-Destructive Testing Equipment Industry Revenue Share (%), by Technology 2025 & 2033
- Figure 34: Middle East and Africa Non-Destructive Testing Equipment Industry Revenue (Million), by End-user Industry 2025 & 2033
- Figure 35: Middle East and Africa Non-Destructive Testing Equipment Industry Revenue Share (%), by End-user Industry 2025 & 2033
- Figure 36: Middle East and Africa Non-Destructive Testing Equipment Industry Revenue (Million), by Country 2025 & 2033
- Figure 37: Middle East and Africa Non-Destructive Testing Equipment Industry Revenue Share (%), by Country 2025 & 2033
List of Tables
- Table 1: Global Non-Destructive Testing Equipment Industry Revenue Million Forecast, by Technology 2020 & 2033
- Table 2: Global Non-Destructive Testing Equipment Industry Revenue Million Forecast, by End-user Industry 2020 & 2033
- Table 3: Global Non-Destructive Testing Equipment Industry Revenue Million Forecast, by Region 2020 & 2033
- Table 4: Global Non-Destructive Testing Equipment Industry Revenue Million Forecast, by Technology 2020 & 2033
- Table 5: Global Non-Destructive Testing Equipment Industry Revenue Million Forecast, by End-user Industry 2020 & 2033
- Table 6: Global Non-Destructive Testing Equipment Industry Revenue Million Forecast, by Country 2020 & 2033
- Table 7: United States Non-Destructive Testing Equipment Industry Revenue (Million) Forecast, by Application 2020 & 2033
- Table 8: Canada Non-Destructive Testing Equipment Industry Revenue (Million) Forecast, by Application 2020 & 2033
- Table 9: Global Non-Destructive Testing Equipment Industry Revenue Million Forecast, by Technology 2020 & 2033
- Table 10: Global Non-Destructive Testing Equipment Industry Revenue Million Forecast, by End-user Industry 2020 & 2033
- Table 11: Global Non-Destructive Testing Equipment Industry Revenue Million Forecast, by Country 2020 & 2033
- Table 12: United Kingdom Non-Destructive Testing Equipment Industry Revenue (Million) Forecast, by Application 2020 & 2033
- Table 13: Germany Non-Destructive Testing Equipment Industry Revenue (Million) Forecast, by Application 2020 & 2033
- Table 14: France Non-Destructive Testing Equipment Industry Revenue (Million) Forecast, by Application 2020 & 2033
- Table 15: Russia Non-Destructive Testing Equipment Industry Revenue (Million) Forecast, by Application 2020 & 2033
- Table 16: Italy Non-Destructive Testing Equipment Industry Revenue (Million) Forecast, by Application 2020 & 2033
- Table 17: Global Non-Destructive Testing Equipment Industry Revenue Million Forecast, by Technology 2020 & 2033
- Table 18: Global Non-Destructive Testing Equipment Industry Revenue Million Forecast, by End-user Industry 2020 & 2033
- Table 19: Global Non-Destructive Testing Equipment Industry Revenue Million Forecast, by Country 2020 & 2033
- Table 20: China Non-Destructive Testing Equipment Industry Revenue (Million) Forecast, by Application 2020 & 2033
- Table 21: India Non-Destructive Testing Equipment Industry Revenue (Million) Forecast, by Application 2020 & 2033
- Table 22: South Korea Non-Destructive Testing Equipment Industry Revenue (Million) Forecast, by Application 2020 & 2033
- Table 23: Global Non-Destructive Testing Equipment Industry Revenue Million Forecast, by Technology 2020 & 2033
- Table 24: Global Non-Destructive Testing Equipment Industry Revenue Million Forecast, by End-user Industry 2020 & 2033
- Table 25: Global Non-Destructive Testing Equipment Industry Revenue Million Forecast, by Country 2020 & 2033
- Table 26: Global Non-Destructive Testing Equipment Industry Revenue Million Forecast, by Technology 2020 & 2033
- Table 27: Global Non-Destructive Testing Equipment Industry Revenue Million Forecast, by End-user Industry 2020 & 2033
- Table 28: Global Non-Destructive Testing Equipment Industry Revenue Million Forecast, by Country 2020 & 2033
- Table 29: Mexico Non-Destructive Testing Equipment Industry Revenue (Million) Forecast, by Application 2020 & 2033
- Table 30: Brazil Non-Destructive Testing Equipment Industry Revenue (Million) Forecast, by Application 2020 & 2033
- Table 31: Argentina Non-Destructive Testing Equipment Industry Revenue (Million) Forecast, by Application 2020 & 2033
- Table 32: Global Non-Destructive Testing Equipment Industry Revenue Million Forecast, by Technology 2020 & 2033
- Table 33: Global Non-Destructive Testing Equipment Industry Revenue Million Forecast, by End-user Industry 2020 & 2033
- Table 34: Global Non-Destructive Testing Equipment Industry Revenue Million Forecast, by Country 2020 & 2033
- Table 35: Saudi Arabia Non-Destructive Testing Equipment Industry Revenue (Million) Forecast, by Application 2020 & 2033
- Table 36: United Arab Emirates Non-Destructive Testing Equipment Industry Revenue (Million) Forecast, by Application 2020 & 2033
- Table 37: Qatar Non-Destructive Testing Equipment Industry Revenue (Million) Forecast, by Application 2020 & 2033
Frequently Asked Questions
1. What is the projected Compound Annual Growth Rate (CAGR) of the Non-Destructive Testing Equipment Industry?
The projected CAGR is approximately 7.20%.
2. Which companies are prominent players in the Non-Destructive Testing Equipment Industry?
Key companies in the market include Intertek Group PLC, YXLON International GmbH (COMET Holding AG), Baker Hughes, Controle Mesure Systemes SA, Nikon Metrology NV, Fujifilm Corporation, Mistras Group Inc, OkoNDT Group, Innospection Limited, Applus+ Laboratories, Bureau Veritas SA, Olympus Corporation, Magnaflux Corp.
3. What are the main segments of the Non-Destructive Testing Equipment Industry?
The market segments include Technology, End-user Industry.
4. Can you provide details about the market size?
The market size is estimated to be USD 3.02 Million as of 2022.
5. What are some drivers contributing to market growth?
Stringent Regulations Mandating Safety; Aging Infrastructure and Increasing Need for Maintenance.
6. What are the notable trends driving market growth?
Oil and Gas Holds Highest Market Share.
7. Are there any restraints impacting market growth?
Lack of Skilled Personnel and Training Facilities.
8. Can you provide examples of recent developments in the market?
May 2023: MP Machinery and Testing announced the release of proprietary material testing equipment that non-destructively determines the material properties of structures and in-service components. MPM provides advanced material testing products and services for the steel, nuclear power & energy, aerospace, pipe, defense, and transportation industries.
9. What pricing options are available for accessing the report?
Pricing options include single-user, multi-user, and enterprise licenses priced at USD 4750, USD 5250, and USD 8750 respectively.
10. Is the market size provided in terms of value or volume?
The market size is provided in terms of value, measured in Million.
11. Are there any specific market keywords associated with the report?
Yes, the market keyword associated with the report is "Non-Destructive Testing Equipment Industry," which aids in identifying and referencing the specific market segment covered.
12. How do I determine which pricing option suits my needs best?
The pricing options vary based on user requirements and access needs. Individual users may opt for single-user licenses, while businesses requiring broader access may choose multi-user or enterprise licenses for cost-effective access to the report.
13. Are there any additional resources or data provided in the Non-Destructive Testing Equipment Industry report?
While the report offers comprehensive insights, it's advisable to review the specific contents or supplementary materials provided to ascertain if additional resources or data are available.
14. How can I stay updated on further developments or reports in the Non-Destructive Testing Equipment Industry?
To stay informed about further developments, trends, and reports in the Non-Destructive Testing Equipment Industry, consider subscribing to industry newsletters, following relevant companies and organizations, or regularly checking reputable industry news sources and publications.
Methodology
Step 1 - Identification of Relevant Samples Size from Population Database


Step 2 - Approaches for Defining Global Market Size (Value, Volume* & Price*)

Note*: In applicable scenarios
Step 3 - Data Sources
Primary Research
- Web Analytics
- Survey Reports
- Research Institute
- Latest Research Reports
- Opinion Leaders
Secondary Research
- Annual Reports
- White Paper
- Latest Press Release
- Industry Association
- Paid Database
- Investor Presentations

Step 4 - Data Triangulation
Involves using different sources of information in order to increase the validity of a study
These sources are likely to be stakeholders in a program - participants, other researchers, program staff, other community members, and so on.
Then we put all data in single framework & apply various statistical tools to find out the dynamic on the market.
During the analysis stage, feedback from the stakeholder groups would be compared to determine areas of agreement as well as areas of divergence