

Key Insights
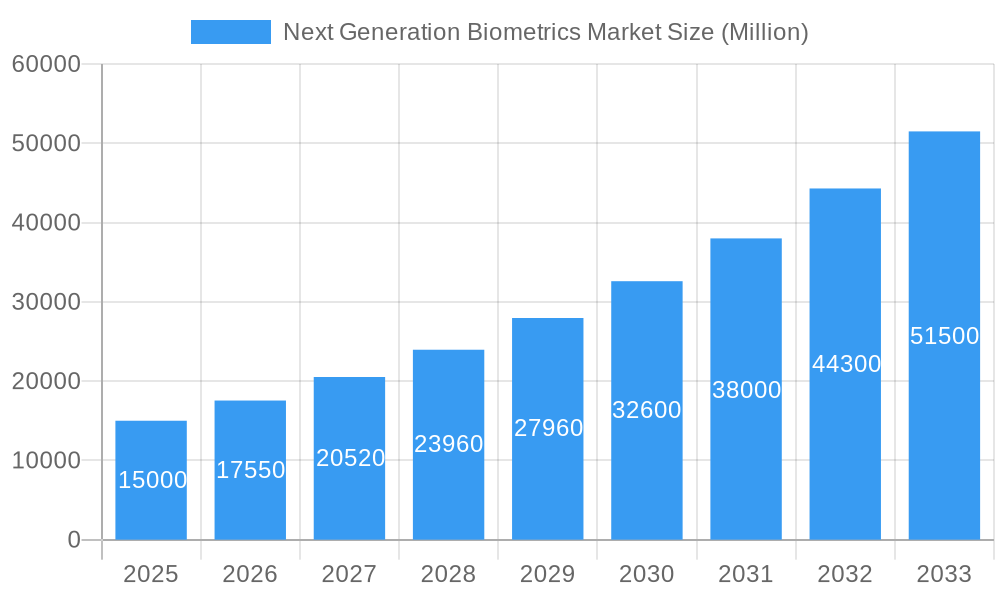
The Next Generation Biometrics Market is poised for significant expansion, projected to reach $43.34 billion by 2033, with a robust Compound Annual Growth Rate (CAGR) of 17.6% from a base year of 2025. This growth trajectory is propelled by escalating security imperatives across government, defense, and financial sectors, driving demand for advanced, highly accurate biometric solutions. The pervasive integration of biometrics into consumer electronics, including smartphones, and access control systems further accelerates market penetration. Supportive government initiatives for digital identity and enhanced border security also contribute substantially. Continuous technological advancements in image processing and user-friendly interface development are key enablers. The market is segmented by solution (facial, fingerprint, iris, palm print, signature recognition) and end-user vertical (government, defense, travel, home security, banking, healthcare). Facial recognition leads current market share, with fingerprint recognition remaining a dominant technology. Emerging modalities like iris and palm print recognition are gaining traction due to superior security attributes. Geographically, North America and Europe demonstrate strong established markets, while Asia-Pacific is anticipated for substantial growth driven by rapid digitalization and technological adoption.
Next Generation Biometrics Market Market Size (In Billion)
Despite a promising outlook, market growth is tempered by concerns surrounding data privacy and security, alongside implementation and maintenance costs. The establishment of comprehensive regulatory frameworks for data governance is crucial. Addressing technological limitations and ensuring system interoperability are vital for widespread adoption. However, ongoing innovation and a clearer understanding of next-generation biometrics' benefits are expected to overcome these hurdles. Competitive pressures among leading players will foster innovation and enhance product offerings.
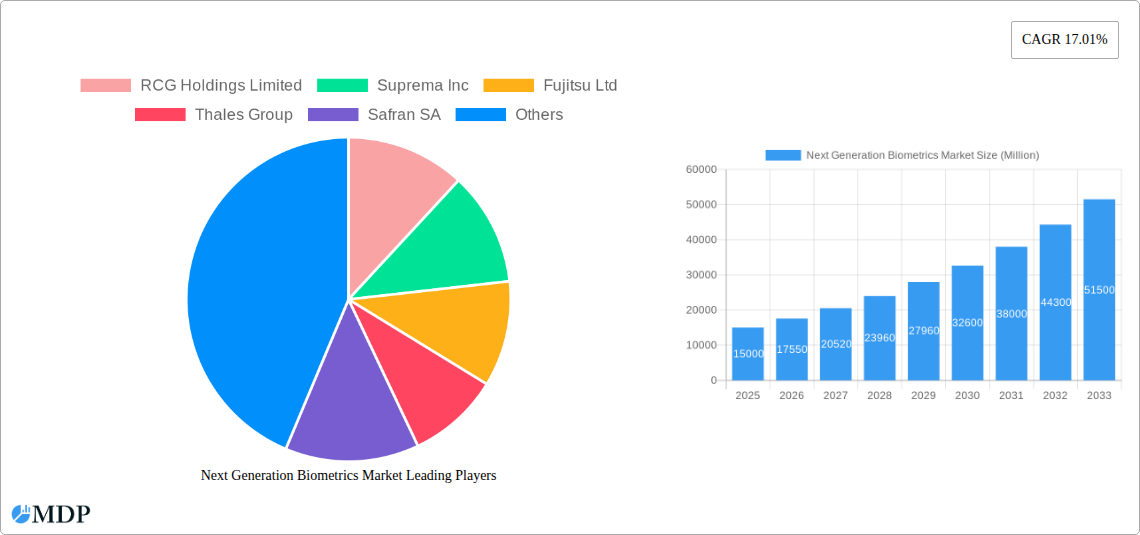
Next Generation Biometrics Market Company Market Share
Next Generation Biometrics Market: A Comprehensive Report (2019-2033)
This in-depth report provides a comprehensive analysis of the Next Generation Biometrics Market, offering invaluable insights for stakeholders across the industry. From market dynamics and concentration to leading players and future opportunities, this report covers all crucial aspects of this rapidly evolving sector. The market is projected to reach xx Million by 2033, exhibiting a significant CAGR during the forecast period (2025-2033). This report covers the historical period (2019-2024), the base year (2025), and the estimated year (2025).
Next Generation Biometrics Market Dynamics & Concentration
The Next Generation Biometrics Market is characterized by a dynamic interplay of factors influencing its growth and concentration. Market concentration is currently [Insert Market Concentration Metric, e.g., moderately high/low], with the top 5 players holding an estimated [Insert Percentage]% market share in 2025. Innovation, particularly in areas like AI-powered facial recognition and multi-modal biometric systems, is a primary growth driver. Stringent regulatory frameworks concerning data privacy and security are shaping market practices, requiring robust security measures and compliance with regulations like GDPR and CCPA. The market also faces competition from established security technologies, like access cards and passwords, though biometric solutions are increasingly favored for their enhanced security and convenience. Furthermore, end-user preferences are shifting towards contactless and seamless biometric authentication, driving demand for advanced solutions. M&A activity in the sector is [Insert Description, e.g., moderate/high], with approximately [Insert Number] deals recorded in the past [Insert Time Period, e.g., 3 years], reflecting strategic efforts to expand market reach and enhance technological capabilities.
- Key Market Dynamics:
- Strong innovation in AI and multi-modal biometrics.
- Increasing regulatory scrutiny regarding data privacy and security.
- Competition from traditional security technologies.
- Rising demand for contactless and seamless authentication.
- Moderate M&A activity for strategic expansion.
Next Generation Biometrics Market Industry Trends & Analysis
The Next Generation Biometrics Market is experiencing robust growth, driven by factors such as the increasing adoption of biometric authentication across various sectors, rising security concerns, and advancements in biometric technologies. The market is witnessing a significant shift towards contactless biometric systems due to hygiene concerns and user convenience. The increasing penetration of smartphones and other smart devices equipped with biometric sensors is fueling market expansion. Furthermore, the growing demand for secure identity verification in diverse sectors, including finance, healthcare, and government, is propelling market growth. The market is also experiencing technological disruptions through the integration of AI and machine learning algorithms, leading to enhanced accuracy and efficiency. Competitive dynamics are intense, with leading players focusing on product innovation, strategic partnerships, and geographic expansion to maintain a competitive edge. The market is expected to witness a CAGR of [Insert CAGR Percentage]% during the forecast period (2025-2033), with market penetration increasing from [Insert Percentage]% in 2025 to [Insert Percentage]% in 2033.
Leading Markets & Segments in Next Generation Biometrics Market
The Government sector currently dominates the Next Generation Biometrics Market, driven by increasing government initiatives for national security and border control. The Face Recognition segment holds the largest market share among the various types of solutions due to its widespread applicability and ease of implementation. North America and Europe are currently the leading regions, with high adoption rates in developed economies.
Key Drivers for Dominant Segments:
- Government: Stringent security needs, national ID programs, border control initiatives.
- Face Recognition: Ease of use, widespread applicability, advancements in AI-powered recognition.
- North America & Europe: High technological advancement, robust infrastructure, strong regulatory support.
Detailed Dominance Analysis: [Insert Paragraph analyzing the reasons for dominance of specified segments and regions, discussing economic factors, infrastructure, technological development, consumer preferences, etc.]
Next Generation Biometrics Market Product Developments
Recent product innovations focus on enhancing accuracy, speed, and user experience. Multi-modal biometric systems, combining different biometric traits for enhanced security, are gaining popularity. Contactless solutions are becoming the norm, driven by hygiene concerns and user preference. The integration of AI and machine learning is improving accuracy and reducing error rates, while advancements in sensor technology are enabling smaller, more efficient devices. These innovations address the market need for secure, user-friendly, and cost-effective biometric authentication solutions.
Key Drivers of Next Generation Biometrics Market Growth
Technological advancements, particularly in AI and machine learning, are significantly driving market growth by improving accuracy and efficiency of biometric systems. Government regulations mandating enhanced security measures in various sectors are fueling adoption. The increasing need for secure identity verification across multiple applications, ranging from banking and financial services to healthcare and travel, also contribute to market expansion. Furthermore, rising consumer demand for seamless and convenient authentication experiences is boosting market growth.
Challenges in the Next Generation Biometrics Market
Data privacy and security concerns pose a significant challenge, requiring robust data protection measures. Supply chain disruptions impacting the availability of crucial components can hinder production. Intense competition among established players and new entrants creates price pressure and necessitates continuous innovation. Regulatory hurdles and varying standards across different jurisdictions create compliance complexities. For example, [Insert example showing the impact of a specific challenge, e.g., the difficulty in securing universal acceptance of biometric data standards across international borders].
Emerging Opportunities in Next Generation Biometrics Market
The integration of blockchain technology offers enhanced security and data management capabilities. Strategic partnerships between biometric technology providers and other industry players open new market avenues. Expanding market penetration in developing economies presents significant growth opportunities. Advancements in behavioral biometrics and liveness detection systems provide enhanced security features, adding to the market potential.
Leading Players in the Next Generation Biometrics Market Sector
Key Milestones in Next Generation Biometrics Market Industry
- June 2022: Vision-Box launched the Seamless Kiosk, a new biometric solution designed to revolutionize travel experiences. This launch signifies the growing market demand for seamless and efficient biometric solutions in the travel sector.
- May 2022: IDEMIA introduced two new MorphoWave contactless fingerprint terminals, enhancing accessibility and affordability of biometric deployments. This highlights the ongoing focus on user-friendly and cost-effective solutions.
- January 2022: IDEMIA partnered with Microsoft to supply next-generation eSIM and connection technologies. This collaboration underscores the increasing importance of strategic partnerships in driving innovation and market expansion within the biometric sector.
Strategic Outlook for Next Generation Biometrics Market
The Next Generation Biometrics Market is poised for continued robust growth, driven by technological advancements, increasing security concerns, and expanding applications across various sectors. Strategic partnerships, geographic expansion into emerging markets, and continuous innovation in biometric technologies will be crucial factors for long-term success. The focus on developing secure, user-friendly, and cost-effective solutions will be key to capitalizing on the market's significant growth potential.
Next Generation Biometrics Market Segmentation
-
1. Type of Solution
- 1.1. Face Recognition
- 1.2. Fingerprint Recognition
- 1.3. Iris Recognition
- 1.4. Palm Print Recognition
- 1.5. Signature Recognition
- 1.6. Other Types of Solutions
-
2. End-user Vertical
- 2.1. Government
- 2.2. Defense
- 2.3. Travel and Immigration
- 2.4. Home Security
- 2.5. Banking and Financial Service
- 2.6. Healthcare
- 2.7. Other End-user Verticals
Next Generation Biometrics Market Segmentation By Geography
- 1. North America
- 2. Europe
- 3. Asia Pacific
- 4. Middle East
- 5. Latin America
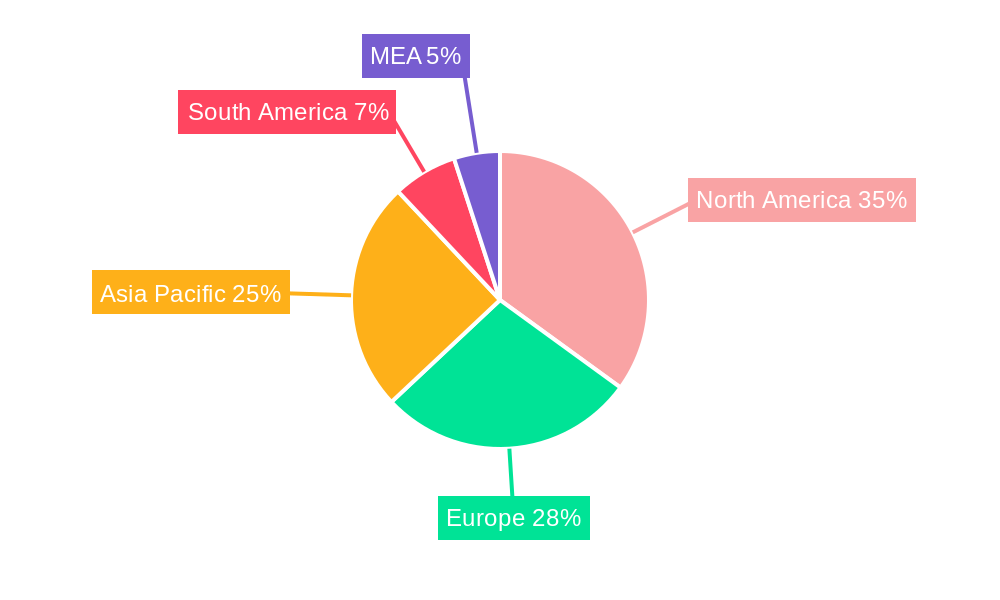
Next Generation Biometrics Market Regional Market Share
Geographic Coverage of Next Generation Biometrics Market
Next Generation Biometrics Market REPORT HIGHLIGHTS
| Aspects | Details |
|---|---|
| Study Period | 2020-2034 |
| Base Year | 2025 |
| Estimated Year | 2026 |
| Forecast Period | 2026-2034 |
| Historical Period | 2020-2025 |
| Growth Rate | CAGR of 17.6% from 2020-2034 |
| Segmentation |
|
Table of Contents
- 1. Introduction
- 1.1. Research Scope
- 1.2. Market Segmentation
- 1.3. Research Objective
- 1.4. Definitions and Assumptions
- 2. Executive Summary
- 2.1. Market Snapshot
- 3. Market Dynamics
- 3.1. Market Drivers
- 3.2. Market Restrains
- 3.3. Market Trends
- 3.4. Market Opportunities
- 4. Market Factor Analysis
- 4.1. Porters Five Forces
- 4.1.1. Bargaining Power of Suppliers
- 4.1.2. Bargaining Power of Buyers
- 4.1.3. Threat of New Entrants
- 4.1.4. Threat of Substitutes
- 4.1.5. Competitive Rivalry
- 4.2. PESTEL analysis
- 4.3. BCG Analysis
- 4.3.1. Stars (High Growth, High Market Share)
- 4.3.2. Cash Cows (Low Growth, High Market Share)
- 4.3.3. Question Mark (High Growth, Low Market Share)
- 4.3.4. Dogs (Low Growth, Low Market Share)
- 4.4. Ansoff Matrix Analysis
- 4.5. Supply Chain Analysis
- 4.6. Regulatory Landscape
- 4.7. Current Market Potential and Opportunity Assessment (TAM–SAM–SOM Framework)
- 4.8. MDP Analyst Note
- 4.1. Porters Five Forces
- 5. Market Analysis, Insights and Forecast 2021-2033
- 5.1. Market Analysis, Insights and Forecast - by Type of Solution
- 5.1.1. Face Recognition
- 5.1.2. Fingerprint Recognition
- 5.1.3. Iris Recognition
- 5.1.4. Palm Print Recognition
- 5.1.5. Signature Recognition
- 5.1.6. Other Types of Solutions
- 5.2. Market Analysis, Insights and Forecast - by End-user Vertical
- 5.2.1. Government
- 5.2.2. Defense
- 5.2.3. Travel and Immigration
- 5.2.4. Home Security
- 5.2.5. Banking and Financial Service
- 5.2.6. Healthcare
- 5.2.7. Other End-user Verticals
- 5.3. Market Analysis, Insights and Forecast - by Region
- 5.3.1. North America
- 5.3.2. Europe
- 5.3.3. Asia Pacific
- 5.3.4. Middle East
- 5.3.5. Latin America
- 5.1. Market Analysis, Insights and Forecast - by Type of Solution
- 6. Global Next Generation Biometrics Market Analysis, Insights and Forecast, 2021-2033
- 6.1. Market Analysis, Insights and Forecast - by Type of Solution
- 6.1.1. Face Recognition
- 6.1.2. Fingerprint Recognition
- 6.1.3. Iris Recognition
- 6.1.4. Palm Print Recognition
- 6.1.5. Signature Recognition
- 6.1.6. Other Types of Solutions
- 6.2. Market Analysis, Insights and Forecast - by End-user Vertical
- 6.2.1. Government
- 6.2.2. Defense
- 6.2.3. Travel and Immigration
- 6.2.4. Home Security
- 6.2.5. Banking and Financial Service
- 6.2.6. Healthcare
- 6.2.7. Other End-user Verticals
- 6.1. Market Analysis, Insights and Forecast - by Type of Solution
- 7. North America Next Generation Biometrics Market Analysis, Insights and Forecast, 2020-2032
- 7.1. Market Analysis, Insights and Forecast - by Type of Solution
- 7.1.1. Face Recognition
- 7.1.2. Fingerprint Recognition
- 7.1.3. Iris Recognition
- 7.1.4. Palm Print Recognition
- 7.1.5. Signature Recognition
- 7.1.6. Other Types of Solutions
- 7.2. Market Analysis, Insights and Forecast - by End-user Vertical
- 7.2.1. Government
- 7.2.2. Defense
- 7.2.3. Travel and Immigration
- 7.2.4. Home Security
- 7.2.5. Banking and Financial Service
- 7.2.6. Healthcare
- 7.2.7. Other End-user Verticals
- 7.1. Market Analysis, Insights and Forecast - by Type of Solution
- 8. Europe Next Generation Biometrics Market Analysis, Insights and Forecast, 2020-2032
- 8.1. Market Analysis, Insights and Forecast - by Type of Solution
- 8.1.1. Face Recognition
- 8.1.2. Fingerprint Recognition
- 8.1.3. Iris Recognition
- 8.1.4. Palm Print Recognition
- 8.1.5. Signature Recognition
- 8.1.6. Other Types of Solutions
- 8.2. Market Analysis, Insights and Forecast - by End-user Vertical
- 8.2.1. Government
- 8.2.2. Defense
- 8.2.3. Travel and Immigration
- 8.2.4. Home Security
- 8.2.5. Banking and Financial Service
- 8.2.6. Healthcare
- 8.2.7. Other End-user Verticals
- 8.1. Market Analysis, Insights and Forecast - by Type of Solution
- 9. Asia Pacific Next Generation Biometrics Market Analysis, Insights and Forecast, 2020-2032
- 9.1. Market Analysis, Insights and Forecast - by Type of Solution
- 9.1.1. Face Recognition
- 9.1.2. Fingerprint Recognition
- 9.1.3. Iris Recognition
- 9.1.4. Palm Print Recognition
- 9.1.5. Signature Recognition
- 9.1.6. Other Types of Solutions
- 9.2. Market Analysis, Insights and Forecast - by End-user Vertical
- 9.2.1. Government
- 9.2.2. Defense
- 9.2.3. Travel and Immigration
- 9.2.4. Home Security
- 9.2.5. Banking and Financial Service
- 9.2.6. Healthcare
- 9.2.7. Other End-user Verticals
- 9.1. Market Analysis, Insights and Forecast - by Type of Solution
- 10. Middle East Next Generation Biometrics Market Analysis, Insights and Forecast, 2020-2032
- 10.1. Market Analysis, Insights and Forecast - by Type of Solution
- 10.1.1. Face Recognition
- 10.1.2. Fingerprint Recognition
- 10.1.3. Iris Recognition
- 10.1.4. Palm Print Recognition
- 10.1.5. Signature Recognition
- 10.1.6. Other Types of Solutions
- 10.2. Market Analysis, Insights and Forecast - by End-user Vertical
- 10.2.1. Government
- 10.2.2. Defense
- 10.2.3. Travel and Immigration
- 10.2.4. Home Security
- 10.2.5. Banking and Financial Service
- 10.2.6. Healthcare
- 10.2.7. Other End-user Verticals
- 10.1. Market Analysis, Insights and Forecast - by Type of Solution
- 11. Latin America Next Generation Biometrics Market Analysis, Insights and Forecast, 2020-2032
- 11.1. Market Analysis, Insights and Forecast - by Type of Solution
- 11.1.1. Face Recognition
- 11.1.2. Fingerprint Recognition
- 11.1.3. Iris Recognition
- 11.1.4. Palm Print Recognition
- 11.1.5. Signature Recognition
- 11.1.6. Other Types of Solutions
- 11.2. Market Analysis, Insights and Forecast - by End-user Vertical
- 11.2.1. Government
- 11.2.2. Defense
- 11.2.3. Travel and Immigration
- 11.2.4. Home Security
- 11.2.5. Banking and Financial Service
- 11.2.6. Healthcare
- 11.2.7. Other End-user Verticals
- 11.1. Market Analysis, Insights and Forecast - by Type of Solution
- 12. Competitive Analysis
- 12.1. Company Profiles
- 12.1.1 RCG Holdings Limited
- 12.1.1.1. Company Overview
- 12.1.1.2. Products
- 12.1.1.3. Company Financials
- 12.1.1.4. SWOT Analysis
- 12.1.2 Suprema Inc
- 12.1.2.1. Company Overview
- 12.1.2.2. Products
- 12.1.2.3. Company Financials
- 12.1.2.4. SWOT Analysis
- 12.1.3 Fujitsu Ltd
- 12.1.3.1. Company Overview
- 12.1.3.2. Products
- 12.1.3.3. Company Financials
- 12.1.3.4. SWOT Analysis
- 12.1.4 Thales Group
- 12.1.4.1. Company Overview
- 12.1.4.2. Products
- 12.1.4.3. Company Financials
- 12.1.4.4. SWOT Analysis
- 12.1.5 Safran SA
- 12.1.5.1. Company Overview
- 12.1.5.2. Products
- 12.1.5.3. Company Financials
- 12.1.5.4. SWOT Analysis
- 12.1.6 Siemens AG
- 12.1.6.1. Company Overview
- 12.1.6.2. Products
- 12.1.6.3. Company Financials
- 12.1.6.4. SWOT Analysis
- 12.1.7 Fingerprint Cards AB
- 12.1.7.1. Company Overview
- 12.1.7.2. Products
- 12.1.7.3. Company Financials
- 12.1.7.4. SWOT Analysis
- 12.1.8 NEC Corporation
- 12.1.8.1. Company Overview
- 12.1.8.2. Products
- 12.1.8.3. Company Financials
- 12.1.8.4. SWOT Analysis
- 12.1.9 Cross Match Technologies
- 12.1.9.1. Company Overview
- 12.1.9.2. Products
- 12.1.9.3. Company Financials
- 12.1.9.4. SWOT Analysis
- 12.1.10 IDEMIA
- 12.1.10.1. Company Overview
- 12.1.10.2. Products
- 12.1.10.3. Company Financials
- 12.1.10.4. SWOT Analysis
- 12.1.1 RCG Holdings Limited
- 12.2. Market Entropy
- 12.2.1 Company's Key Areas Served
- 12.2.2 Recent Developments
- 12.3. Company Market Share Analysis 2025
- 12.3.1 Top 5 Companies Market Share Analysis
- 12.3.2 Top 3 Companies Market Share Analysis
- 12.4. List of Potential Customers
- 13. Research Methodology
List of Figures
- Figure 1: Global Next Generation Biometrics Market Revenue Breakdown (billion, %) by Region 2025 & 2033
- Figure 2: Global Next Generation Biometrics Market Volume Breakdown (K Unit, %) by Region 2025 & 2033
- Figure 3: North America Next Generation Biometrics Market Revenue (billion), by Type of Solution 2025 & 2033
- Figure 4: North America Next Generation Biometrics Market Volume (K Unit), by Type of Solution 2025 & 2033
- Figure 5: North America Next Generation Biometrics Market Revenue Share (%), by Type of Solution 2025 & 2033
- Figure 6: North America Next Generation Biometrics Market Volume Share (%), by Type of Solution 2025 & 2033
- Figure 7: North America Next Generation Biometrics Market Revenue (billion), by End-user Vertical 2025 & 2033
- Figure 8: North America Next Generation Biometrics Market Volume (K Unit), by End-user Vertical 2025 & 2033
- Figure 9: North America Next Generation Biometrics Market Revenue Share (%), by End-user Vertical 2025 & 2033
- Figure 10: North America Next Generation Biometrics Market Volume Share (%), by End-user Vertical 2025 & 2033
- Figure 11: North America Next Generation Biometrics Market Revenue (billion), by Country 2025 & 2033
- Figure 12: North America Next Generation Biometrics Market Volume (K Unit), by Country 2025 & 2033
- Figure 13: North America Next Generation Biometrics Market Revenue Share (%), by Country 2025 & 2033
- Figure 14: North America Next Generation Biometrics Market Volume Share (%), by Country 2025 & 2033
- Figure 15: Europe Next Generation Biometrics Market Revenue (billion), by Type of Solution 2025 & 2033
- Figure 16: Europe Next Generation Biometrics Market Volume (K Unit), by Type of Solution 2025 & 2033
- Figure 17: Europe Next Generation Biometrics Market Revenue Share (%), by Type of Solution 2025 & 2033
- Figure 18: Europe Next Generation Biometrics Market Volume Share (%), by Type of Solution 2025 & 2033
- Figure 19: Europe Next Generation Biometrics Market Revenue (billion), by End-user Vertical 2025 & 2033
- Figure 20: Europe Next Generation Biometrics Market Volume (K Unit), by End-user Vertical 2025 & 2033
- Figure 21: Europe Next Generation Biometrics Market Revenue Share (%), by End-user Vertical 2025 & 2033
- Figure 22: Europe Next Generation Biometrics Market Volume Share (%), by End-user Vertical 2025 & 2033
- Figure 23: Europe Next Generation Biometrics Market Revenue (billion), by Country 2025 & 2033
- Figure 24: Europe Next Generation Biometrics Market Volume (K Unit), by Country 2025 & 2033
- Figure 25: Europe Next Generation Biometrics Market Revenue Share (%), by Country 2025 & 2033
- Figure 26: Europe Next Generation Biometrics Market Volume Share (%), by Country 2025 & 2033
- Figure 27: Asia Pacific Next Generation Biometrics Market Revenue (billion), by Type of Solution 2025 & 2033
- Figure 28: Asia Pacific Next Generation Biometrics Market Volume (K Unit), by Type of Solution 2025 & 2033
- Figure 29: Asia Pacific Next Generation Biometrics Market Revenue Share (%), by Type of Solution 2025 & 2033
- Figure 30: Asia Pacific Next Generation Biometrics Market Volume Share (%), by Type of Solution 2025 & 2033
- Figure 31: Asia Pacific Next Generation Biometrics Market Revenue (billion), by End-user Vertical 2025 & 2033
- Figure 32: Asia Pacific Next Generation Biometrics Market Volume (K Unit), by End-user Vertical 2025 & 2033
- Figure 33: Asia Pacific Next Generation Biometrics Market Revenue Share (%), by End-user Vertical 2025 & 2033
- Figure 34: Asia Pacific Next Generation Biometrics Market Volume Share (%), by End-user Vertical 2025 & 2033
- Figure 35: Asia Pacific Next Generation Biometrics Market Revenue (billion), by Country 2025 & 2033
- Figure 36: Asia Pacific Next Generation Biometrics Market Volume (K Unit), by Country 2025 & 2033
- Figure 37: Asia Pacific Next Generation Biometrics Market Revenue Share (%), by Country 2025 & 2033
- Figure 38: Asia Pacific Next Generation Biometrics Market Volume Share (%), by Country 2025 & 2033
- Figure 39: Middle East Next Generation Biometrics Market Revenue (billion), by Type of Solution 2025 & 2033
- Figure 40: Middle East Next Generation Biometrics Market Volume (K Unit), by Type of Solution 2025 & 2033
- Figure 41: Middle East Next Generation Biometrics Market Revenue Share (%), by Type of Solution 2025 & 2033
- Figure 42: Middle East Next Generation Biometrics Market Volume Share (%), by Type of Solution 2025 & 2033
- Figure 43: Middle East Next Generation Biometrics Market Revenue (billion), by End-user Vertical 2025 & 2033
- Figure 44: Middle East Next Generation Biometrics Market Volume (K Unit), by End-user Vertical 2025 & 2033
- Figure 45: Middle East Next Generation Biometrics Market Revenue Share (%), by End-user Vertical 2025 & 2033
- Figure 46: Middle East Next Generation Biometrics Market Volume Share (%), by End-user Vertical 2025 & 2033
- Figure 47: Middle East Next Generation Biometrics Market Revenue (billion), by Country 2025 & 2033
- Figure 48: Middle East Next Generation Biometrics Market Volume (K Unit), by Country 2025 & 2033
- Figure 49: Middle East Next Generation Biometrics Market Revenue Share (%), by Country 2025 & 2033
- Figure 50: Middle East Next Generation Biometrics Market Volume Share (%), by Country 2025 & 2033
- Figure 51: Latin America Next Generation Biometrics Market Revenue (billion), by Type of Solution 2025 & 2033
- Figure 52: Latin America Next Generation Biometrics Market Volume (K Unit), by Type of Solution 2025 & 2033
- Figure 53: Latin America Next Generation Biometrics Market Revenue Share (%), by Type of Solution 2025 & 2033
- Figure 54: Latin America Next Generation Biometrics Market Volume Share (%), by Type of Solution 2025 & 2033
- Figure 55: Latin America Next Generation Biometrics Market Revenue (billion), by End-user Vertical 2025 & 2033
- Figure 56: Latin America Next Generation Biometrics Market Volume (K Unit), by End-user Vertical 2025 & 2033
- Figure 57: Latin America Next Generation Biometrics Market Revenue Share (%), by End-user Vertical 2025 & 2033
- Figure 58: Latin America Next Generation Biometrics Market Volume Share (%), by End-user Vertical 2025 & 2033
- Figure 59: Latin America Next Generation Biometrics Market Revenue (billion), by Country 2025 & 2033
- Figure 60: Latin America Next Generation Biometrics Market Volume (K Unit), by Country 2025 & 2033
- Figure 61: Latin America Next Generation Biometrics Market Revenue Share (%), by Country 2025 & 2033
- Figure 62: Latin America Next Generation Biometrics Market Volume Share (%), by Country 2025 & 2033
List of Tables
- Table 1: Global Next Generation Biometrics Market Revenue billion Forecast, by Type of Solution 2020 & 2033
- Table 2: Global Next Generation Biometrics Market Volume K Unit Forecast, by Type of Solution 2020 & 2033
- Table 3: Global Next Generation Biometrics Market Revenue billion Forecast, by End-user Vertical 2020 & 2033
- Table 4: Global Next Generation Biometrics Market Volume K Unit Forecast, by End-user Vertical 2020 & 2033
- Table 5: Global Next Generation Biometrics Market Revenue billion Forecast, by Region 2020 & 2033
- Table 6: Global Next Generation Biometrics Market Volume K Unit Forecast, by Region 2020 & 2033
- Table 7: Global Next Generation Biometrics Market Revenue billion Forecast, by Type of Solution 2020 & 2033
- Table 8: Global Next Generation Biometrics Market Volume K Unit Forecast, by Type of Solution 2020 & 2033
- Table 9: Global Next Generation Biometrics Market Revenue billion Forecast, by End-user Vertical 2020 & 2033
- Table 10: Global Next Generation Biometrics Market Volume K Unit Forecast, by End-user Vertical 2020 & 2033
- Table 11: Global Next Generation Biometrics Market Revenue billion Forecast, by Country 2020 & 2033
- Table 12: Global Next Generation Biometrics Market Volume K Unit Forecast, by Country 2020 & 2033
- Table 13: Global Next Generation Biometrics Market Revenue billion Forecast, by Type of Solution 2020 & 2033
- Table 14: Global Next Generation Biometrics Market Volume K Unit Forecast, by Type of Solution 2020 & 2033
- Table 15: Global Next Generation Biometrics Market Revenue billion Forecast, by End-user Vertical 2020 & 2033
- Table 16: Global Next Generation Biometrics Market Volume K Unit Forecast, by End-user Vertical 2020 & 2033
- Table 17: Global Next Generation Biometrics Market Revenue billion Forecast, by Country 2020 & 2033
- Table 18: Global Next Generation Biometrics Market Volume K Unit Forecast, by Country 2020 & 2033
- Table 19: Global Next Generation Biometrics Market Revenue billion Forecast, by Type of Solution 2020 & 2033
- Table 20: Global Next Generation Biometrics Market Volume K Unit Forecast, by Type of Solution 2020 & 2033
- Table 21: Global Next Generation Biometrics Market Revenue billion Forecast, by End-user Vertical 2020 & 2033
- Table 22: Global Next Generation Biometrics Market Volume K Unit Forecast, by End-user Vertical 2020 & 2033
- Table 23: Global Next Generation Biometrics Market Revenue billion Forecast, by Country 2020 & 2033
- Table 24: Global Next Generation Biometrics Market Volume K Unit Forecast, by Country 2020 & 2033
- Table 25: Global Next Generation Biometrics Market Revenue billion Forecast, by Type of Solution 2020 & 2033
- Table 26: Global Next Generation Biometrics Market Volume K Unit Forecast, by Type of Solution 2020 & 2033
- Table 27: Global Next Generation Biometrics Market Revenue billion Forecast, by End-user Vertical 2020 & 2033
- Table 28: Global Next Generation Biometrics Market Volume K Unit Forecast, by End-user Vertical 2020 & 2033
- Table 29: Global Next Generation Biometrics Market Revenue billion Forecast, by Country 2020 & 2033
- Table 30: Global Next Generation Biometrics Market Volume K Unit Forecast, by Country 2020 & 2033
- Table 31: Global Next Generation Biometrics Market Revenue billion Forecast, by Type of Solution 2020 & 2033
- Table 32: Global Next Generation Biometrics Market Volume K Unit Forecast, by Type of Solution 2020 & 2033
- Table 33: Global Next Generation Biometrics Market Revenue billion Forecast, by End-user Vertical 2020 & 2033
- Table 34: Global Next Generation Biometrics Market Volume K Unit Forecast, by End-user Vertical 2020 & 2033
- Table 35: Global Next Generation Biometrics Market Revenue billion Forecast, by Country 2020 & 2033
- Table 36: Global Next Generation Biometrics Market Volume K Unit Forecast, by Country 2020 & 2033
Frequently Asked Questions
1. What is the projected Compound Annual Growth Rate (CAGR) of the Next Generation Biometrics Market?
The projected CAGR is approximately 17.6%.
2. Which companies are prominent players in the Next Generation Biometrics Market?
Key companies in the market include RCG Holdings Limited, Suprema Inc, Fujitsu Ltd, Thales Group, Safran SA, Siemens AG, Fingerprint Cards AB, NEC Corporation, Cross Match Technologies, IDEMIA.
3. What are the main segments of the Next Generation Biometrics Market?
The market segments include Type of Solution, End-user Vertical.
4. Can you provide details about the market size?
The market size is estimated to be USD 43.34 billion as of 2022.
5. What are some drivers contributing to market growth?
Inclination of Growth toward E-Passport Program; Integration of Biometrics in Smartphones Driving Growth.
6. What are the notable trends driving market growth?
Banking and Financial Industry to be the Fastest Growing Sector.
7. Are there any restraints impacting market growth?
Fear of Privacy Invasion Challenging Growth; High Initial Cost of Systems Restricting Growth.
8. Can you provide examples of recent developments in the market?
June 2022: Vision-Box presented its latest solution Seamless Kiosk, which is based on a new generation of biometric innovation and is intended to revolutionize the traveling experience.
9. What pricing options are available for accessing the report?
Pricing options include single-user, multi-user, and enterprise licenses priced at USD 4750, USD 5250, and USD 8750 respectively.
10. Is the market size provided in terms of value or volume?
The market size is provided in terms of value, measured in billion and volume, measured in K Unit.
11. Are there any specific market keywords associated with the report?
Yes, the market keyword associated with the report is "Next Generation Biometrics Market," which aids in identifying and referencing the specific market segment covered.
12. How do I determine which pricing option suits my needs best?
The pricing options vary based on user requirements and access needs. Individual users may opt for single-user licenses, while businesses requiring broader access may choose multi-user or enterprise licenses for cost-effective access to the report.
13. Are there any additional resources or data provided in the Next Generation Biometrics Market report?
While the report offers comprehensive insights, it's advisable to review the specific contents or supplementary materials provided to ascertain if additional resources or data are available.
14. How can I stay updated on further developments or reports in the Next Generation Biometrics Market?
To stay informed about further developments, trends, and reports in the Next Generation Biometrics Market, consider subscribing to industry newsletters, following relevant companies and organizations, or regularly checking reputable industry news sources and publications.
Methodology
Step 1 - Identification of Relevant Samples Size from Population Database


Step 2 - Approaches for Defining Global Market Size (Value, Volume* & Price*)

Note*: In applicable scenarios
Step 3 - Data Sources
Primary Research
- Web Analytics
- Survey Reports
- Research Institute
- Latest Research Reports
- Opinion Leaders
Secondary Research
- Annual Reports
- White Paper
- Latest Press Release
- Industry Association
- Paid Database
- Investor Presentations

Step 4 - Data Triangulation
Involves using different sources of information in order to increase the validity of a study
These sources are likely to be stakeholders in a program - participants, other researchers, program staff, other community members, and so on.
Then we put all data in single framework & apply various statistical tools to find out the dynamic on the market.
During the analysis stage, feedback from the stakeholder groups would be compared to determine areas of agreement as well as areas of divergence