

Key Insights
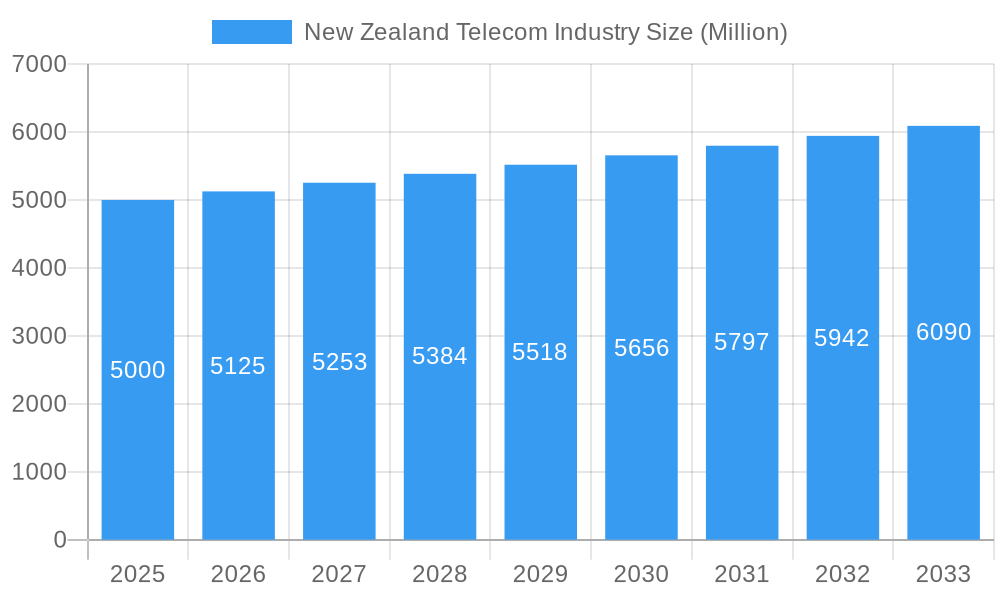
The New Zealand telecommunications market is poised for robust expansion, projected to reach $3.4 billion by 2025, with an anticipated Compound Annual Growth Rate (CAGR) of 1.2% through 2033. This sustained growth is propelled by escalating demand for high-speed internet, driven by the proliferation of streaming services, the widespread adoption of remote work models, and the increasing integration of smart devices into daily life. Key market drivers include the ongoing deployment of 5G networks, the strategic expansion of fiber optic infrastructure by entities such as Tuatahi First Fibre and Crown Infrastructure Partners, and intensified competition among industry leaders including Spark New Zealand, Vodafone New Zealand, and Chorus. Despite these positive advancements, the market confronts persistent challenges, notably significant infrastructure investment outlays, the imperative for efficient spectrum management, and the continued competitive pressure from Over-The-Top (OTT) services on traditional voice and Pay-TV revenues. The market is segmented into Voice, Wireless Data & Messaging (encompassing internet and mobile data plans), and OTT & Pay-TV services, each presenting distinct growth prospects and hurdles. Average Revenue Per User (ARPU) will be a critical metric for assessing segment profitability, influenced by competitive pricing strategies and evolving consumer preferences. Substantial infrastructure investments are expected to bolster data service growth, partially counteracting anticipated declines in traditional voice services.
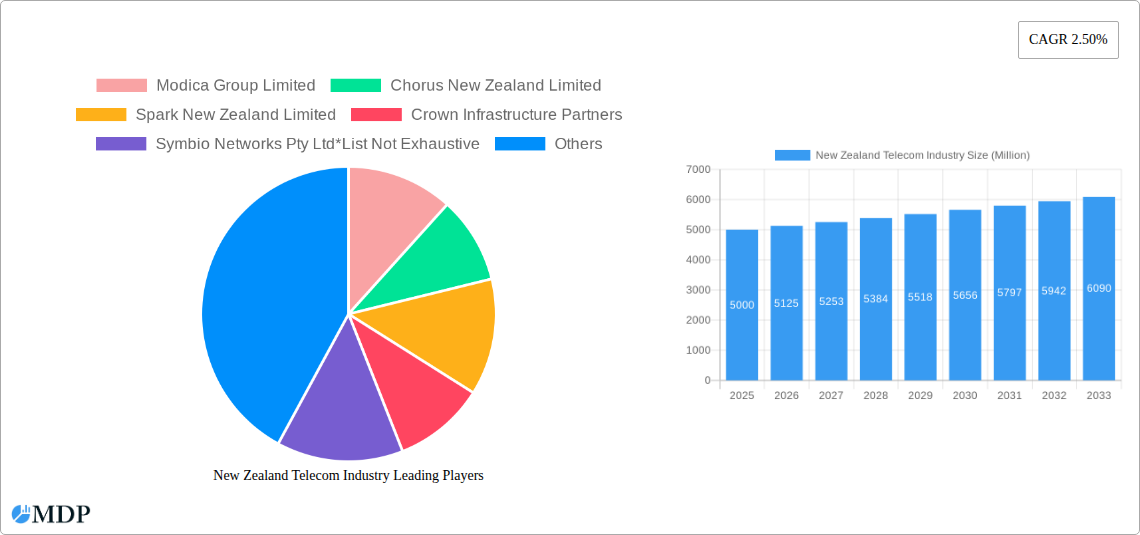
New Zealand Telecom Industry Market Size (In Billion)
The competitive arena is dominated by established players such as Spark, Vodafone, and Chorus, alongside emerging contenders like Two Degrees Mobile and Vocus Group, and vital infrastructure providers including Crown Infrastructure Partners and Symbio Networks. Sustained success for these companies hinges on their capacity for innovation, competitive pricing structures, and agile adaptation to dynamic customer requirements. A paramount focus will be placed on delivering superior customer experiences, curating innovative data packages, and making strategic investments in next-generation technologies to maintain a competitive edge. Furthermore, governmental regulations and policies pertaining to infrastructure investment and spectrum allocation will significantly shape the future trajectory of this evolving market.
New Zealand Telecom Industry Company Market Share
New Zealand Telecom Industry Report: 2019-2033 Forecast
This comprehensive report provides an in-depth analysis of the New Zealand telecom industry, covering market dynamics, key players, technological advancements, and future growth prospects. With a study period spanning 2019-2033, a base year of 2025, and a forecast period of 2025-2033, this report offers invaluable insights for industry stakeholders, investors, and strategic planners. The report leverages high-quality data and rigorous analysis to deliver actionable intelligence on a market valued at xx Million in 2025, projected to reach xx Million by 2033.
New Zealand Telecom Industry Market Dynamics & Concentration
The New Zealand telecom market is characterized by a moderate level of concentration, with several major players vying for market share. Spark New Zealand Limited, Vodafone New Zealand Limited, and Two Degrees Mobile Limited dominate the mobile market, while Chorus New Zealand Limited plays a crucial role in fixed-line infrastructure. The market is subject to a robust regulatory framework overseen by the Commerce Commission, which aims to promote competition and consumer protection. Innovation is a key driver, with ongoing investments in 5G and emerging technologies shaping future market dynamics. The historical period (2019-2024) witnessed xx M&A deals, while the forecast period is expected to see a further xx deals driven by consolidation and expansion strategies. Product substitution, primarily from Over-The-Top (OTT) services, poses a significant challenge to traditional telecom providers. End-user trends indicate a growing demand for higher data speeds, seamless connectivity, and bundled services.
- Market Concentration: Spark and Vodafone hold approximately xx% combined market share.
- M&A Activity: xx major deals completed between 2019-2024.
- Regulatory Framework: Commerce Commission actively monitors competition and pricing.
- Innovation Drivers: 5G deployment, fiber optic expansion, and technological advancements.
- Product Substitutes: OTT services like Netflix and Spotify impacting traditional offerings.
- End-User Trends: Increasing demand for high-speed data, bundled packages, and improved customer service.
New Zealand Telecom Industry Industry Trends & Analysis
The New Zealand telecom industry exhibits a robust growth trajectory, driven by increasing smartphone penetration, rising data consumption, and government initiatives promoting digital infrastructure development. The Compound Annual Growth Rate (CAGR) for the overall market is estimated at xx% during the forecast period (2025-2033). Market penetration of mobile broadband is currently at approximately xx%, with considerable scope for future expansion. Technological disruptions like the adoption of 5G, the expansion of fiber-optic networks, and the rise of IoT devices are fundamentally reshaping the competitive landscape and fostering innovation. Consumer preferences are shifting towards affordable data plans, bundled services, and personalized offerings. Competitive dynamics are intensifying, with players vying for market share through aggressive pricing strategies, service innovation, and strategic partnerships.
Leading Markets & Segments in New Zealand Telecom Industry
The wireless data and messaging segment is the leading revenue generator in the New Zealand telecom industry, driven by the increasing adoption of smartphones and the growing demand for high-speed mobile internet access. Average Revenue Per User (ARPU) for the overall services segment is estimated at xx dollars per month in 2025. Other key segments include voice services and OTT/Pay-TV services. Key drivers for segment dominance include:
- Wireless: Data and Messaging Services: High smartphone penetration, increasing data consumption, and demand for faster speeds.
- Voice Services: While declining, still a significant revenue stream, particularly in business-to-business communications.
- OTT and Pay-TV Services: Growing competition from international players and increasing demand for streaming services.
Market size estimates for each segment in 2025:
- Wireless Data and Messaging: xx Million
- Voice Services: xx Million
- OTT and Pay-TV Services: xx Million
New Zealand Telecom Industry Product Developments
The New Zealand telecom industry is witnessing significant product innovation, driven by the rollout of 5G networks and the increasing integration of IoT devices. New service offerings focus on providing seamless connectivity across various devices and platforms, offering increased speeds, capacity, and more reliable connections. Competitive advantages are based on network infrastructure investments, service differentiation, bundled packages, and robust customer support. The ongoing evolution of 5G and the emergence of 6G represent significant technological trends, promising improved speeds, low latency, and enhanced capabilities in areas such as telehealth, autonomous driving, and advanced manufacturing.
Key Drivers of New Zealand Telecom Industry Growth
Growth in the New Zealand telecom industry is driven by several key factors. Technological advancements such as 5G and fiber-optic network expansions are significantly improving network infrastructure and capacity. Increasing smartphone penetration and growing data consumption are boosting demand for mobile broadband services. Government initiatives focused on developing digital infrastructure and promoting a digital economy are further enhancing growth opportunities. Economic growth and rising disposable incomes are also fueling demand for telecommunications services, contributing to a positive growth environment.
Challenges in the New Zealand Telecom Industry Market
The New Zealand telecom industry faces several significant challenges. Stringent regulatory requirements can limit pricing flexibility and hinder market entry for new players. Supply chain disruptions can impact the deployment of new technologies and network infrastructure. Intense competition from established players and new entrants is putting pressure on profitability. These challenges collectively impact the industry's ability to maximize revenue and profitability, requiring businesses to implement strategic responses to mitigate these risks. Increased infrastructure costs also presents a substantial challenge.
Emerging Opportunities in New Zealand Telecom Industry
Significant long-term growth opportunities exist within the New Zealand telecom industry. The continued rollout of 5G and the potential for 6G will create opportunities for innovative service offerings in areas like IoT, smart cities, and industrial automation. Strategic partnerships with technology companies and the development of value-added services will enhance revenue streams. Expansion into underserved rural areas and the deployment of advanced network infrastructure will create new market opportunities for growth and expansion in underserved areas.
Leading Players in the New Zealand Telecom Industry Sector
- Modica Group Limited
- Chorus New Zealand Limited
- Spark New Zealand Limited
- Crown Infrastructure Partners
- Symbio Networks Pty Ltd
- Two Degrees Mobile Limited
- Vodafone New Zealand Limited
- Vocus Group Limited
- Tuatahi First Fibre
- Compass NZ
Key Milestones in New Zealand Telecom Industry Industry
- August 2022: Spark successfully tested the first end-to-end 5G standalone network in New Zealand, involving Mavenir, AWS, Nokia, and Oppo. This signifies a significant step towards widespread 5G adoption.
- September 2022: Vodafone New Zealand partnered with Nokia to accelerate 6G and 5G-Advanced network innovation, strengthening their long-term collaboration. This agreement is pivotal for developing future-proof network technologies.
Strategic Outlook for New Zealand Telecom Industry Market
The New Zealand telecom industry's future is bright. Continued investment in 5G and future technologies will drive significant growth, unlocking new opportunities for innovation and value creation. Strategic partnerships, diversification of service offerings, and focus on customer experience will be crucial for success. The market's potential lies in leveraging technological advancements to deliver enhanced connectivity, seamless integration, and innovative solutions across diverse sectors, further propelling economic growth and development in New Zealand.
New Zealand Telecom Industry Segmentation
-
1. Segmenta
-
1.1. Voice Services
- 1.1.1. Wired
- 1.1.2. Wireless
- 1.2. Data and
- 1.3. OTT and Pay-TV Services
-
1.1. Voice Services
New Zealand Telecom Industry Segmentation By Geography
- 1. New Zealand
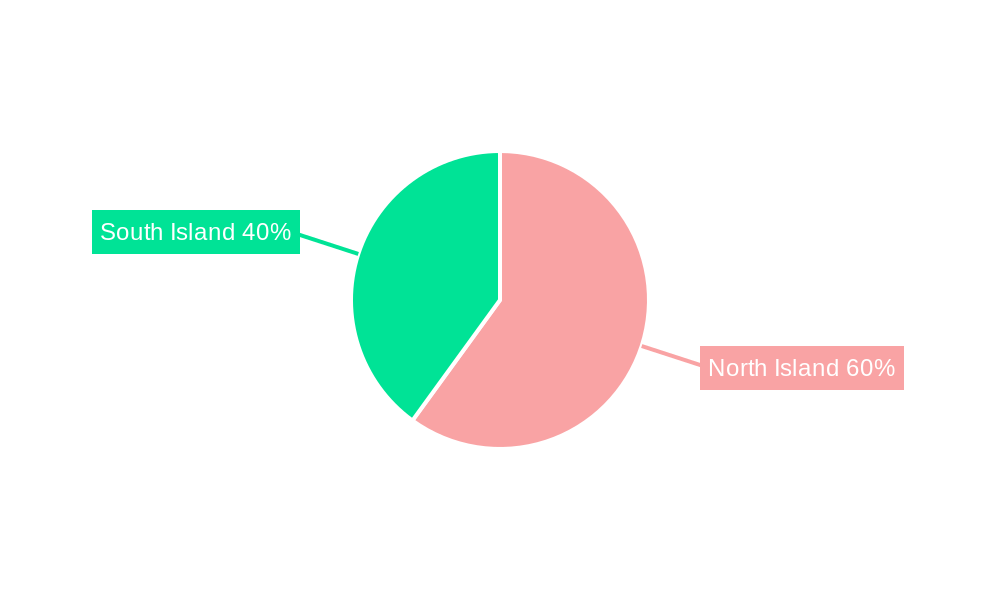
New Zealand Telecom Industry Regional Market Share
Geographic Coverage of New Zealand Telecom Industry
New Zealand Telecom Industry REPORT HIGHLIGHTS
| Aspects | Details |
|---|---|
| Study Period | 2020-2034 |
| Base Year | 2025 |
| Estimated Year | 2026 |
| Forecast Period | 2026-2034 |
| Historical Period | 2020-2025 |
| Growth Rate | CAGR of 1.2% from 2020-2034 |
| Segmentation |
|
Table of Contents
- 1. Introduction
- 1.1. Research Scope
- 1.2. Market Segmentation
- 1.3. Research Objective
- 1.4. Definitions and Assumptions
- 2. Executive Summary
- 2.1. Market Snapshot
- 3. Market Dynamics
- 3.1. Market Drivers
- 3.2. Market Restrains
- 3.3. Market Trends
- 3.4. Market Opportunities
- 4. Market Factor Analysis
- 4.1. Porters Five Forces
- 4.1.1. Bargaining Power of Suppliers
- 4.1.2. Bargaining Power of Buyers
- 4.1.3. Threat of New Entrants
- 4.1.4. Threat of Substitutes
- 4.1.5. Competitive Rivalry
- 4.2. PESTEL analysis
- 4.3. BCG Analysis
- 4.3.1. Stars (High Growth, High Market Share)
- 4.3.2. Cash Cows (Low Growth, High Market Share)
- 4.3.3. Question Mark (High Growth, Low Market Share)
- 4.3.4. Dogs (Low Growth, Low Market Share)
- 4.4. Ansoff Matrix Analysis
- 4.5. Supply Chain Analysis
- 4.6. Regulatory Landscape
- 4.7. Current Market Potential and Opportunity Assessment (TAM–SAM–SOM Framework)
- 4.8. MDP Analyst Note
- 4.1. Porters Five Forces
- 5. Market Analysis, Insights and Forecast 2021-2033
- 5.1. Market Analysis, Insights and Forecast - by Segmenta
- 5.1.1. Voice Services
- 5.1.1.1. Wired
- 5.1.1.2. Wireless
- 5.1.2. Data and
- 5.1.3. OTT and Pay-TV Services
- 5.1.1. Voice Services
- 5.2. Market Analysis, Insights and Forecast - by Region
- 5.2.1. New Zealand
- 5.1. Market Analysis, Insights and Forecast - by Segmenta
- 6. New Zealand Telecom Industry Analysis, Insights and Forecast, 2021-2033
- 6.1. Market Analysis, Insights and Forecast - by Segmenta
- 6.1.1. Voice Services
- 6.1.1.1. Wired
- 6.1.1.2. Wireless
- 6.1.2. Data and
- 6.1.3. OTT and Pay-TV Services
- 6.1.1. Voice Services
- 6.1. Market Analysis, Insights and Forecast - by Segmenta
- 7. Competitive Analysis
- 7.1. Company Profiles
- 7.1.1 Modica Group Limited
- 7.1.1.1. Company Overview
- 7.1.1.2. Products
- 7.1.1.3. Company Financials
- 7.1.1.4. SWOT Analysis
- 7.1.2 Chorus New Zealand Limited
- 7.1.2.1. Company Overview
- 7.1.2.2. Products
- 7.1.2.3. Company Financials
- 7.1.2.4. SWOT Analysis
- 7.1.3 Spark New Zealand Limited
- 7.1.3.1. Company Overview
- 7.1.3.2. Products
- 7.1.3.3. Company Financials
- 7.1.3.4. SWOT Analysis
- 7.1.4 Crown Infrastructure Partners
- 7.1.4.1. Company Overview
- 7.1.4.2. Products
- 7.1.4.3. Company Financials
- 7.1.4.4. SWOT Analysis
- 7.1.5 Symbio Networks Pty Ltd*List Not Exhaustive
- 7.1.5.1. Company Overview
- 7.1.5.2. Products
- 7.1.5.3. Company Financials
- 7.1.5.4. SWOT Analysis
- 7.1.6 Two Degrees Mobile Limited
- 7.1.6.1. Company Overview
- 7.1.6.2. Products
- 7.1.6.3. Company Financials
- 7.1.6.4. SWOT Analysis
- 7.1.7 Vodafone New Zealand Limited
- 7.1.7.1. Company Overview
- 7.1.7.2. Products
- 7.1.7.3. Company Financials
- 7.1.7.4. SWOT Analysis
- 7.1.8 Vocus Group Limited
- 7.1.8.1. Company Overview
- 7.1.8.2. Products
- 7.1.8.3. Company Financials
- 7.1.8.4. SWOT Analysis
- 7.1.9 Tuatahi First Fibre
- 7.1.9.1. Company Overview
- 7.1.9.2. Products
- 7.1.9.3. Company Financials
- 7.1.9.4. SWOT Analysis
- 7.1.10 Compass NZ
- 7.1.10.1. Company Overview
- 7.1.10.2. Products
- 7.1.10.3. Company Financials
- 7.1.10.4. SWOT Analysis
- 7.1.1 Modica Group Limited
- 7.2. Market Entropy
- 7.2.1 Company's Key Areas Served
- 7.2.2 Recent Developments
- 7.3. Company Market Share Analysis 2025
- 7.3.1 Top 5 Companies Market Share Analysis
- 7.3.2 Top 3 Companies Market Share Analysis
- 7.4. List of Potential Customers
- 8. Research Methodology
List of Figures
- Figure 1: New Zealand Telecom Industry Revenue Breakdown (billion, %) by Product 2025 & 2033
- Figure 2: New Zealand Telecom Industry Share (%) by Company 2025
List of Tables
- Table 1: New Zealand Telecom Industry Revenue billion Forecast, by Segmenta 2020 & 2033
- Table 2: New Zealand Telecom Industry Revenue billion Forecast, by Region 2020 & 2033
- Table 3: New Zealand Telecom Industry Revenue billion Forecast, by Segmenta 2020 & 2033
- Table 4: New Zealand Telecom Industry Revenue billion Forecast, by Country 2020 & 2033
Frequently Asked Questions
1. What is the projected Compound Annual Growth Rate (CAGR) of the New Zealand Telecom Industry?
The projected CAGR is approximately 1.2%.
2. Which companies are prominent players in the New Zealand Telecom Industry?
Key companies in the market include Modica Group Limited, Chorus New Zealand Limited, Spark New Zealand Limited, Crown Infrastructure Partners, Symbio Networks Pty Ltd*List Not Exhaustive, Two Degrees Mobile Limited, Vodafone New Zealand Limited, Vocus Group Limited, Tuatahi First Fibre, Compass NZ.
3. What are the main segments of the New Zealand Telecom Industry?
The market segments include Segmenta.
4. Can you provide details about the market size?
The market size is estimated to be USD 3.4 billion as of 2022.
5. What are some drivers contributing to market growth?
Growing Market for OTT; Investment on Rural Connectivity.
6. What are the notable trends driving market growth?
Growing Market of OTT.
7. Are there any restraints impacting market growth?
Rigid Competition in the Market.
8. Can you provide examples of recent developments in the market?
August 2022: Spark tested the first end-to-end 5G standalone network in New Zealand. Technology companies Mavenir, AWS, Nokia, and Oppo, have participated in the testing. Such development would be significant for telecommunications businesses in New Zealand, where operators are now rolling out 5G networks. However, data centers and network cores still use 4G infrastructure and older technologies.
9. What pricing options are available for accessing the report?
Pricing options include single-user, multi-user, and enterprise licenses priced at USD 3800, USD 4500, and USD 5800 respectively.
10. Is the market size provided in terms of value or volume?
The market size is provided in terms of value, measured in billion.
11. Are there any specific market keywords associated with the report?
Yes, the market keyword associated with the report is "New Zealand Telecom Industry," which aids in identifying and referencing the specific market segment covered.
12. How do I determine which pricing option suits my needs best?
The pricing options vary based on user requirements and access needs. Individual users may opt for single-user licenses, while businesses requiring broader access may choose multi-user or enterprise licenses for cost-effective access to the report.
13. Are there any additional resources or data provided in the New Zealand Telecom Industry report?
While the report offers comprehensive insights, it's advisable to review the specific contents or supplementary materials provided to ascertain if additional resources or data are available.
14. How can I stay updated on further developments or reports in the New Zealand Telecom Industry?
To stay informed about further developments, trends, and reports in the New Zealand Telecom Industry, consider subscribing to industry newsletters, following relevant companies and organizations, or regularly checking reputable industry news sources and publications.
Methodology
Step 1 - Identification of Relevant Samples Size from Population Database


Step 2 - Approaches for Defining Global Market Size (Value, Volume* & Price*)

Note*: In applicable scenarios
Step 3 - Data Sources
Primary Research
- Web Analytics
- Survey Reports
- Research Institute
- Latest Research Reports
- Opinion Leaders
Secondary Research
- Annual Reports
- White Paper
- Latest Press Release
- Industry Association
- Paid Database
- Investor Presentations

Step 4 - Data Triangulation
Involves using different sources of information in order to increase the validity of a study
These sources are likely to be stakeholders in a program - participants, other researchers, program staff, other community members, and so on.
Then we put all data in single framework & apply various statistical tools to find out the dynamic on the market.
During the analysis stage, feedback from the stakeholder groups would be compared to determine areas of agreement as well as areas of divergence