

Key Insights
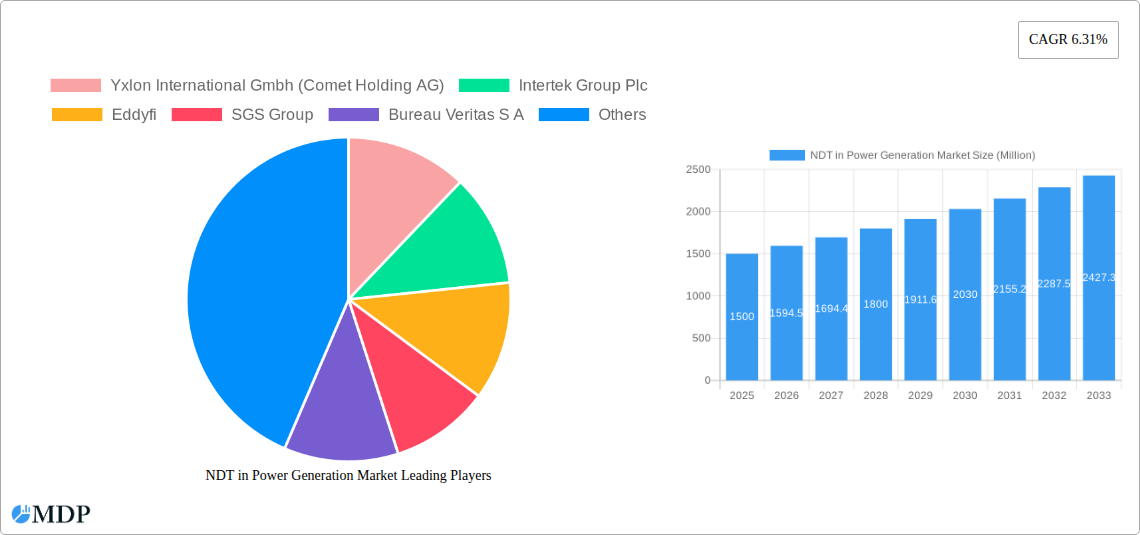
The Non-Destructive Testing (NDT) market in the power generation sector is poised for significant expansion, driven by the imperative for operational reliability and safety in aging infrastructure and the escalating deployment of renewable energy. The market, estimated at $4.18 billion in 2025, is projected to grow at a Compound Annual Growth Rate (CAGR) of 6.24% through 2033. This growth is underpinned by stringent inspection and maintenance regulations, the demand for enhanced operational efficiency and minimized downtime, and the widespread adoption of advanced NDT technologies such as ultrasonic and radiography testing. A growing emphasis on predictive maintenance to avert failures and extend asset life further fuels market expansion. While initial equipment investment may present a hurdle, the long-term cost savings and safety enhancements are compelling drivers. The market is segmented by NDT technology and service/equipment, with services leading due to specialized inspection and data analysis requirements. Key industry participants include Yxlon International GmbH, Intertek Group Plc, Eddyfi, SGS Group, and Bureau Veritas, who compete through innovation, service breadth, and global reach.
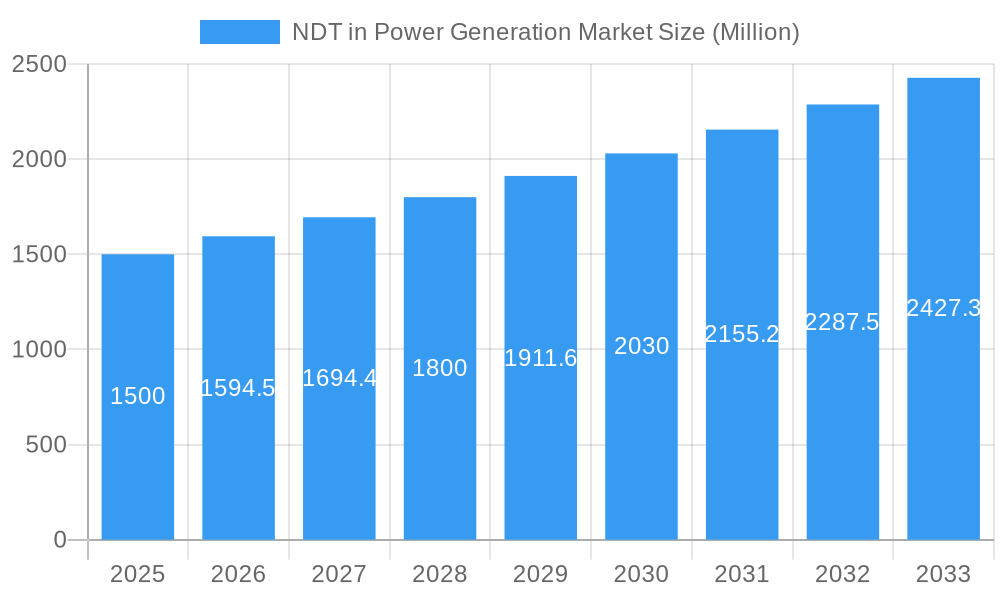
NDT in Power Generation Market Market Size (In Billion)
Geographically, the NDT power generation market is concentrated in North America and Europe due to established infrastructure and robust safety mandates. However, the Asia-Pacific region is exhibiting rapid growth, fueled by substantial power infrastructure investments and the surge in renewable energy adoption, particularly in China, India, and Japan. Latin America and the Middle East & Africa are also expected to see growth, albeit at a more measured pace, influenced by varying levels of infrastructure development and regulatory oversight. Future market dynamics will be shaped by advancements in NDT techniques, evolving regulations, and the global transition to cleaner energy sources.
NDT in Power Generation Market Company Market Share
NDT in Power Generation Market: A Comprehensive Report (2019-2033)
This comprehensive report provides a detailed analysis of the Non-Destructive Testing (NDT) market within the power generation sector, covering the period from 2019 to 2033. We delve into market dynamics, industry trends, leading players, and future growth opportunities, offering crucial insights for stakeholders across the NDT value chain. The report analyzes a market valued at xx Million in 2025, projected to reach xx Million by 2033, exhibiting a CAGR of xx% during the forecast period (2025-2033).
NDT in Power Generation Market Market Dynamics & Concentration
The NDT in power generation market is characterized by a moderately concentrated landscape, with several multinational corporations holding significant market share. The market share of the top five players is estimated at xx%, while smaller specialized firms and regional players also contribute significantly. Innovation, particularly in AI-driven inspection technologies, is a key driver, alongside stringent regulatory frameworks emphasizing safety and reliability within power generation assets. Product substitution is minimal, with existing technologies continuously being refined and enhanced rather than being completely replaced. End-user trends favor more efficient and accurate inspection methods, driven by the need to minimize downtime and optimize maintenance schedules. Mergers and acquisitions (M&A) activities are frequent, reflecting the industry's consolidation trend and the pursuit of enhanced technological capabilities and geographical reach. Between 2019 and 2024, approximately xx M&A deals were recorded in this sector.
- Market Concentration: Top 5 players hold xx% market share.
- Innovation Drivers: AI-powered inspection technologies, improved sensor technology, and automation.
- Regulatory Frameworks: Stringent safety and reliability standards driving demand for advanced NDT solutions.
- M&A Activity: xx deals between 2019-2024, indicative of market consolidation.
NDT in Power Generation Market Industry Trends & Analysis
The NDT in power generation market is experiencing robust growth, driven by factors such as the aging global power infrastructure, increasing demand for reliable energy sources, and the adoption of stringent safety regulations. Technological advancements, including the integration of artificial intelligence (AI) and advanced data analytics, are significantly enhancing inspection efficiency and accuracy. Furthermore, the rising adoption of renewable energy sources, like solar and wind power, is creating new opportunities for NDT services and equipment, as these technologies require regular and thorough inspections for optimal performance and safety. The market is witnessing a shift towards non-destructive testing services as companies seek more cost-effective solutions than purchasing equipment. Competitive dynamics are characterized by both intense competition among established players and the emergence of innovative startups offering niche solutions. Market penetration of AI-powered NDT solutions is estimated at xx% in 2025, projected to reach xx% by 2033.
Leading Markets & Segments in NDT in Power Generation Market
The North American and European regions are currently the dominant markets for NDT in power generation, driven by mature power infrastructure and stringent regulatory environments. Within testing technologies, ultrasonic testing and radiography testing hold the largest market shares, followed by eddy current testing and visual inspection testing. The services segment dominates the market, driven by increasing outsourcing of NDT activities by power generation companies.
Key Drivers:
- North America: Stringent safety regulations, aging infrastructure, and robust industrial base.
- Europe: High concentration of power plants and strong environmental regulations.
- Services Segment: Cost-effectiveness and specialized expertise.
- Ultrasonic & Radiography Testing: Established technologies with proven reliability and wide applicability.
Dominance Analysis: North America currently holds the largest market share, benefiting from extensive power generation capacity and a focus on proactive maintenance. This dominance is expected to continue through the forecast period. However, the Asia-Pacific region is demonstrating significant growth potential driven by rapid infrastructural development.
NDT in Power Generation Market Product Developments
Recent product developments focus on enhancing the speed, accuracy, and efficiency of NDT processes. The integration of AI and machine learning is enabling automated defect detection and analysis, reducing human error and improving inspection turnaround times. Portable and remotely operated NDT equipment is gaining traction, allowing for more efficient inspection of hard-to-reach areas. These advancements cater to the market’s increasing demands for faster inspections and minimized downtime.
Key Drivers of NDT in Power Generation Market Growth
The growth of the NDT in power generation market is propelled by several key factors:
- Aging Infrastructure: The need for regular inspection and maintenance of aging power plants worldwide.
- Stringent Safety Regulations: Increasingly strict regulatory standards demanding thorough and reliable inspections.
- Technological Advancements: The development of advanced NDT technologies with improved accuracy and efficiency, including AI integration.
- Rising Renewable Energy Adoption: The growing need for inspections of new renewable energy infrastructure.
Challenges in the NDT in Power Generation Market Market
The market faces challenges such as:
- High Initial Investment Costs: Advanced NDT equipment can be expensive, limiting adoption by smaller companies.
- Skilled Labor Shortages: The need for qualified personnel to operate and interpret NDT results.
- Competitive Pressure: The presence of numerous established players and emerging startups.
- Supply Chain Disruptions: Potential delays in procurement of specialized components and equipment.
Emerging Opportunities in NDT in Power Generation Market
The market is poised for significant growth fueled by:
- AI-driven Automation: Increased adoption of AI for automated defect detection and analysis.
- Remote Inspection Technologies: Development of remote inspection capabilities to access challenging environments.
- Big Data Analytics: Using big data to analyze inspection data and predict potential failures.
- Expansion into Emerging Markets: Significant growth potential in developing economies with expanding power generation capacity.
Leading Players in the NDT in Power Generation Market Sector
Key Milestones in NDT in Power Generation Market Industry
- June 2022: ALEIA and Omexom launch AUTEND project, leveraging AI for faster nuclear power plant inspections. This signals a significant shift towards AI-driven NDT solutions.
- April 2021: IR Supplies and Services partners with Creative Electron, expanding NDT capabilities in the Canadian power generation market. This enhances the availability of high-standard inspection tools.
- March 2021: Applus+ acquires Inecosa and Adícora, bolstering its presence in power generation and renewable energy sectors. This acquisition signifies market consolidation and expansion in the renewable energy segment.
Strategic Outlook for NDT in Power Generation Market Market
The NDT in power generation market holds immense potential for growth, driven by technological advancements, increasing regulatory scrutiny, and the global expansion of power generation capacity. Strategic partnerships, focused R&D initiatives, and expansion into emerging markets will be crucial for companies seeking to capitalize on these opportunities. The integration of AI and IoT is set to revolutionize the industry, enabling predictive maintenance and optimizing inspection processes. The market’s long-term prospects remain highly positive, with sustained growth anticipated through 2033 and beyond.
NDT in Power Generation Market Segmentation
-
1. Type
- 1.1. Services
- 1.2. Equipment
-
2. Testing Technology
- 2.1. Radiography Testing
- 2.2. Ultrasonic Testing
- 2.3. Visual Inspection Testing
- 2.4. Eddy Current Testing
- 2.5. Other Testing Technologies
NDT in Power Generation Market Segmentation By Geography
-
1. North America
- 1.1. United States
- 1.2. Canada
-
2. Europe
- 2.1. United Kingdom
- 2.2. Germany
- 2.3. France
- 2.4. Rest of Europe
-
3. Asia Pacific
- 3.1. China
- 3.2. Japan
- 3.3. India
- 3.4. Rest of Asia Pacific
- 4. Latin America
- 5. Middle East and Africa
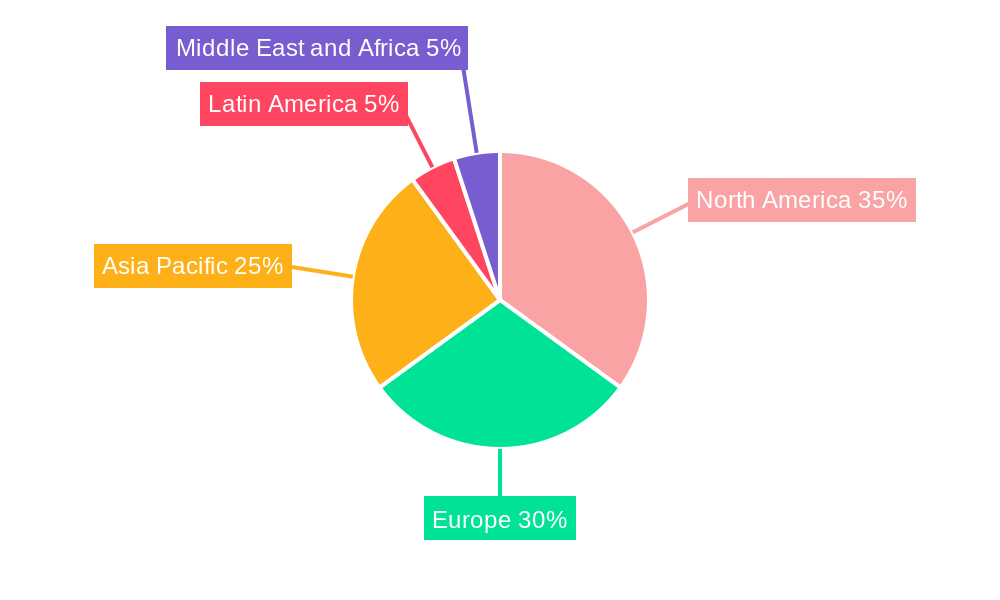
NDT in Power Generation Market Regional Market Share
Geographic Coverage of NDT in Power Generation Market
NDT in Power Generation Market REPORT HIGHLIGHTS
| Aspects | Details |
|---|---|
| Study Period | 2020-2034 |
| Base Year | 2025 |
| Estimated Year | 2026 |
| Forecast Period | 2026-2034 |
| Historical Period | 2020-2025 |
| Growth Rate | CAGR of 6.24% from 2020-2034 |
| Segmentation |
|
Table of Contents
- 1. Introduction
- 1.1. Research Scope
- 1.2. Market Segmentation
- 1.3. Research Objective
- 1.4. Definitions and Assumptions
- 2. Executive Summary
- 2.1. Market Snapshot
- 3. Market Dynamics
- 3.1. Market Drivers
- 3.2. Market Restrains
- 3.3. Market Trends
- 3.4. Market Opportunities
- 4. Market Factor Analysis
- 4.1. Porters Five Forces
- 4.1.1. Bargaining Power of Suppliers
- 4.1.2. Bargaining Power of Buyers
- 4.1.3. Threat of New Entrants
- 4.1.4. Threat of Substitutes
- 4.1.5. Competitive Rivalry
- 4.2. PESTEL analysis
- 4.3. BCG Analysis
- 4.3.1. Stars (High Growth, High Market Share)
- 4.3.2. Cash Cows (Low Growth, High Market Share)
- 4.3.3. Question Mark (High Growth, Low Market Share)
- 4.3.4. Dogs (Low Growth, Low Market Share)
- 4.4. Ansoff Matrix Analysis
- 4.5. Supply Chain Analysis
- 4.6. Regulatory Landscape
- 4.7. Current Market Potential and Opportunity Assessment (TAM–SAM–SOM Framework)
- 4.8. MDP Analyst Note
- 4.1. Porters Five Forces
- 5. Market Analysis, Insights and Forecast 2021-2033
- 5.1. Market Analysis, Insights and Forecast - by Type
- 5.1.1. Services
- 5.1.2. Equipment
- 5.2. Market Analysis, Insights and Forecast - by Testing Technology
- 5.2.1. Radiography Testing
- 5.2.2. Ultrasonic Testing
- 5.2.3. Visual Inspection Testing
- 5.2.4. Eddy Current Testing
- 5.2.5. Other Testing Technologies
- 5.3. Market Analysis, Insights and Forecast - by Region
- 5.3.1. North America
- 5.3.2. Europe
- 5.3.3. Asia Pacific
- 5.3.4. Latin America
- 5.3.5. Middle East and Africa
- 5.1. Market Analysis, Insights and Forecast - by Type
- 6. Global NDT in Power Generation Market Analysis, Insights and Forecast, 2021-2033
- 6.1. Market Analysis, Insights and Forecast - by Type
- 6.1.1. Services
- 6.1.2. Equipment
- 6.2. Market Analysis, Insights and Forecast - by Testing Technology
- 6.2.1. Radiography Testing
- 6.2.2. Ultrasonic Testing
- 6.2.3. Visual Inspection Testing
- 6.2.4. Eddy Current Testing
- 6.2.5. Other Testing Technologies
- 6.1. Market Analysis, Insights and Forecast - by Type
- 7. North America NDT in Power Generation Market Analysis, Insights and Forecast, 2020-2032
- 7.1. Market Analysis, Insights and Forecast - by Type
- 7.1.1. Services
- 7.1.2. Equipment
- 7.2. Market Analysis, Insights and Forecast - by Testing Technology
- 7.2.1. Radiography Testing
- 7.2.2. Ultrasonic Testing
- 7.2.3. Visual Inspection Testing
- 7.2.4. Eddy Current Testing
- 7.2.5. Other Testing Technologies
- 7.1. Market Analysis, Insights and Forecast - by Type
- 8. Europe NDT in Power Generation Market Analysis, Insights and Forecast, 2020-2032
- 8.1. Market Analysis, Insights and Forecast - by Type
- 8.1.1. Services
- 8.1.2. Equipment
- 8.2. Market Analysis, Insights and Forecast - by Testing Technology
- 8.2.1. Radiography Testing
- 8.2.2. Ultrasonic Testing
- 8.2.3. Visual Inspection Testing
- 8.2.4. Eddy Current Testing
- 8.2.5. Other Testing Technologies
- 8.1. Market Analysis, Insights and Forecast - by Type
- 9. Asia Pacific NDT in Power Generation Market Analysis, Insights and Forecast, 2020-2032
- 9.1. Market Analysis, Insights and Forecast - by Type
- 9.1.1. Services
- 9.1.2. Equipment
- 9.2. Market Analysis, Insights and Forecast - by Testing Technology
- 9.2.1. Radiography Testing
- 9.2.2. Ultrasonic Testing
- 9.2.3. Visual Inspection Testing
- 9.2.4. Eddy Current Testing
- 9.2.5. Other Testing Technologies
- 9.1. Market Analysis, Insights and Forecast - by Type
- 10. Latin America NDT in Power Generation Market Analysis, Insights and Forecast, 2020-2032
- 10.1. Market Analysis, Insights and Forecast - by Type
- 10.1.1. Services
- 10.1.2. Equipment
- 10.2. Market Analysis, Insights and Forecast - by Testing Technology
- 10.2.1. Radiography Testing
- 10.2.2. Ultrasonic Testing
- 10.2.3. Visual Inspection Testing
- 10.2.4. Eddy Current Testing
- 10.2.5. Other Testing Technologies
- 10.1. Market Analysis, Insights and Forecast - by Type
- 11. Middle East and Africa NDT in Power Generation Market Analysis, Insights and Forecast, 2020-2032
- 11.1. Market Analysis, Insights and Forecast - by Type
- 11.1.1. Services
- 11.1.2. Equipment
- 11.2. Market Analysis, Insights and Forecast - by Testing Technology
- 11.2.1. Radiography Testing
- 11.2.2. Ultrasonic Testing
- 11.2.3. Visual Inspection Testing
- 11.2.4. Eddy Current Testing
- 11.2.5. Other Testing Technologies
- 11.1. Market Analysis, Insights and Forecast - by Type
- 12. Competitive Analysis
- 12.1. Company Profiles
- 12.1.1 Yxlon International Gmbh (Comet Holding AG)
- 12.1.1.1. Company Overview
- 12.1.1.2. Products
- 12.1.1.3. Company Financials
- 12.1.1.4. SWOT Analysis
- 12.1.2 Intertek Group Plc
- 12.1.2.1. Company Overview
- 12.1.2.2. Products
- 12.1.2.3. Company Financials
- 12.1.2.4. SWOT Analysis
- 12.1.3 Eddyfi
- 12.1.3.1. Company Overview
- 12.1.3.2. Products
- 12.1.3.3. Company Financials
- 12.1.3.4. SWOT Analysis
- 12.1.4 SGS Group
- 12.1.4.1. Company Overview
- 12.1.4.2. Products
- 12.1.4.3. Company Financials
- 12.1.4.4. SWOT Analysis
- 12.1.5 Bureau Veritas S A
- 12.1.5.1. Company Overview
- 12.1.5.2. Products
- 12.1.5.3. Company Financials
- 12.1.5.4. SWOT Analysis
- 12.1.6 Fujifilm Corporation
- 12.1.6.1. Company Overview
- 12.1.6.2. Products
- 12.1.6.3. Company Financials
- 12.1.6.4. SWOT Analysis
- 12.1.7 Mistras Group Inc
- 12.1.7.1. Company Overview
- 12.1.7.2. Products
- 12.1.7.3. Company Financials
- 12.1.7.4. SWOT Analysis
- 12.1.8 Zetec Inc
- 12.1.8.1. Company Overview
- 12.1.8.2. Products
- 12.1.8.3. Company Financials
- 12.1.8.4. SWOT Analysis
- 12.1.9 Applus+ Services Technologies S L
- 12.1.9.1. Company Overview
- 12.1.9.2. Products
- 12.1.9.3. Company Financials
- 12.1.9.4. SWOT Analysis
- 12.1.10 Baker Hughes Company
- 12.1.10.1. Company Overview
- 12.1.10.2. Products
- 12.1.10.3. Company Financials
- 12.1.10.4. SWOT Analysis
- 12.1.11 Team Inc *List Not Exhaustive
- 12.1.11.1. Company Overview
- 12.1.11.2. Products
- 12.1.11.3. Company Financials
- 12.1.11.4. SWOT Analysis
- 12.1.12 Olympus Corporation
- 12.1.12.1. Company Overview
- 12.1.12.2. Products
- 12.1.12.3. Company Financials
- 12.1.12.4. SWOT Analysis
- 12.1.1 Yxlon International Gmbh (Comet Holding AG)
- 12.2. Market Entropy
- 12.2.1 Company's Key Areas Served
- 12.2.2 Recent Developments
- 12.3. Company Market Share Analysis 2025
- 12.3.1 Top 5 Companies Market Share Analysis
- 12.3.2 Top 3 Companies Market Share Analysis
- 12.4. List of Potential Customers
- 13. Research Methodology
List of Figures
- Figure 1: Global NDT in Power Generation Market Revenue Breakdown (billion, %) by Region 2025 & 2033
- Figure 2: North America NDT in Power Generation Market Revenue (billion), by Type 2025 & 2033
- Figure 3: North America NDT in Power Generation Market Revenue Share (%), by Type 2025 & 2033
- Figure 4: North America NDT in Power Generation Market Revenue (billion), by Testing Technology 2025 & 2033
- Figure 5: North America NDT in Power Generation Market Revenue Share (%), by Testing Technology 2025 & 2033
- Figure 6: North America NDT in Power Generation Market Revenue (billion), by Country 2025 & 2033
- Figure 7: North America NDT in Power Generation Market Revenue Share (%), by Country 2025 & 2033
- Figure 8: Europe NDT in Power Generation Market Revenue (billion), by Type 2025 & 2033
- Figure 9: Europe NDT in Power Generation Market Revenue Share (%), by Type 2025 & 2033
- Figure 10: Europe NDT in Power Generation Market Revenue (billion), by Testing Technology 2025 & 2033
- Figure 11: Europe NDT in Power Generation Market Revenue Share (%), by Testing Technology 2025 & 2033
- Figure 12: Europe NDT in Power Generation Market Revenue (billion), by Country 2025 & 2033
- Figure 13: Europe NDT in Power Generation Market Revenue Share (%), by Country 2025 & 2033
- Figure 14: Asia Pacific NDT in Power Generation Market Revenue (billion), by Type 2025 & 2033
- Figure 15: Asia Pacific NDT in Power Generation Market Revenue Share (%), by Type 2025 & 2033
- Figure 16: Asia Pacific NDT in Power Generation Market Revenue (billion), by Testing Technology 2025 & 2033
- Figure 17: Asia Pacific NDT in Power Generation Market Revenue Share (%), by Testing Technology 2025 & 2033
- Figure 18: Asia Pacific NDT in Power Generation Market Revenue (billion), by Country 2025 & 2033
- Figure 19: Asia Pacific NDT in Power Generation Market Revenue Share (%), by Country 2025 & 2033
- Figure 20: Latin America NDT in Power Generation Market Revenue (billion), by Type 2025 & 2033
- Figure 21: Latin America NDT in Power Generation Market Revenue Share (%), by Type 2025 & 2033
- Figure 22: Latin America NDT in Power Generation Market Revenue (billion), by Testing Technology 2025 & 2033
- Figure 23: Latin America NDT in Power Generation Market Revenue Share (%), by Testing Technology 2025 & 2033
- Figure 24: Latin America NDT in Power Generation Market Revenue (billion), by Country 2025 & 2033
- Figure 25: Latin America NDT in Power Generation Market Revenue Share (%), by Country 2025 & 2033
- Figure 26: Middle East and Africa NDT in Power Generation Market Revenue (billion), by Type 2025 & 2033
- Figure 27: Middle East and Africa NDT in Power Generation Market Revenue Share (%), by Type 2025 & 2033
- Figure 28: Middle East and Africa NDT in Power Generation Market Revenue (billion), by Testing Technology 2025 & 2033
- Figure 29: Middle East and Africa NDT in Power Generation Market Revenue Share (%), by Testing Technology 2025 & 2033
- Figure 30: Middle East and Africa NDT in Power Generation Market Revenue (billion), by Country 2025 & 2033
- Figure 31: Middle East and Africa NDT in Power Generation Market Revenue Share (%), by Country 2025 & 2033
List of Tables
- Table 1: Global NDT in Power Generation Market Revenue billion Forecast, by Type 2020 & 2033
- Table 2: Global NDT in Power Generation Market Revenue billion Forecast, by Testing Technology 2020 & 2033
- Table 3: Global NDT in Power Generation Market Revenue billion Forecast, by Region 2020 & 2033
- Table 4: Global NDT in Power Generation Market Revenue billion Forecast, by Type 2020 & 2033
- Table 5: Global NDT in Power Generation Market Revenue billion Forecast, by Testing Technology 2020 & 2033
- Table 6: Global NDT in Power Generation Market Revenue billion Forecast, by Country 2020 & 2033
- Table 7: United States NDT in Power Generation Market Revenue (billion) Forecast, by Application 2020 & 2033
- Table 8: Canada NDT in Power Generation Market Revenue (billion) Forecast, by Application 2020 & 2033
- Table 9: Global NDT in Power Generation Market Revenue billion Forecast, by Type 2020 & 2033
- Table 10: Global NDT in Power Generation Market Revenue billion Forecast, by Testing Technology 2020 & 2033
- Table 11: Global NDT in Power Generation Market Revenue billion Forecast, by Country 2020 & 2033
- Table 12: United Kingdom NDT in Power Generation Market Revenue (billion) Forecast, by Application 2020 & 2033
- Table 13: Germany NDT in Power Generation Market Revenue (billion) Forecast, by Application 2020 & 2033
- Table 14: France NDT in Power Generation Market Revenue (billion) Forecast, by Application 2020 & 2033
- Table 15: Rest of Europe NDT in Power Generation Market Revenue (billion) Forecast, by Application 2020 & 2033
- Table 16: Global NDT in Power Generation Market Revenue billion Forecast, by Type 2020 & 2033
- Table 17: Global NDT in Power Generation Market Revenue billion Forecast, by Testing Technology 2020 & 2033
- Table 18: Global NDT in Power Generation Market Revenue billion Forecast, by Country 2020 & 2033
- Table 19: China NDT in Power Generation Market Revenue (billion) Forecast, by Application 2020 & 2033
- Table 20: Japan NDT in Power Generation Market Revenue (billion) Forecast, by Application 2020 & 2033
- Table 21: India NDT in Power Generation Market Revenue (billion) Forecast, by Application 2020 & 2033
- Table 22: Rest of Asia Pacific NDT in Power Generation Market Revenue (billion) Forecast, by Application 2020 & 2033
- Table 23: Global NDT in Power Generation Market Revenue billion Forecast, by Type 2020 & 2033
- Table 24: Global NDT in Power Generation Market Revenue billion Forecast, by Testing Technology 2020 & 2033
- Table 25: Global NDT in Power Generation Market Revenue billion Forecast, by Country 2020 & 2033
- Table 26: Global NDT in Power Generation Market Revenue billion Forecast, by Type 2020 & 2033
- Table 27: Global NDT in Power Generation Market Revenue billion Forecast, by Testing Technology 2020 & 2033
- Table 28: Global NDT in Power Generation Market Revenue billion Forecast, by Country 2020 & 2033
Frequently Asked Questions
1. What is the projected Compound Annual Growth Rate (CAGR) of the NDT in Power Generation Market?
The projected CAGR is approximately 6.24%.
2. Which companies are prominent players in the NDT in Power Generation Market?
Key companies in the market include Yxlon International Gmbh (Comet Holding AG), Intertek Group Plc, Eddyfi, SGS Group, Bureau Veritas S A, Fujifilm Corporation, Mistras Group Inc, Zetec Inc, Applus+ Services Technologies S L, Baker Hughes Company, Team Inc *List Not Exhaustive, Olympus Corporation.
3. What are the main segments of the NDT in Power Generation Market?
The market segments include Type, Testing Technology.
4. Can you provide details about the market size?
The market size is estimated to be USD 4.18 billion as of 2022.
5. What are some drivers contributing to market growth?
Stringent Regulations Mandating Safety Standards; Increase in Demand for Flaw Detection to Reduce Repair Cost; Aging Infrastructure and Increasing Need for Maintenance.
6. What are the notable trends driving market growth?
Visual Inspection Testing is Expected to Witness a Significant Growth.
7. Are there any restraints impacting market growth?
Lack of Skilled Workforce and Training Regulations.
8. Can you provide examples of recent developments in the market?
June 2022 - ALEIA, a startup specializing in AI, and Omexom NDT Engineering & Services, in collaboration with the Laboratoire d'Acoustique de l'Université du Mans (LAUM) UMR CNRS, have announced the deployment of the AUTEND project. The project is aimed to accelerate the inspection of nuclear power plants through AI. Moreover, the project is presently focusing on Non-Destructive Testing, which is an inspection process for nuclear infrastructures using eddy current or ultrasonic testing methods.
9. What pricing options are available for accessing the report?
Pricing options include single-user, multi-user, and enterprise licenses priced at USD 4750, USD 5250, and USD 8750 respectively.
10. Is the market size provided in terms of value or volume?
The market size is provided in terms of value, measured in billion.
11. Are there any specific market keywords associated with the report?
Yes, the market keyword associated with the report is "NDT in Power Generation Market," which aids in identifying and referencing the specific market segment covered.
12. How do I determine which pricing option suits my needs best?
The pricing options vary based on user requirements and access needs. Individual users may opt for single-user licenses, while businesses requiring broader access may choose multi-user or enterprise licenses for cost-effective access to the report.
13. Are there any additional resources or data provided in the NDT in Power Generation Market report?
While the report offers comprehensive insights, it's advisable to review the specific contents or supplementary materials provided to ascertain if additional resources or data are available.
14. How can I stay updated on further developments or reports in the NDT in Power Generation Market?
To stay informed about further developments, trends, and reports in the NDT in Power Generation Market, consider subscribing to industry newsletters, following relevant companies and organizations, or regularly checking reputable industry news sources and publications.
Methodology
Step 1 - Identification of Relevant Samples Size from Population Database


Step 2 - Approaches for Defining Global Market Size (Value, Volume* & Price*)

Note*: In applicable scenarios
Step 3 - Data Sources
Primary Research
- Web Analytics
- Survey Reports
- Research Institute
- Latest Research Reports
- Opinion Leaders
Secondary Research
- Annual Reports
- White Paper
- Latest Press Release
- Industry Association
- Paid Database
- Investor Presentations

Step 4 - Data Triangulation
Involves using different sources of information in order to increase the validity of a study
These sources are likely to be stakeholders in a program - participants, other researchers, program staff, other community members, and so on.
Then we put all data in single framework & apply various statistical tools to find out the dynamic on the market.
During the analysis stage, feedback from the stakeholder groups would be compared to determine areas of agreement as well as areas of divergence