

Key Insights
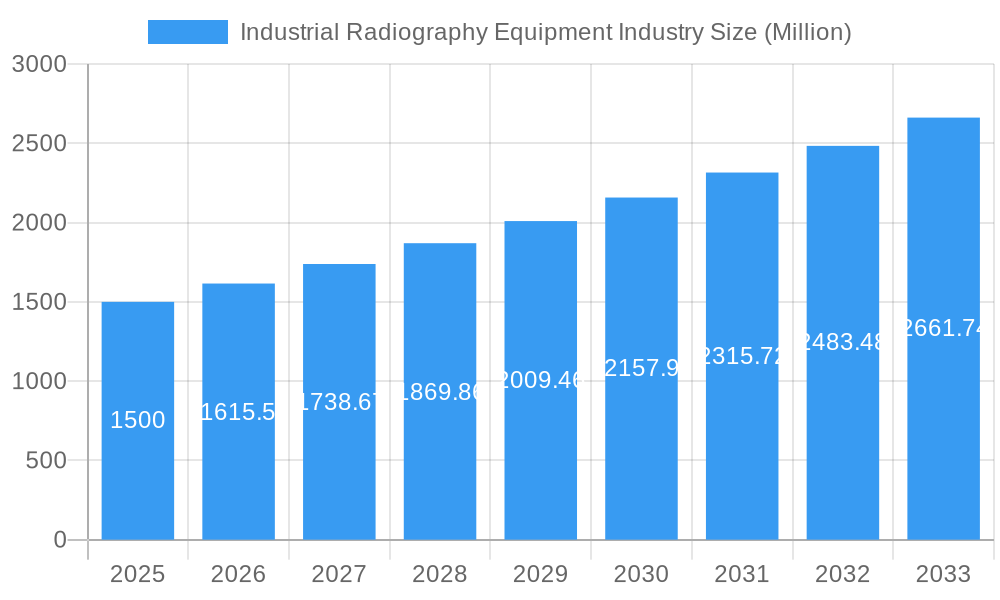
The Industrial Radiography Equipment market, valued at approximately 1.35 billion in the base year 2025, is projected for substantial growth, driven by a Compound Annual Growth Rate (CAGR) of 8.6% from 2025 to 2033. This expansion is fueled by the escalating demand for non-destructive testing (NDT) in key sectors such as aerospace, automotive, and energy. Stringent quality control mandates and safety regulations necessitate advanced radiography solutions for precise flaw detection and material integrity assessment. Technological innovations, including the proliferation of portable and digital radiography systems, are enhancing inspection efficiency and reducing turnaround times. Furthermore, the increasing adoption of Computed Tomography (CT) for detailed 3D imaging and enhanced accuracy contributes significantly to market development. Global infrastructure expansion, especially in emerging economies, also amplifies the need for reliable inspection methodologies, bolstering market prospects.
Industrial Radiography Equipment Industry Market Size (In Billion)
Despite positive trends, market growth faces certain constraints. The substantial initial investment for sophisticated radiography equipment can pose a challenge for smaller enterprises. Additionally, the requirement for skilled personnel proficient in operating and interpreting radiographic data presents an operational hurdle. The inherent health risks associated with radiation necessitate rigorous safety protocols and specialized training, potentially increasing operational expenditure. Nevertheless, the market is poised for significant advancement, particularly in regions experiencing rapid industrialization and infrastructure build-out. Continued innovation in digital radiography, coupled with the integration of automation and AI-driven image analysis, is expected to overcome existing limitations and accelerate market expansion throughout the forecast period. Segment analysis indicates strong growth potential for Computed Tomography (CT) and Direct Radiography (DR) systems, owing to their superior imaging fidelity and operational efficiency over conventional film-based radiography.
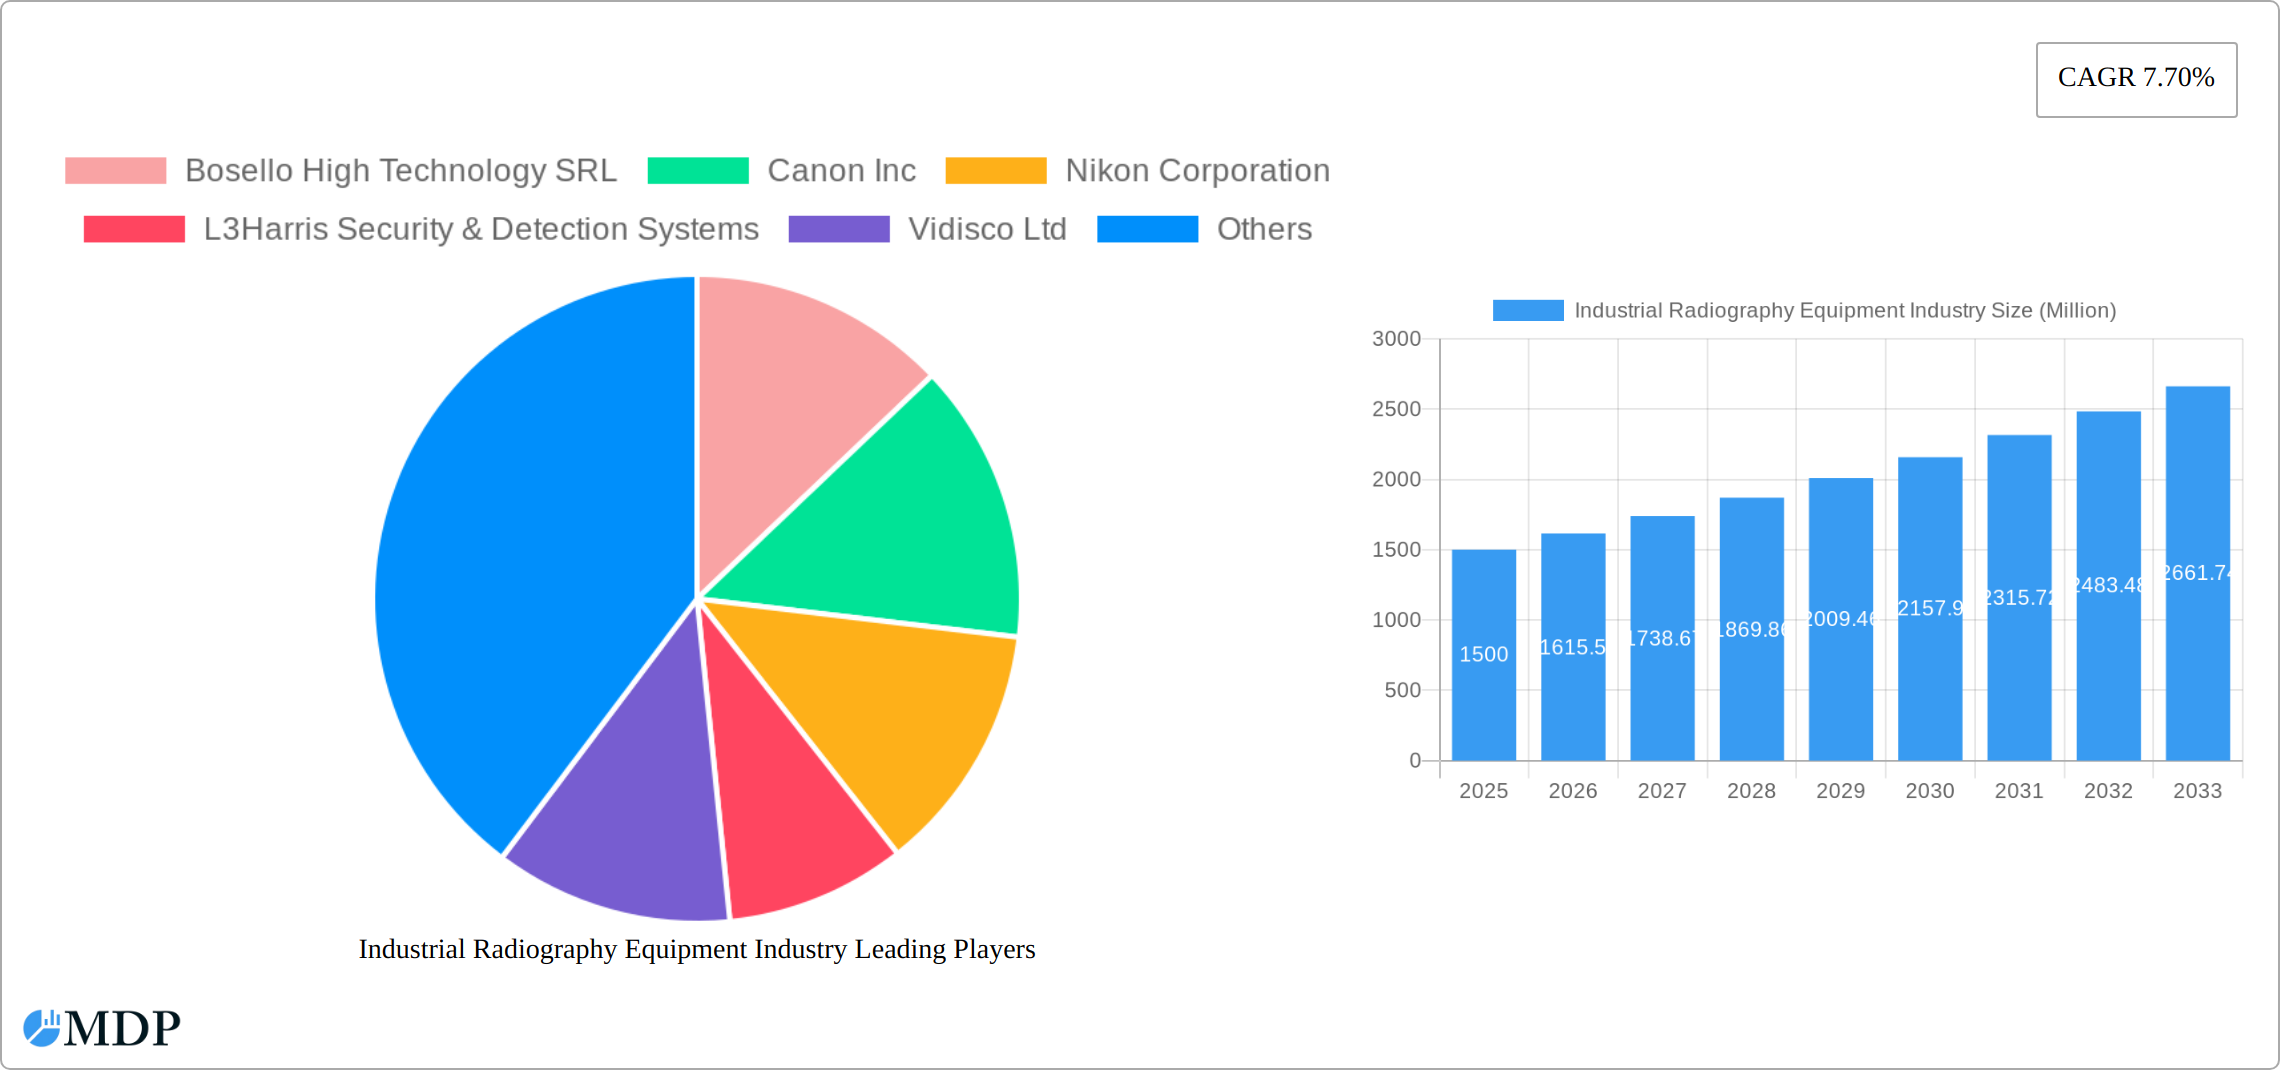
Industrial Radiography Equipment Industry Company Market Share
Industrial Radiography Equipment Market Report: 2019-2033 - A Comprehensive Analysis
This in-depth report provides a comprehensive analysis of the Industrial Radiography Equipment market, offering invaluable insights for stakeholders, investors, and industry professionals. With a focus on market dynamics, leading players, and future growth opportunities, this report covers the period 2019-2033, with a base year of 2025 and a forecast period of 2025-2033. The market is valued at $XX Million in 2025 and is projected to reach $XX Million by 2033, exhibiting a CAGR of XX%. This report analyzes key segments including Equipment, Software, Film Radiography, Computed Radiography, Direct Radiography, Computed Tomography across diverse end-user industries such as Aerospace, Food, Construction, Oil & Gas, Automotive, Energy, Semiconductor, and more.
Industrial Radiography Equipment Industry Market Dynamics & Concentration
The Industrial Radiography Equipment market is characterized by a moderately concentrated landscape, with a few key industry leaders holding substantial market share. This concentration is driven by the capital-intensive nature of high-end equipment and the specialized expertise required. The market share of the top 5 companies is estimated to be around XX% in 2025, indicating a significant presence of established players.
Innovation is a paramount driver, with continuous efforts focused on developing solutions that offer superior image quality for more precise defect detection, faster processing times to boost operational efficiency, and enhanced safety features to protect both operators and the environment from radiation hazards. These advancements are crucial for meeting the evolving demands of various industries.
The market operates under a rigorous regulatory framework. Stringent regulations concerning radiation safety and environmental compliance are not only mandatory but also influence product development and operational procedures. Adherence to these standards is critical for market access and long-term sustainability.
Technological advancements are reshaping the industry. The significant shift from traditional film-based radiography to more efficient and data-rich digital radiography (including Computed Radiography - CR and Direct Radiography - DR) is a prime example of this evolution. This transition offers numerous advantages, including immediate image acquisition, digital archiving, and enhanced analysis capabilities.
While radiography holds a strong position, it faces competitive challenges from alternative product substitutes such as ultrasonic testing (UT) and magnetic particle inspection (MPI). These methods offer different strengths and are often employed alongside radiography for comprehensive non-destructive testing (NDT) strategies.
End-user trends are a significant growth catalyst. The increasing adoption of automation in industrial processes and the consistently growing demand for reliable non-destructive testing (NDT) solutions across sectors like aerospace, oil & gas, and power generation are propelling market expansion.
Mergers and acquisitions (M&A) activity has been moderate, with approximately XX major deals recorded between 2019 and 2024. This consolidation is anticipated to continue as companies seek to expand their product portfolios, geographical reach, and technological capabilities, ultimately shaping the market's competitive dynamics and potentially leading to further market concentration.
- Market Concentration: Top 5 players estimated to hold XX% market share (2025).
- Key Innovation Drivers: Focus on improved image quality, faster data processing, and enhanced operator safety features.
- Regulatory Landscape: Strict adherence to radiation safety and environmental compliance regulations is essential.
- Competitive Product Substitutes: Ultrasonic Testing (UT) and Magnetic Particle Inspection (MPI) are significant alternatives.
- Dominant End-User Trends: Increasing automation in industrial settings and a robust demand for comprehensive NDT solutions.
- M&A Activity: Moderate consolidation observed, with approximately XX major deals between 2019-2024.
Industrial Radiography Equipment Industry Industry Trends & Analysis
The Industrial Radiography Equipment market exhibits robust growth, fueled by several key trends. The increasing adoption of digital radiography technologies (Computed Radiography and Direct Radiography) is driving significant market expansion. Advancements in Computed Tomography (CT) are further enhancing the capabilities and applications of industrial radiography. The rising demand for non-destructive testing (NDT) across various end-user industries, particularly in aerospace, automotive, and oil & gas, is a primary growth driver. The market penetration of digital technologies is expected to reach XX% by 2033, up from XX% in 2025. The competitive landscape is intensely dynamic, characterized by both technological innovation and strategic partnerships. Consumer preferences are shifting toward higher resolution imaging, faster processing, and user-friendly interfaces. The market is witnessing a significant increase in the adoption of cloud-based solutions for image analysis and reporting. This shift improves efficiency and reduces storage costs. The industry faces challenges in keeping pace with the rapid technological advancements while ensuring regulatory compliance.
Leading Markets & Segments in Industrial Radiography Equipment Industry
The automotive and manufacturing sector currently stands as the largest end-user segment, driven by stringent quality control requirements and high production volumes, accounting for approximately XX% of the market in 2025. Geographically, the Asia-Pacific region is poised to be the most dynamic market, propelled by rapid industrialization, extensive infrastructure development projects, and increasing government investments in advanced manufacturing and safety standards.
In terms of technology, Computed Radiography (CR) and Direct Radiography (DR) are experiencing the highest growth rates, largely displacing traditional film radiography due to their efficiency, digital workflow, and superior image manipulation capabilities.
Examining the offering segments, the Equipment sector currently holds the largest market share. However, the Software segment is projected to witness the fastest growth, fueled by the increasing demand for sophisticated image analysis tools, automated reporting capabilities, and integration with digital quality management systems.
- Dominant Growth Region: Asia-Pacific, driven by industrial expansion and infrastructure projects.
- Dominant End-User Segment: Automotive and Manufacturing, representing approximately XX% of the market in 2025.
- Fastest Growing Technology Segment: Computed Radiography (CR) and Direct Radiography (DR), offering digital advantages.
- Fastest Growing Offering Segment: Software, essential for advanced image analysis and workflow optimization.
Key Drivers for Segment Growth:
- Automotive & Manufacturing: Driven by the imperative for flawless product quality, increasing vehicle production, and the need for efficient inspection of complex components.
- Asia-Pacific: Fueled by robust industrial growth, significant investments in new infrastructure, and a rising emphasis on quality and safety in manufacturing processes.
- Software: The demand for advanced image processing, AI-driven defect detection, comprehensive data management, and seamless integration into factory automation workflows is accelerating its growth.
Industrial Radiography Equipment Industry Product Developments
Recent product innovations include advanced digital detectors with higher resolution and sensitivity, improved software algorithms for image processing and analysis, and portable and more user-friendly systems. These developments are expanding the applications of industrial radiography into new areas and enhancing efficiency across existing applications. The emphasis is on improving image quality, reducing inspection time, and enhancing portability, all crucial factors improving market competitiveness.
Key Drivers of Industrial Radiography Equipment Industry Growth
Several factors are driving the growth of the Industrial Radiography Equipment market. Firstly, the increasing stringency of quality control requirements across diverse industries, particularly in aerospace, automotive, and energy, necessitates advanced NDT techniques. Secondly, the growing adoption of advanced digital technologies, offering superior image quality and processing speeds, fuels market expansion. Finally, supportive government regulations and investments in infrastructure projects are positively influencing market growth.
Challenges in the Industrial Radiography Equipment Industry Market
The Industrial Radiography Equipment industry navigates several significant challenges. The high initial investment cost associated with advanced radiography systems, particularly digital solutions, can be a barrier for smaller enterprises or those in emerging economies. Furthermore, the complex and evolving regulatory compliance requirements for radiation safety and data handling demand continuous vigilance and investment. Intense competition from both established players and new entrants, coupled with the presence of alternative NDT technologies, necessitates constant innovation and competitive pricing strategies.
Supply chain disruptions, exacerbated by global events, can impact the timely availability of critical components, leading to production delays and affecting delivery schedules. Moreover, the industry faces a persistent challenge in finding and retaining skilled technicians proficient in operating, calibrating, and maintaining sophisticated radiography equipment. This skill gap can impede the adoption of new technologies and limit market expansion.
Emerging Opportunities in Industrial Radiography Equipment Industry
The market presents significant opportunities, particularly in developing economies with expanding industrial bases. Technological advancements like artificial intelligence (AI) integration for automated defect detection and cloud-based platforms for remote inspection are opening new avenues. Strategic collaborations between equipment manufacturers and software developers are anticipated to accelerate growth.
Leading Players in the Industrial Radiography Equipment Industry Sector
- Bosello High Technology SRL
- Canon Inc
- Nikon Corporation
- L3Harris Security & Detection Systems
- Vidisco Ltd
- Dürr NDT Gmbh & Co KG
- Teledyne Dalsa Inc
- North Star Imaging Inc
- YXLON International
- Hamamatsu Photonics K K
- Carestream Health Inc
- Hitachi Ltd
- General Electric Company
- Olympus Corporation
- Rigaku Corporation
Key Milestones in Industrial Radiography Equipment Industry Industry
- 2020: Introduction of AI-powered defect detection software by YXLON International.
- 2021: Acquisition of a smaller competitor by Teledyne Dalsa Inc, expanding its market share.
- 2022: Launch of a new portable DR system by Canon Inc, improving accessibility.
- 2023: Development of a high-resolution CT scanner by General Electric Company.
- 2024: Increased adoption of cloud-based image analysis platforms by multiple industry players.
Strategic Outlook for Industrial Radiography Equipment Industry Market
The future outlook for the Industrial Radiography Equipment market is exceptionally promising, underpinned by relentless technological innovation and the ever-expanding spectrum of applications across diverse industrial sectors. Companies that prioritize strategic partnerships, focus on continuously enhancing their product capabilities with advanced software and artificial intelligence integration, and actively pursue expansion into burgeoning emerging markets are best positioned for sustained long-term success.
The industry's trajectory is strongly aligned with the global demand for reliable, efficient, and precise non-destructive testing (NDT) solutions. As industries increasingly focus on safety, quality assurance, and operational efficiency, the demand for advanced radiography equipment and integrated NDT solutions is expected to remain robust, driving significant market growth and opportunities for forward-thinking companies.
Industrial Radiography Equipment Industry Segmentation
-
1. Offering
- 1.1. Equipment
- 1.2. Software
-
2. Technology
- 2.1. Film Radiography
- 2.2. Computed Radiography
- 2.3. Direct Radiography
- 2.4. Computed Tomography
-
3. End-user Industry
- 3.1. Aerospace
- 3.2. Food Industry
- 3.3. Construction
- 3.4. Oil and Gas
- 3.5. Automotive and Manufacturing
- 3.6. Energy and Power
- 3.7. Semiconductor and Electronics
- 3.8. Other End-user Industries
Industrial Radiography Equipment Industry Segmentation By Geography
- 1. North America
- 2. Europe
- 3. Asia Pacific
- 4. Latin America
- 5. Middle East and Africa
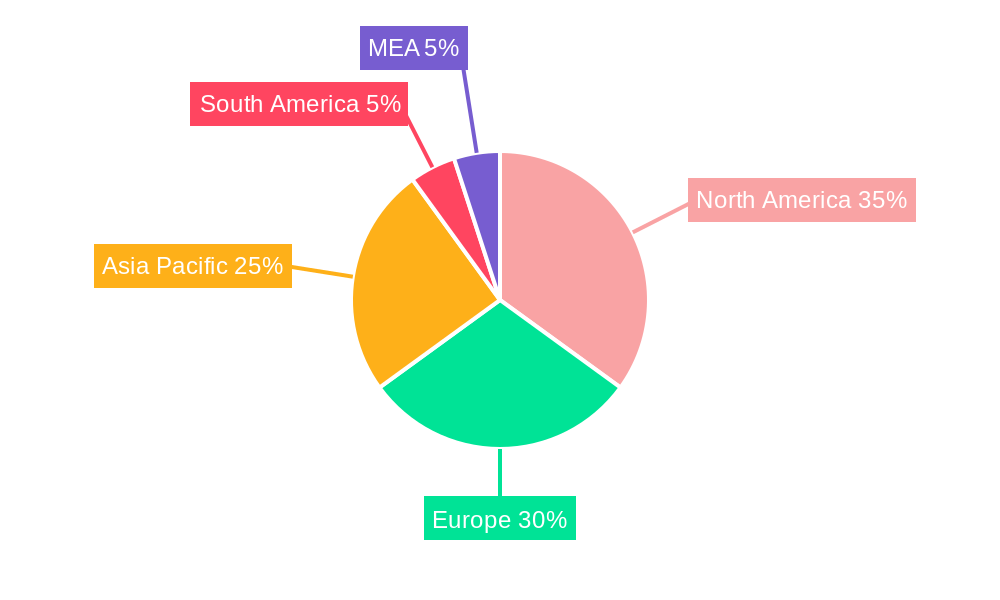
Industrial Radiography Equipment Industry Regional Market Share
Geographic Coverage of Industrial Radiography Equipment Industry
Industrial Radiography Equipment Industry REPORT HIGHLIGHTS
| Aspects | Details |
|---|---|
| Study Period | 2020-2034 |
| Base Year | 2025 |
| Estimated Year | 2026 |
| Forecast Period | 2026-2034 |
| Historical Period | 2020-2025 |
| Growth Rate | CAGR of 8.6% from 2020-2034 |
| Segmentation |
|
Table of Contents
- 1. Introduction
- 1.1. Research Scope
- 1.2. Market Segmentation
- 1.3. Research Objective
- 1.4. Definitions and Assumptions
- 2. Executive Summary
- 2.1. Market Snapshot
- 3. Market Dynamics
- 3.1. Market Drivers
- 3.2. Market Restrains
- 3.3. Market Trends
- 3.4. Market Opportunities
- 4. Market Factor Analysis
- 4.1. Porters Five Forces
- 4.1.1. Bargaining Power of Suppliers
- 4.1.2. Bargaining Power of Buyers
- 4.1.3. Threat of New Entrants
- 4.1.4. Threat of Substitutes
- 4.1.5. Competitive Rivalry
- 4.2. PESTEL analysis
- 4.3. BCG Analysis
- 4.3.1. Stars (High Growth, High Market Share)
- 4.3.2. Cash Cows (Low Growth, High Market Share)
- 4.3.3. Question Mark (High Growth, Low Market Share)
- 4.3.4. Dogs (Low Growth, Low Market Share)
- 4.4. Ansoff Matrix Analysis
- 4.5. Supply Chain Analysis
- 4.6. Regulatory Landscape
- 4.7. Current Market Potential and Opportunity Assessment (TAM–SAM–SOM Framework)
- 4.8. MDP Analyst Note
- 4.1. Porters Five Forces
- 5. Market Analysis, Insights and Forecast 2021-2033
- 5.1. Market Analysis, Insights and Forecast - by Offering
- 5.1.1. Equipment
- 5.1.2. Software
- 5.2. Market Analysis, Insights and Forecast - by Technology
- 5.2.1. Film Radiography
- 5.2.2. Computed Radiography
- 5.2.3. Direct Radiography
- 5.2.4. Computed Tomography
- 5.3. Market Analysis, Insights and Forecast - by End-user Industry
- 5.3.1. Aerospace
- 5.3.2. Food Industry
- 5.3.3. Construction
- 5.3.4. Oil and Gas
- 5.3.5. Automotive and Manufacturing
- 5.3.6. Energy and Power
- 5.3.7. Semiconductor and Electronics
- 5.3.8. Other End-user Industries
- 5.4. Market Analysis, Insights and Forecast - by Region
- 5.4.1. North America
- 5.4.2. Europe
- 5.4.3. Asia Pacific
- 5.4.4. Latin America
- 5.4.5. Middle East and Africa
- 5.1. Market Analysis, Insights and Forecast - by Offering
- 6. Global Industrial Radiography Equipment Industry Analysis, Insights and Forecast, 2021-2033
- 6.1. Market Analysis, Insights and Forecast - by Offering
- 6.1.1. Equipment
- 6.1.2. Software
- 6.2. Market Analysis, Insights and Forecast - by Technology
- 6.2.1. Film Radiography
- 6.2.2. Computed Radiography
- 6.2.3. Direct Radiography
- 6.2.4. Computed Tomography
- 6.3. Market Analysis, Insights and Forecast - by End-user Industry
- 6.3.1. Aerospace
- 6.3.2. Food Industry
- 6.3.3. Construction
- 6.3.4. Oil and Gas
- 6.3.5. Automotive and Manufacturing
- 6.3.6. Energy and Power
- 6.3.7. Semiconductor and Electronics
- 6.3.8. Other End-user Industries
- 6.1. Market Analysis, Insights and Forecast - by Offering
- 7. North America Industrial Radiography Equipment Industry Analysis, Insights and Forecast, 2020-2032
- 7.1. Market Analysis, Insights and Forecast - by Offering
- 7.1.1. Equipment
- 7.1.2. Software
- 7.2. Market Analysis, Insights and Forecast - by Technology
- 7.2.1. Film Radiography
- 7.2.2. Computed Radiography
- 7.2.3. Direct Radiography
- 7.2.4. Computed Tomography
- 7.3. Market Analysis, Insights and Forecast - by End-user Industry
- 7.3.1. Aerospace
- 7.3.2. Food Industry
- 7.3.3. Construction
- 7.3.4. Oil and Gas
- 7.3.5. Automotive and Manufacturing
- 7.3.6. Energy and Power
- 7.3.7. Semiconductor and Electronics
- 7.3.8. Other End-user Industries
- 7.1. Market Analysis, Insights and Forecast - by Offering
- 8. Europe Industrial Radiography Equipment Industry Analysis, Insights and Forecast, 2020-2032
- 8.1. Market Analysis, Insights and Forecast - by Offering
- 8.1.1. Equipment
- 8.1.2. Software
- 8.2. Market Analysis, Insights and Forecast - by Technology
- 8.2.1. Film Radiography
- 8.2.2. Computed Radiography
- 8.2.3. Direct Radiography
- 8.2.4. Computed Tomography
- 8.3. Market Analysis, Insights and Forecast - by End-user Industry
- 8.3.1. Aerospace
- 8.3.2. Food Industry
- 8.3.3. Construction
- 8.3.4. Oil and Gas
- 8.3.5. Automotive and Manufacturing
- 8.3.6. Energy and Power
- 8.3.7. Semiconductor and Electronics
- 8.3.8. Other End-user Industries
- 8.1. Market Analysis, Insights and Forecast - by Offering
- 9. Asia Pacific Industrial Radiography Equipment Industry Analysis, Insights and Forecast, 2020-2032
- 9.1. Market Analysis, Insights and Forecast - by Offering
- 9.1.1. Equipment
- 9.1.2. Software
- 9.2. Market Analysis, Insights and Forecast - by Technology
- 9.2.1. Film Radiography
- 9.2.2. Computed Radiography
- 9.2.3. Direct Radiography
- 9.2.4. Computed Tomography
- 9.3. Market Analysis, Insights and Forecast - by End-user Industry
- 9.3.1. Aerospace
- 9.3.2. Food Industry
- 9.3.3. Construction
- 9.3.4. Oil and Gas
- 9.3.5. Automotive and Manufacturing
- 9.3.6. Energy and Power
- 9.3.7. Semiconductor and Electronics
- 9.3.8. Other End-user Industries
- 9.1. Market Analysis, Insights and Forecast - by Offering
- 10. Latin America Industrial Radiography Equipment Industry Analysis, Insights and Forecast, 2020-2032
- 10.1. Market Analysis, Insights and Forecast - by Offering
- 10.1.1. Equipment
- 10.1.2. Software
- 10.2. Market Analysis, Insights and Forecast - by Technology
- 10.2.1. Film Radiography
- 10.2.2. Computed Radiography
- 10.2.3. Direct Radiography
- 10.2.4. Computed Tomography
- 10.3. Market Analysis, Insights and Forecast - by End-user Industry
- 10.3.1. Aerospace
- 10.3.2. Food Industry
- 10.3.3. Construction
- 10.3.4. Oil and Gas
- 10.3.5. Automotive and Manufacturing
- 10.3.6. Energy and Power
- 10.3.7. Semiconductor and Electronics
- 10.3.8. Other End-user Industries
- 10.1. Market Analysis, Insights and Forecast - by Offering
- 11. Middle East and Africa Industrial Radiography Equipment Industry Analysis, Insights and Forecast, 2020-2032
- 11.1. Market Analysis, Insights and Forecast - by Offering
- 11.1.1. Equipment
- 11.1.2. Software
- 11.2. Market Analysis, Insights and Forecast - by Technology
- 11.2.1. Film Radiography
- 11.2.2. Computed Radiography
- 11.2.3. Direct Radiography
- 11.2.4. Computed Tomography
- 11.3. Market Analysis, Insights and Forecast - by End-user Industry
- 11.3.1. Aerospace
- 11.3.2. Food Industry
- 11.3.3. Construction
- 11.3.4. Oil and Gas
- 11.3.5. Automotive and Manufacturing
- 11.3.6. Energy and Power
- 11.3.7. Semiconductor and Electronics
- 11.3.8. Other End-user Industries
- 11.1. Market Analysis, Insights and Forecast - by Offering
- 12. Competitive Analysis
- 12.1. Company Profiles
- 12.1.1 Bosello High Technology SRL
- 12.1.1.1. Company Overview
- 12.1.1.2. Products
- 12.1.1.3. Company Financials
- 12.1.1.4. SWOT Analysis
- 12.1.2 Canon Inc
- 12.1.2.1. Company Overview
- 12.1.2.2. Products
- 12.1.2.3. Company Financials
- 12.1.2.4. SWOT Analysis
- 12.1.3 Nikon Corporation
- 12.1.3.1. Company Overview
- 12.1.3.2. Products
- 12.1.3.3. Company Financials
- 12.1.3.4. SWOT Analysis
- 12.1.4 L3Harris Security & Detection Systems
- 12.1.4.1. Company Overview
- 12.1.4.2. Products
- 12.1.4.3. Company Financials
- 12.1.4.4. SWOT Analysis
- 12.1.5 Vidisco Ltd
- 12.1.5.1. Company Overview
- 12.1.5.2. Products
- 12.1.5.3. Company Financials
- 12.1.5.4. SWOT Analysis
- 12.1.6 Dürr NDT Gmbh & Co KG
- 12.1.6.1. Company Overview
- 12.1.6.2. Products
- 12.1.6.3. Company Financials
- 12.1.6.4. SWOT Analysis
- 12.1.7 Teledyne Dalsa Inc
- 12.1.7.1. Company Overview
- 12.1.7.2. Products
- 12.1.7.3. Company Financials
- 12.1.7.4. SWOT Analysis
- 12.1.8 North Star Imaging Inc
- 12.1.8.1. Company Overview
- 12.1.8.2. Products
- 12.1.8.3. Company Financials
- 12.1.8.4. SWOT Analysis
- 12.1.9 YXLON International
- 12.1.9.1. Company Overview
- 12.1.9.2. Products
- 12.1.9.3. Company Financials
- 12.1.9.4. SWOT Analysis
- 12.1.10 Hamamatsu Photonics K K
- 12.1.10.1. Company Overview
- 12.1.10.2. Products
- 12.1.10.3. Company Financials
- 12.1.10.4. SWOT Analysis
- 12.1.11 Carestream Health Inc
- 12.1.11.1. Company Overview
- 12.1.11.2. Products
- 12.1.11.3. Company Financials
- 12.1.11.4. SWOT Analysis
- 12.1.12 Hitachi Ltd
- 12.1.12.1. Company Overview
- 12.1.12.2. Products
- 12.1.12.3. Company Financials
- 12.1.12.4. SWOT Analysis
- 12.1.13 General Electric Company
- 12.1.13.1. Company Overview
- 12.1.13.2. Products
- 12.1.13.3. Company Financials
- 12.1.13.4. SWOT Analysis
- 12.1.14 Olympus Corporation
- 12.1.14.1. Company Overview
- 12.1.14.2. Products
- 12.1.14.3. Company Financials
- 12.1.14.4. SWOT Analysis
- 12.1.15 Rigaku Corporation
- 12.1.15.1. Company Overview
- 12.1.15.2. Products
- 12.1.15.3. Company Financials
- 12.1.15.4. SWOT Analysis
- 12.1.1 Bosello High Technology SRL
- 12.2. Market Entropy
- 12.2.1 Company's Key Areas Served
- 12.2.2 Recent Developments
- 12.3. Company Market Share Analysis 2025
- 12.3.1 Top 5 Companies Market Share Analysis
- 12.3.2 Top 3 Companies Market Share Analysis
- 12.4. List of Potential Customers
- 13. Research Methodology
List of Figures
- Figure 1: Global Industrial Radiography Equipment Industry Revenue Breakdown (billion, %) by Region 2025 & 2033
- Figure 2: Global Industrial Radiography Equipment Industry Volume Breakdown (K Unit, %) by Region 2025 & 2033
- Figure 3: North America Industrial Radiography Equipment Industry Revenue (billion), by Offering 2025 & 2033
- Figure 4: North America Industrial Radiography Equipment Industry Volume (K Unit), by Offering 2025 & 2033
- Figure 5: North America Industrial Radiography Equipment Industry Revenue Share (%), by Offering 2025 & 2033
- Figure 6: North America Industrial Radiography Equipment Industry Volume Share (%), by Offering 2025 & 2033
- Figure 7: North America Industrial Radiography Equipment Industry Revenue (billion), by Technology 2025 & 2033
- Figure 8: North America Industrial Radiography Equipment Industry Volume (K Unit), by Technology 2025 & 2033
- Figure 9: North America Industrial Radiography Equipment Industry Revenue Share (%), by Technology 2025 & 2033
- Figure 10: North America Industrial Radiography Equipment Industry Volume Share (%), by Technology 2025 & 2033
- Figure 11: North America Industrial Radiography Equipment Industry Revenue (billion), by End-user Industry 2025 & 2033
- Figure 12: North America Industrial Radiography Equipment Industry Volume (K Unit), by End-user Industry 2025 & 2033
- Figure 13: North America Industrial Radiography Equipment Industry Revenue Share (%), by End-user Industry 2025 & 2033
- Figure 14: North America Industrial Radiography Equipment Industry Volume Share (%), by End-user Industry 2025 & 2033
- Figure 15: North America Industrial Radiography Equipment Industry Revenue (billion), by Country 2025 & 2033
- Figure 16: North America Industrial Radiography Equipment Industry Volume (K Unit), by Country 2025 & 2033
- Figure 17: North America Industrial Radiography Equipment Industry Revenue Share (%), by Country 2025 & 2033
- Figure 18: North America Industrial Radiography Equipment Industry Volume Share (%), by Country 2025 & 2033
- Figure 19: Europe Industrial Radiography Equipment Industry Revenue (billion), by Offering 2025 & 2033
- Figure 20: Europe Industrial Radiography Equipment Industry Volume (K Unit), by Offering 2025 & 2033
- Figure 21: Europe Industrial Radiography Equipment Industry Revenue Share (%), by Offering 2025 & 2033
- Figure 22: Europe Industrial Radiography Equipment Industry Volume Share (%), by Offering 2025 & 2033
- Figure 23: Europe Industrial Radiography Equipment Industry Revenue (billion), by Technology 2025 & 2033
- Figure 24: Europe Industrial Radiography Equipment Industry Volume (K Unit), by Technology 2025 & 2033
- Figure 25: Europe Industrial Radiography Equipment Industry Revenue Share (%), by Technology 2025 & 2033
- Figure 26: Europe Industrial Radiography Equipment Industry Volume Share (%), by Technology 2025 & 2033
- Figure 27: Europe Industrial Radiography Equipment Industry Revenue (billion), by End-user Industry 2025 & 2033
- Figure 28: Europe Industrial Radiography Equipment Industry Volume (K Unit), by End-user Industry 2025 & 2033
- Figure 29: Europe Industrial Radiography Equipment Industry Revenue Share (%), by End-user Industry 2025 & 2033
- Figure 30: Europe Industrial Radiography Equipment Industry Volume Share (%), by End-user Industry 2025 & 2033
- Figure 31: Europe Industrial Radiography Equipment Industry Revenue (billion), by Country 2025 & 2033
- Figure 32: Europe Industrial Radiography Equipment Industry Volume (K Unit), by Country 2025 & 2033
- Figure 33: Europe Industrial Radiography Equipment Industry Revenue Share (%), by Country 2025 & 2033
- Figure 34: Europe Industrial Radiography Equipment Industry Volume Share (%), by Country 2025 & 2033
- Figure 35: Asia Pacific Industrial Radiography Equipment Industry Revenue (billion), by Offering 2025 & 2033
- Figure 36: Asia Pacific Industrial Radiography Equipment Industry Volume (K Unit), by Offering 2025 & 2033
- Figure 37: Asia Pacific Industrial Radiography Equipment Industry Revenue Share (%), by Offering 2025 & 2033
- Figure 38: Asia Pacific Industrial Radiography Equipment Industry Volume Share (%), by Offering 2025 & 2033
- Figure 39: Asia Pacific Industrial Radiography Equipment Industry Revenue (billion), by Technology 2025 & 2033
- Figure 40: Asia Pacific Industrial Radiography Equipment Industry Volume (K Unit), by Technology 2025 & 2033
- Figure 41: Asia Pacific Industrial Radiography Equipment Industry Revenue Share (%), by Technology 2025 & 2033
- Figure 42: Asia Pacific Industrial Radiography Equipment Industry Volume Share (%), by Technology 2025 & 2033
- Figure 43: Asia Pacific Industrial Radiography Equipment Industry Revenue (billion), by End-user Industry 2025 & 2033
- Figure 44: Asia Pacific Industrial Radiography Equipment Industry Volume (K Unit), by End-user Industry 2025 & 2033
- Figure 45: Asia Pacific Industrial Radiography Equipment Industry Revenue Share (%), by End-user Industry 2025 & 2033
- Figure 46: Asia Pacific Industrial Radiography Equipment Industry Volume Share (%), by End-user Industry 2025 & 2033
- Figure 47: Asia Pacific Industrial Radiography Equipment Industry Revenue (billion), by Country 2025 & 2033
- Figure 48: Asia Pacific Industrial Radiography Equipment Industry Volume (K Unit), by Country 2025 & 2033
- Figure 49: Asia Pacific Industrial Radiography Equipment Industry Revenue Share (%), by Country 2025 & 2033
- Figure 50: Asia Pacific Industrial Radiography Equipment Industry Volume Share (%), by Country 2025 & 2033
- Figure 51: Latin America Industrial Radiography Equipment Industry Revenue (billion), by Offering 2025 & 2033
- Figure 52: Latin America Industrial Radiography Equipment Industry Volume (K Unit), by Offering 2025 & 2033
- Figure 53: Latin America Industrial Radiography Equipment Industry Revenue Share (%), by Offering 2025 & 2033
- Figure 54: Latin America Industrial Radiography Equipment Industry Volume Share (%), by Offering 2025 & 2033
- Figure 55: Latin America Industrial Radiography Equipment Industry Revenue (billion), by Technology 2025 & 2033
- Figure 56: Latin America Industrial Radiography Equipment Industry Volume (K Unit), by Technology 2025 & 2033
- Figure 57: Latin America Industrial Radiography Equipment Industry Revenue Share (%), by Technology 2025 & 2033
- Figure 58: Latin America Industrial Radiography Equipment Industry Volume Share (%), by Technology 2025 & 2033
- Figure 59: Latin America Industrial Radiography Equipment Industry Revenue (billion), by End-user Industry 2025 & 2033
- Figure 60: Latin America Industrial Radiography Equipment Industry Volume (K Unit), by End-user Industry 2025 & 2033
- Figure 61: Latin America Industrial Radiography Equipment Industry Revenue Share (%), by End-user Industry 2025 & 2033
- Figure 62: Latin America Industrial Radiography Equipment Industry Volume Share (%), by End-user Industry 2025 & 2033
- Figure 63: Latin America Industrial Radiography Equipment Industry Revenue (billion), by Country 2025 & 2033
- Figure 64: Latin America Industrial Radiography Equipment Industry Volume (K Unit), by Country 2025 & 2033
- Figure 65: Latin America Industrial Radiography Equipment Industry Revenue Share (%), by Country 2025 & 2033
- Figure 66: Latin America Industrial Radiography Equipment Industry Volume Share (%), by Country 2025 & 2033
- Figure 67: Middle East and Africa Industrial Radiography Equipment Industry Revenue (billion), by Offering 2025 & 2033
- Figure 68: Middle East and Africa Industrial Radiography Equipment Industry Volume (K Unit), by Offering 2025 & 2033
- Figure 69: Middle East and Africa Industrial Radiography Equipment Industry Revenue Share (%), by Offering 2025 & 2033
- Figure 70: Middle East and Africa Industrial Radiography Equipment Industry Volume Share (%), by Offering 2025 & 2033
- Figure 71: Middle East and Africa Industrial Radiography Equipment Industry Revenue (billion), by Technology 2025 & 2033
- Figure 72: Middle East and Africa Industrial Radiography Equipment Industry Volume (K Unit), by Technology 2025 & 2033
- Figure 73: Middle East and Africa Industrial Radiography Equipment Industry Revenue Share (%), by Technology 2025 & 2033
- Figure 74: Middle East and Africa Industrial Radiography Equipment Industry Volume Share (%), by Technology 2025 & 2033
- Figure 75: Middle East and Africa Industrial Radiography Equipment Industry Revenue (billion), by End-user Industry 2025 & 2033
- Figure 76: Middle East and Africa Industrial Radiography Equipment Industry Volume (K Unit), by End-user Industry 2025 & 2033
- Figure 77: Middle East and Africa Industrial Radiography Equipment Industry Revenue Share (%), by End-user Industry 2025 & 2033
- Figure 78: Middle East and Africa Industrial Radiography Equipment Industry Volume Share (%), by End-user Industry 2025 & 2033
- Figure 79: Middle East and Africa Industrial Radiography Equipment Industry Revenue (billion), by Country 2025 & 2033
- Figure 80: Middle East and Africa Industrial Radiography Equipment Industry Volume (K Unit), by Country 2025 & 2033
- Figure 81: Middle East and Africa Industrial Radiography Equipment Industry Revenue Share (%), by Country 2025 & 2033
- Figure 82: Middle East and Africa Industrial Radiography Equipment Industry Volume Share (%), by Country 2025 & 2033
List of Tables
- Table 1: Global Industrial Radiography Equipment Industry Revenue billion Forecast, by Offering 2020 & 2033
- Table 2: Global Industrial Radiography Equipment Industry Volume K Unit Forecast, by Offering 2020 & 2033
- Table 3: Global Industrial Radiography Equipment Industry Revenue billion Forecast, by Technology 2020 & 2033
- Table 4: Global Industrial Radiography Equipment Industry Volume K Unit Forecast, by Technology 2020 & 2033
- Table 5: Global Industrial Radiography Equipment Industry Revenue billion Forecast, by End-user Industry 2020 & 2033
- Table 6: Global Industrial Radiography Equipment Industry Volume K Unit Forecast, by End-user Industry 2020 & 2033
- Table 7: Global Industrial Radiography Equipment Industry Revenue billion Forecast, by Region 2020 & 2033
- Table 8: Global Industrial Radiography Equipment Industry Volume K Unit Forecast, by Region 2020 & 2033
- Table 9: Global Industrial Radiography Equipment Industry Revenue billion Forecast, by Offering 2020 & 2033
- Table 10: Global Industrial Radiography Equipment Industry Volume K Unit Forecast, by Offering 2020 & 2033
- Table 11: Global Industrial Radiography Equipment Industry Revenue billion Forecast, by Technology 2020 & 2033
- Table 12: Global Industrial Radiography Equipment Industry Volume K Unit Forecast, by Technology 2020 & 2033
- Table 13: Global Industrial Radiography Equipment Industry Revenue billion Forecast, by End-user Industry 2020 & 2033
- Table 14: Global Industrial Radiography Equipment Industry Volume K Unit Forecast, by End-user Industry 2020 & 2033
- Table 15: Global Industrial Radiography Equipment Industry Revenue billion Forecast, by Country 2020 & 2033
- Table 16: Global Industrial Radiography Equipment Industry Volume K Unit Forecast, by Country 2020 & 2033
- Table 17: Global Industrial Radiography Equipment Industry Revenue billion Forecast, by Offering 2020 & 2033
- Table 18: Global Industrial Radiography Equipment Industry Volume K Unit Forecast, by Offering 2020 & 2033
- Table 19: Global Industrial Radiography Equipment Industry Revenue billion Forecast, by Technology 2020 & 2033
- Table 20: Global Industrial Radiography Equipment Industry Volume K Unit Forecast, by Technology 2020 & 2033
- Table 21: Global Industrial Radiography Equipment Industry Revenue billion Forecast, by End-user Industry 2020 & 2033
- Table 22: Global Industrial Radiography Equipment Industry Volume K Unit Forecast, by End-user Industry 2020 & 2033
- Table 23: Global Industrial Radiography Equipment Industry Revenue billion Forecast, by Country 2020 & 2033
- Table 24: Global Industrial Radiography Equipment Industry Volume K Unit Forecast, by Country 2020 & 2033
- Table 25: Global Industrial Radiography Equipment Industry Revenue billion Forecast, by Offering 2020 & 2033
- Table 26: Global Industrial Radiography Equipment Industry Volume K Unit Forecast, by Offering 2020 & 2033
- Table 27: Global Industrial Radiography Equipment Industry Revenue billion Forecast, by Technology 2020 & 2033
- Table 28: Global Industrial Radiography Equipment Industry Volume K Unit Forecast, by Technology 2020 & 2033
- Table 29: Global Industrial Radiography Equipment Industry Revenue billion Forecast, by End-user Industry 2020 & 2033
- Table 30: Global Industrial Radiography Equipment Industry Volume K Unit Forecast, by End-user Industry 2020 & 2033
- Table 31: Global Industrial Radiography Equipment Industry Revenue billion Forecast, by Country 2020 & 2033
- Table 32: Global Industrial Radiography Equipment Industry Volume K Unit Forecast, by Country 2020 & 2033
- Table 33: Global Industrial Radiography Equipment Industry Revenue billion Forecast, by Offering 2020 & 2033
- Table 34: Global Industrial Radiography Equipment Industry Volume K Unit Forecast, by Offering 2020 & 2033
- Table 35: Global Industrial Radiography Equipment Industry Revenue billion Forecast, by Technology 2020 & 2033
- Table 36: Global Industrial Radiography Equipment Industry Volume K Unit Forecast, by Technology 2020 & 2033
- Table 37: Global Industrial Radiography Equipment Industry Revenue billion Forecast, by End-user Industry 2020 & 2033
- Table 38: Global Industrial Radiography Equipment Industry Volume K Unit Forecast, by End-user Industry 2020 & 2033
- Table 39: Global Industrial Radiography Equipment Industry Revenue billion Forecast, by Country 2020 & 2033
- Table 40: Global Industrial Radiography Equipment Industry Volume K Unit Forecast, by Country 2020 & 2033
- Table 41: Global Industrial Radiography Equipment Industry Revenue billion Forecast, by Offering 2020 & 2033
- Table 42: Global Industrial Radiography Equipment Industry Volume K Unit Forecast, by Offering 2020 & 2033
- Table 43: Global Industrial Radiography Equipment Industry Revenue billion Forecast, by Technology 2020 & 2033
- Table 44: Global Industrial Radiography Equipment Industry Volume K Unit Forecast, by Technology 2020 & 2033
- Table 45: Global Industrial Radiography Equipment Industry Revenue billion Forecast, by End-user Industry 2020 & 2033
- Table 46: Global Industrial Radiography Equipment Industry Volume K Unit Forecast, by End-user Industry 2020 & 2033
- Table 47: Global Industrial Radiography Equipment Industry Revenue billion Forecast, by Country 2020 & 2033
- Table 48: Global Industrial Radiography Equipment Industry Volume K Unit Forecast, by Country 2020 & 2033
Frequently Asked Questions
1. What is the projected Compound Annual Growth Rate (CAGR) of the Industrial Radiography Equipment Industry?
The projected CAGR is approximately 8.6%.
2. Which companies are prominent players in the Industrial Radiography Equipment Industry?
Key companies in the market include Bosello High Technology SRL, Canon Inc, Nikon Corporation, L3Harris Security & Detection Systems, Vidisco Ltd, Dürr NDT Gmbh & Co KG, Teledyne Dalsa Inc, North Star Imaging Inc, YXLON International, Hamamatsu Photonics K K, Carestream Health Inc, Hitachi Ltd, General Electric Company, Olympus Corporation, Rigaku Corporation.
3. What are the main segments of the Industrial Radiography Equipment Industry?
The market segments include Offering, Technology, End-user Industry.
4. Can you provide details about the market size?
The market size is estimated to be USD 1.35 billion as of 2022.
5. What are some drivers contributing to market growth?
; Growing Demand for Portable and Miniaturized Equipment; Recovering Demand from the Oil and Gas Industry.
6. What are the notable trends driving market growth?
Recovering Demand from Oil and Gas Industry will Drive the Market.
7. Are there any restraints impacting market growth?
Lack in Awareness.
8. Can you provide examples of recent developments in the market?
N/A
9. What pricing options are available for accessing the report?
Pricing options include single-user, multi-user, and enterprise licenses priced at USD 4750, USD 5250, and USD 8750 respectively.
10. Is the market size provided in terms of value or volume?
The market size is provided in terms of value, measured in billion and volume, measured in K Unit.
11. Are there any specific market keywords associated with the report?
Yes, the market keyword associated with the report is "Industrial Radiography Equipment Industry," which aids in identifying and referencing the specific market segment covered.
12. How do I determine which pricing option suits my needs best?
The pricing options vary based on user requirements and access needs. Individual users may opt for single-user licenses, while businesses requiring broader access may choose multi-user or enterprise licenses for cost-effective access to the report.
13. Are there any additional resources or data provided in the Industrial Radiography Equipment Industry report?
While the report offers comprehensive insights, it's advisable to review the specific contents or supplementary materials provided to ascertain if additional resources or data are available.
14. How can I stay updated on further developments or reports in the Industrial Radiography Equipment Industry?
To stay informed about further developments, trends, and reports in the Industrial Radiography Equipment Industry, consider subscribing to industry newsletters, following relevant companies and organizations, or regularly checking reputable industry news sources and publications.
Methodology
Step 1 - Identification of Relevant Samples Size from Population Database


Step 2 - Approaches for Defining Global Market Size (Value, Volume* & Price*)

Note*: In applicable scenarios
Step 3 - Data Sources
Primary Research
- Web Analytics
- Survey Reports
- Research Institute
- Latest Research Reports
- Opinion Leaders
Secondary Research
- Annual Reports
- White Paper
- Latest Press Release
- Industry Association
- Paid Database
- Investor Presentations

Step 4 - Data Triangulation
Involves using different sources of information in order to increase the validity of a study
These sources are likely to be stakeholders in a program - participants, other researchers, program staff, other community members, and so on.
Then we put all data in single framework & apply various statistical tools to find out the dynamic on the market.
During the analysis stage, feedback from the stakeholder groups would be compared to determine areas of agreement as well as areas of divergence