

Key Insights
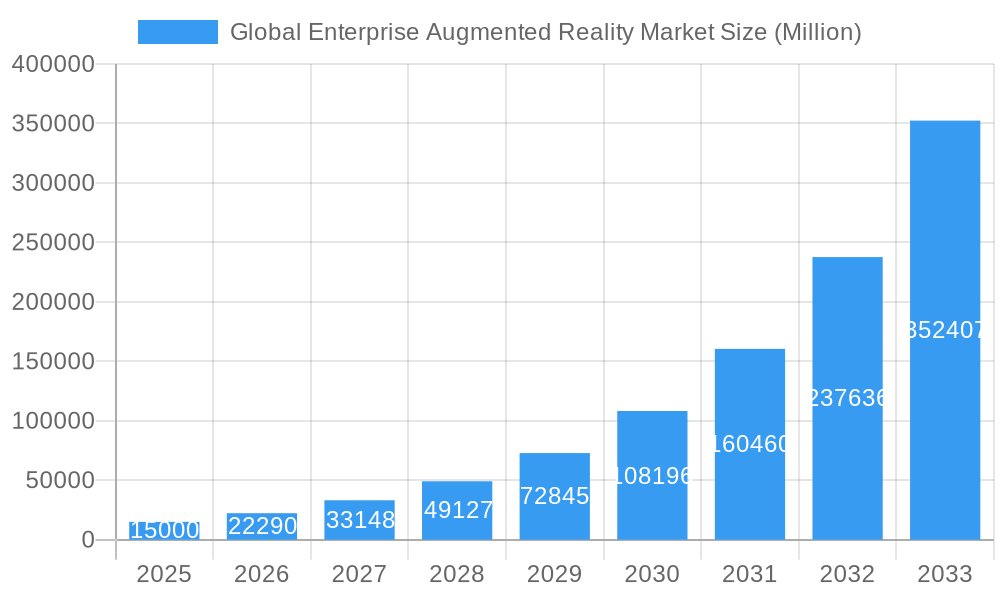
The global enterprise augmented reality (AR) market is experiencing explosive growth, projected to reach a substantial size driven by the increasing adoption of AR technologies across various sectors. The compound annual growth rate (CAGR) of 48.60% from 2019 to 2025 indicates a rapidly expanding market, fueled by several key factors. Firstly, the convergence of affordable hardware, sophisticated software, and robust 5G networks has lowered the barrier to entry for businesses of all sizes. Secondly, the compelling use cases across diverse industries – from enhancing retail experiences and streamlining e-commerce operations to revolutionizing industrial maintenance, improving training efficacy in education (e-learning), and optimizing complex processes in automotive and aerospace – are driving strong demand. Furthermore, the increasing availability of cloud-based AR platforms simplifies deployment and reduces upfront investment costs, making AR solutions more accessible to a broader range of enterprises. The strong focus on improving worker efficiency, reducing operational costs, and creating innovative customer experiences is propelling this growth. This market expansion is not limited geographically; North America and Europe are leading the charge currently, with the Asia-Pacific region poised for significant future growth driven by increasing technological adoption and economic development.
Global Enterprise Augmented Reality Market Market Size (In Billion)
However, certain challenges persist. The relatively high initial cost of implementation for some enterprise-grade AR systems, the need for specialized training to effectively utilize AR solutions, and concerns around data security and privacy can impede wider adoption. Despite these restraints, the ongoing advancements in AR technology, coupled with the growing recognition of its transformative potential across various industries, position the enterprise AR market for sustained and remarkable growth throughout the forecast period (2025-2033). This growth trajectory will likely see further market segmentation as niche applications and customized solutions are developed to address the specific needs of different industries and business models. Companies like PTC (Vuforia), Microsoft (HoloLens), and others are leading the development and commercialization of these applications.
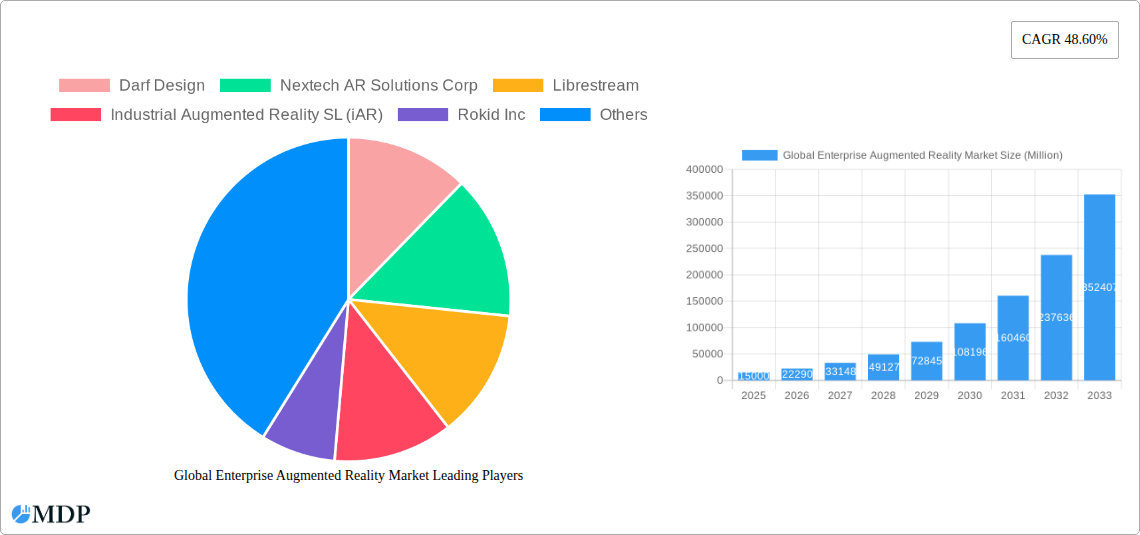
Global Enterprise Augmented Reality Market Company Market Share
Global Enterprise Augmented Reality Market Report: 2019-2033
Dive deep into the burgeoning Global Enterprise Augmented Reality Market with this comprehensive report, offering actionable insights for investors, industry stakeholders, and strategists. This in-depth analysis covers the period from 2019 to 2033, with a focus on 2025, providing a robust understanding of market dynamics, trends, and future projections. Expect detailed breakdowns by end-user segments (Retail & E-commerce, Education, Industrial, Automotive & Aerospace, Professional Services, and Other) and insightful profiles of leading players like Darf Design, Nextech AR Solutions Corp, and more. The report also analyzes key milestones, market challenges, and emerging opportunities within this rapidly evolving technological landscape. Download now to gain a competitive edge!
Global Enterprise Augmented Reality Market Dynamics & Concentration
The Global Enterprise Augmented Reality (AR) Market is experiencing significant growth, driven by technological advancements and increasing adoption across diverse sectors. Market concentration is moderate, with several key players competing for market share. Innovation is a key driver, with companies constantly developing new AR hardware and software solutions. Regulatory frameworks are still evolving, creating both opportunities and challenges. Product substitutes, such as Virtual Reality (VR) technologies, exist but offer different functionalities. End-user trends demonstrate a shift toward more immersive and integrated AR experiences. Mergers and acquisitions (M&A) activity is relatively high, indicating consolidation within the market.
- Market Share: The top 5 players hold an estimated xx% of the market share in 2025, indicating a moderately concentrated market.
- M&A Activity: An estimated xx M&A deals occurred between 2019-2024, demonstrating significant industry consolidation.
- Innovation Drivers: Advancements in computer vision, sensor technology, and processing power are key factors.
- Regulatory Landscape: Government regulations concerning data privacy and security are shaping market development.
Global Enterprise Augmented Reality Market Industry Trends & Analysis
The Global Enterprise AR market exhibits a robust Compound Annual Growth Rate (CAGR) of xx% during the forecast period (2025-2033). This growth is fueled by several factors. The increasing demand for enhanced user experiences across industries, coupled with falling hardware costs and the rising adoption of cloud-based AR solutions, is driving market penetration. Technological disruptions, such as the integration of Artificial Intelligence (AI) and 5G, are further propelling market expansion. Consumer preferences are shifting toward more interactive and intuitive AR experiences, influencing product development. Competitive dynamics are characterized by innovation, strategic partnerships, and a focus on developing niche applications within specific industry verticals. The market penetration rate for enterprise AR solutions in the industrial sector is projected to reach xx% by 2033.
Leading Markets & Segments in Global Enterprise Augmented Reality Market
The Industrial sector currently dominates the Global Enterprise AR Market, followed by Retail and E-commerce and Automotive & Aerospace. North America and Europe are leading regional markets.
- Industrial: High adoption due to increased productivity and efficiency gains.
- Key Drivers: Automation needs, remote expertise requirements, and improved training programs.
- Retail & E-commerce: Virtual try-on features and enhanced product visualization drive growth.
- Key Drivers: Enhanced customer experiences and improved sales conversion rates.
- Automotive & Aerospace: AR supports design, manufacturing, and maintenance processes.
- Key Drivers: Complex product development processes and demand for advanced quality control.
The dominance of the Industrial segment is attributed to the significant cost savings and efficiency improvements that AR technology offers in manufacturing, maintenance, and training. North America’s leading position reflects early adoption and the presence of major technology companies and established industries.
Global Enterprise Augmented Reality Market Product Developments
Recent product innovations focus on lighter, more comfortable AR headsets, improved software integration, and enhanced user interfaces. New applications are constantly emerging, ranging from remote collaboration and training to augmented reality-based design and manufacturing. Companies are focusing on developing solutions that offer superior ease of use, affordability, and integration with existing enterprise systems, which is enhancing market competitiveness.
Key Drivers of Global Enterprise Augmented Reality Market Growth
Several factors drive the growth of the Global Enterprise AR Market. Technological advancements, such as improved AR hardware and software, are paramount. Economic benefits, including increased productivity and reduced operational costs, also contribute significantly. Favorable government regulations and initiatives supporting technological innovation further boost the market.
Challenges in the Global Enterprise Augmented Reality Market Market
The Global Enterprise AR Market faces several challenges. High initial investment costs and a lack of skilled personnel can hinder wider adoption. Supply chain disruptions related to hardware components can impact market growth. Intense competition among established and emerging players necessitates constant innovation and competitive pricing strategies. These challenges present a combined impact estimated to reduce the projected market growth by approximately xx Million by 2033.
Emerging Opportunities in Global Enterprise Augmented Reality Market
The long-term growth of the Global Enterprise AR Market is fueled by various opportunities. Technological breakthroughs, such as advancements in AI and 5G integration, will create new applications and enhance user experiences. Strategic partnerships between technology companies and industry leaders will facilitate wider adoption and market expansion. Emerging markets in developing countries present significant untapped potential for growth.
Leading Players in the Global Enterprise Augmented Reality Market Sector
- Darf Design
- Nextech AR Solutions Corp
- Librestream
- Industrial Augmented Reality SL (iAR)
- Rokid Inc
- Dynabook Americas Inc
- Dalux
- Vuzix Corporation
- Epson America Inc (Seiko Epson Corporation)
- Plutomen Technologies Pvt Ltd
- Lenovo Corporation
- Atheer Inc
- ThirdEye
- Vuforia (PTC Inc)
Key Milestones in Global Enterprise Augmented Reality Market Industry
- November 2021: Qualcomm and Lenovo partnered to launch a new augmented reality platform combining Snapdragon Spaces and ThinkReality A3 smart glasses. This significantly broadened developer access to AR technologies.
- May 2022: ThirdEye launched a decentralized AR 3D social network, emphasizing user data control and real-world AR object placement. This innovative approach expands the potential applications of AR beyond enterprise use.
Strategic Outlook for Global Enterprise Augmented Reality Market Market
The future of the Global Enterprise AR Market is exceptionally bright. Continued technological innovation, coupled with growing industry adoption across various sectors, points to substantial long-term growth. Strategic partnerships, focused investments in research and development, and the exploration of new application areas will further fuel market expansion. The market presents significant opportunities for companies that can effectively leverage technological advancements and adapt to evolving end-user needs. The projected market value could exceed xx Million by 2033.
Global Enterprise Augmented Reality Market Segmentation
-
1. End-user
- 1.1. Retail and E-commerce
- 1.2. Education (E-learning)
- 1.3. Industrial
- 1.4. Automotive and Aerospace
- 1.5. Professional Services
- 1.6. Other
Global Enterprise Augmented Reality Market Segmentation By Geography
- 1. North America
- 2. Europe
- 3. Asia Pacific
- 4. Rest of the World
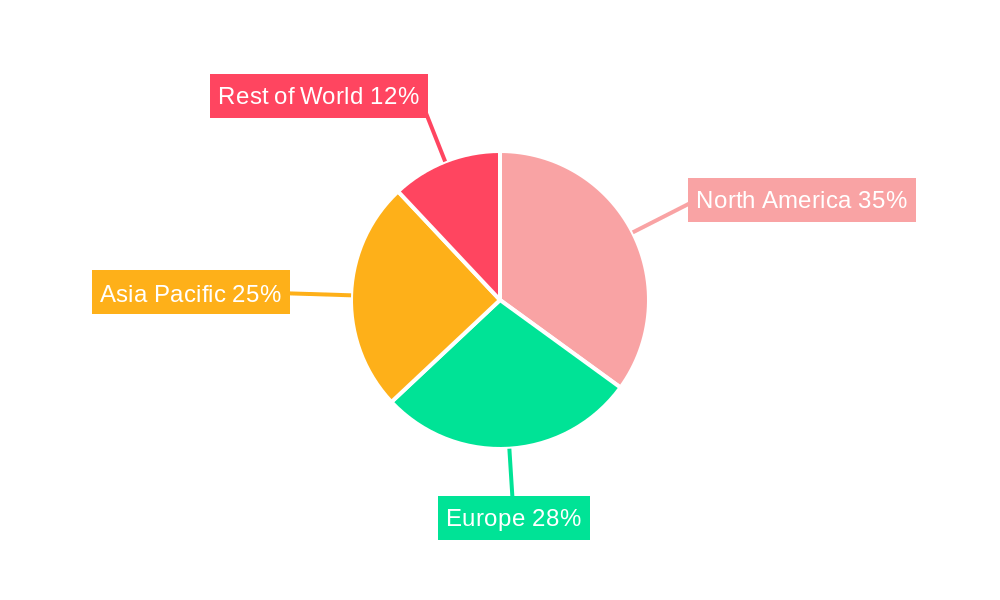
Global Enterprise Augmented Reality Market Regional Market Share
Geographic Coverage of Global Enterprise Augmented Reality Market
Global Enterprise Augmented Reality Market REPORT HIGHLIGHTS
| Aspects | Details |
|---|---|
| Study Period | 2020-2034 |
| Base Year | 2025 |
| Estimated Year | 2026 |
| Forecast Period | 2026-2034 |
| Historical Period | 2020-2025 |
| Growth Rate | CAGR of 43% from 2020-2034 |
| Segmentation |
|
Table of Contents
- 1. Introduction
- 1.1. Research Scope
- 1.2. Market Segmentation
- 1.3. Research Methodology
- 1.4. Definitions and Assumptions
- 2. Executive Summary
- 2.1. Introduction
- 3. Market Dynamics
- 3.1. Introduction
- 3.2. Market Drivers
- 3.2.1. Higher Effectiveness and Efficacy of AR Applications; High Demand for Mobile-based Augmented Reality
- 3.3. Market Restrains
- 3.3.1. Increased Demand for Outsourcing and Automation in Pharmaceutical Manufacturing
- 3.4. Market Trends
- 3.4.1. Demand for Mobile-base AR is Expected to Witness Significant Growth
- 4. Market Factor Analysis
- 4.1. Porters Five Forces
- 4.2. Supply/Value Chain
- 4.3. PESTEL analysis
- 4.4. Market Entropy
- 4.5. Patent/Trademark Analysis
- 5. Global Enterprise Augmented Reality Market Analysis, Insights and Forecast, 2020-2032
- 5.1. Market Analysis, Insights and Forecast - by End-user
- 5.1.1. Retail and E-commerce
- 5.1.2. Education (E-learning)
- 5.1.3. Industrial
- 5.1.4. Automotive and Aerospace
- 5.1.5. Professional Services
- 5.1.6. Other
- 5.2. Market Analysis, Insights and Forecast - by Region
- 5.2.1. North America
- 5.2.2. Europe
- 5.2.3. Asia Pacific
- 5.2.4. Rest of the World
- 5.1. Market Analysis, Insights and Forecast - by End-user
- 6. North America Global Enterprise Augmented Reality Market Analysis, Insights and Forecast, 2020-2032
- 6.1. Market Analysis, Insights and Forecast - by End-user
- 6.1.1. Retail and E-commerce
- 6.1.2. Education (E-learning)
- 6.1.3. Industrial
- 6.1.4. Automotive and Aerospace
- 6.1.5. Professional Services
- 6.1.6. Other
- 6.1. Market Analysis, Insights and Forecast - by End-user
- 7. Europe Global Enterprise Augmented Reality Market Analysis, Insights and Forecast, 2020-2032
- 7.1. Market Analysis, Insights and Forecast - by End-user
- 7.1.1. Retail and E-commerce
- 7.1.2. Education (E-learning)
- 7.1.3. Industrial
- 7.1.4. Automotive and Aerospace
- 7.1.5. Professional Services
- 7.1.6. Other
- 7.1. Market Analysis, Insights and Forecast - by End-user
- 8. Asia Pacific Global Enterprise Augmented Reality Market Analysis, Insights and Forecast, 2020-2032
- 8.1. Market Analysis, Insights and Forecast - by End-user
- 8.1.1. Retail and E-commerce
- 8.1.2. Education (E-learning)
- 8.1.3. Industrial
- 8.1.4. Automotive and Aerospace
- 8.1.5. Professional Services
- 8.1.6. Other
- 8.1. Market Analysis, Insights and Forecast - by End-user
- 9. Rest of the World Global Enterprise Augmented Reality Market Analysis, Insights and Forecast, 2020-2032
- 9.1. Market Analysis, Insights and Forecast - by End-user
- 9.1.1. Retail and E-commerce
- 9.1.2. Education (E-learning)
- 9.1.3. Industrial
- 9.1.4. Automotive and Aerospace
- 9.1.5. Professional Services
- 9.1.6. Other
- 9.1. Market Analysis, Insights and Forecast - by End-user
- 10. Competitive Analysis
- 10.1. Market Share Analysis 2025
- 10.2. Company Profiles
- 10.2.1 Darf Design
- 10.2.1.1. Overview
- 10.2.1.2. Products
- 10.2.1.3. SWOT Analysis
- 10.2.1.4. Recent Developments
- 10.2.1.5. Financials (Based on Availability)
- 10.2.2 Nextech AR Solutions Corp
- 10.2.2.1. Overview
- 10.2.2.2. Products
- 10.2.2.3. SWOT Analysis
- 10.2.2.4. Recent Developments
- 10.2.2.5. Financials (Based on Availability)
- 10.2.3 Librestream
- 10.2.3.1. Overview
- 10.2.3.2. Products
- 10.2.3.3. SWOT Analysis
- 10.2.3.4. Recent Developments
- 10.2.3.5. Financials (Based on Availability)
- 10.2.4 Industrial Augmented Reality SL (iAR)
- 10.2.4.1. Overview
- 10.2.4.2. Products
- 10.2.4.3. SWOT Analysis
- 10.2.4.4. Recent Developments
- 10.2.4.5. Financials (Based on Availability)
- 10.2.5 Rokid Inc
- 10.2.5.1. Overview
- 10.2.5.2. Products
- 10.2.5.3. SWOT Analysis
- 10.2.5.4. Recent Developments
- 10.2.5.5. Financials (Based on Availability)
- 10.2.6 Dynabook Americas Inc
- 10.2.6.1. Overview
- 10.2.6.2. Products
- 10.2.6.3. SWOT Analysis
- 10.2.6.4. Recent Developments
- 10.2.6.5. Financials (Based on Availability)
- 10.2.7 Dalux
- 10.2.7.1. Overview
- 10.2.7.2. Products
- 10.2.7.3. SWOT Analysis
- 10.2.7.4. Recent Developments
- 10.2.7.5. Financials (Based on Availability)
- 10.2.8 Vuzix Corporation
- 10.2.8.1. Overview
- 10.2.8.2. Products
- 10.2.8.3. SWOT Analysis
- 10.2.8.4. Recent Developments
- 10.2.8.5. Financials (Based on Availability)
- 10.2.9 Epson America Inc (Seiko Epson Corporation)
- 10.2.9.1. Overview
- 10.2.9.2. Products
- 10.2.9.3. SWOT Analysis
- 10.2.9.4. Recent Developments
- 10.2.9.5. Financials (Based on Availability)
- 10.2.10 Plutomen Technologies Pvt Ltd
- 10.2.10.1. Overview
- 10.2.10.2. Products
- 10.2.10.3. SWOT Analysis
- 10.2.10.4. Recent Developments
- 10.2.10.5. Financials (Based on Availability)
- 10.2.11 Lenovo Corporation
- 10.2.11.1. Overview
- 10.2.11.2. Products
- 10.2.11.3. SWOT Analysis
- 10.2.11.4. Recent Developments
- 10.2.11.5. Financials (Based on Availability)
- 10.2.12 Atheer Inc
- 10.2.12.1. Overview
- 10.2.12.2. Products
- 10.2.12.3. SWOT Analysis
- 10.2.12.4. Recent Developments
- 10.2.12.5. Financials (Based on Availability)
- 10.2.13 ThirdEye
- 10.2.13.1. Overview
- 10.2.13.2. Products
- 10.2.13.3. SWOT Analysis
- 10.2.13.4. Recent Developments
- 10.2.13.5. Financials (Based on Availability)
- 10.2.14 Vuforia (PTC Inc )
- 10.2.14.1. Overview
- 10.2.14.2. Products
- 10.2.14.3. SWOT Analysis
- 10.2.14.4. Recent Developments
- 10.2.14.5. Financials (Based on Availability)
- 10.2.1 Darf Design
List of Figures
- Figure 1: Global Global Enterprise Augmented Reality Market Revenue Breakdown (undefined, %) by Region 2025 & 2033
- Figure 2: North America Global Enterprise Augmented Reality Market Revenue (undefined), by End-user 2025 & 2033
- Figure 3: North America Global Enterprise Augmented Reality Market Revenue Share (%), by End-user 2025 & 2033
- Figure 4: North America Global Enterprise Augmented Reality Market Revenue (undefined), by Country 2025 & 2033
- Figure 5: North America Global Enterprise Augmented Reality Market Revenue Share (%), by Country 2025 & 2033
- Figure 6: Europe Global Enterprise Augmented Reality Market Revenue (undefined), by End-user 2025 & 2033
- Figure 7: Europe Global Enterprise Augmented Reality Market Revenue Share (%), by End-user 2025 & 2033
- Figure 8: Europe Global Enterprise Augmented Reality Market Revenue (undefined), by Country 2025 & 2033
- Figure 9: Europe Global Enterprise Augmented Reality Market Revenue Share (%), by Country 2025 & 2033
- Figure 10: Asia Pacific Global Enterprise Augmented Reality Market Revenue (undefined), by End-user 2025 & 2033
- Figure 11: Asia Pacific Global Enterprise Augmented Reality Market Revenue Share (%), by End-user 2025 & 2033
- Figure 12: Asia Pacific Global Enterprise Augmented Reality Market Revenue (undefined), by Country 2025 & 2033
- Figure 13: Asia Pacific Global Enterprise Augmented Reality Market Revenue Share (%), by Country 2025 & 2033
- Figure 14: Rest of the World Global Enterprise Augmented Reality Market Revenue (undefined), by End-user 2025 & 2033
- Figure 15: Rest of the World Global Enterprise Augmented Reality Market Revenue Share (%), by End-user 2025 & 2033
- Figure 16: Rest of the World Global Enterprise Augmented Reality Market Revenue (undefined), by Country 2025 & 2033
- Figure 17: Rest of the World Global Enterprise Augmented Reality Market Revenue Share (%), by Country 2025 & 2033
List of Tables
- Table 1: Global Enterprise Augmented Reality Market Revenue undefined Forecast, by End-user 2020 & 2033
- Table 2: Global Enterprise Augmented Reality Market Revenue undefined Forecast, by Region 2020 & 2033
- Table 3: Global Enterprise Augmented Reality Market Revenue undefined Forecast, by End-user 2020 & 2033
- Table 4: Global Enterprise Augmented Reality Market Revenue undefined Forecast, by Country 2020 & 2033
- Table 5: Global Enterprise Augmented Reality Market Revenue undefined Forecast, by End-user 2020 & 2033
- Table 6: Global Enterprise Augmented Reality Market Revenue undefined Forecast, by Country 2020 & 2033
- Table 7: Global Enterprise Augmented Reality Market Revenue undefined Forecast, by End-user 2020 & 2033
- Table 8: Global Enterprise Augmented Reality Market Revenue undefined Forecast, by Country 2020 & 2033
- Table 9: Global Enterprise Augmented Reality Market Revenue undefined Forecast, by End-user 2020 & 2033
- Table 10: Global Enterprise Augmented Reality Market Revenue undefined Forecast, by Country 2020 & 2033
Frequently Asked Questions
1. What is the projected Compound Annual Growth Rate (CAGR) of the Global Enterprise Augmented Reality Market?
The projected CAGR is approximately 43%.
2. Which companies are prominent players in the Global Enterprise Augmented Reality Market?
Key companies in the market include Darf Design, Nextech AR Solutions Corp, Librestream, Industrial Augmented Reality SL (iAR), Rokid Inc, Dynabook Americas Inc, Dalux, Vuzix Corporation, Epson America Inc (Seiko Epson Corporation), Plutomen Technologies Pvt Ltd, Lenovo Corporation, Atheer Inc, ThirdEye, Vuforia (PTC Inc ).
3. What are the main segments of the Global Enterprise Augmented Reality Market?
The market segments include End-user.
4. Can you provide details about the market size?
The market size is estimated to be USD XXX N/A as of 2022.
5. What are some drivers contributing to market growth?
Higher Effectiveness and Efficacy of AR Applications; High Demand for Mobile-based Augmented Reality.
6. What are the notable trends driving market growth?
Demand for Mobile-base AR is Expected to Witness Significant Growth.
7. Are there any restraints impacting market growth?
Increased Demand for Outsourcing and Automation in Pharmaceutical Manufacturing.
8. Can you provide examples of recent developments in the market?
May 2022 - ThirdEye, an Augmented Reality & Artificial Intelligence (AR/AI) solution, has launched a decentralized Augmented Reality (AR) 3D social network for consumers, where they have control over their data and will be able to place virtual AR objects in the real world
9. What pricing options are available for accessing the report?
Pricing options include single-user, multi-user, and enterprise licenses priced at USD 4750, USD 5250, and USD 8750 respectively.
10. Is the market size provided in terms of value or volume?
The market size is provided in terms of value, measured in N/A.
11. Are there any specific market keywords associated with the report?
Yes, the market keyword associated with the report is "Global Enterprise Augmented Reality Market," which aids in identifying and referencing the specific market segment covered.
12. How do I determine which pricing option suits my needs best?
The pricing options vary based on user requirements and access needs. Individual users may opt for single-user licenses, while businesses requiring broader access may choose multi-user or enterprise licenses for cost-effective access to the report.
13. Are there any additional resources or data provided in the Global Enterprise Augmented Reality Market report?
While the report offers comprehensive insights, it's advisable to review the specific contents or supplementary materials provided to ascertain if additional resources or data are available.
14. How can I stay updated on further developments or reports in the Global Enterprise Augmented Reality Market?
To stay informed about further developments, trends, and reports in the Global Enterprise Augmented Reality Market, consider subscribing to industry newsletters, following relevant companies and organizations, or regularly checking reputable industry news sources and publications.
Methodology
Step 1 - Identification of Relevant Samples Size from Population Database


Step 2 - Approaches for Defining Global Market Size (Value, Volume* & Price*)

Note*: In applicable scenarios
Step 3 - Data Sources
Primary Research
- Web Analytics
- Survey Reports
- Research Institute
- Latest Research Reports
- Opinion Leaders
Secondary Research
- Annual Reports
- White Paper
- Latest Press Release
- Industry Association
- Paid Database
- Investor Presentations

Step 4 - Data Triangulation
Involves using different sources of information in order to increase the validity of a study
These sources are likely to be stakeholders in a program - participants, other researchers, program staff, other community members, and so on.
Then we put all data in single framework & apply various statistical tools to find out the dynamic on the market.
During the analysis stage, feedback from the stakeholder groups would be compared to determine areas of agreement as well as areas of divergence