

Key Insights
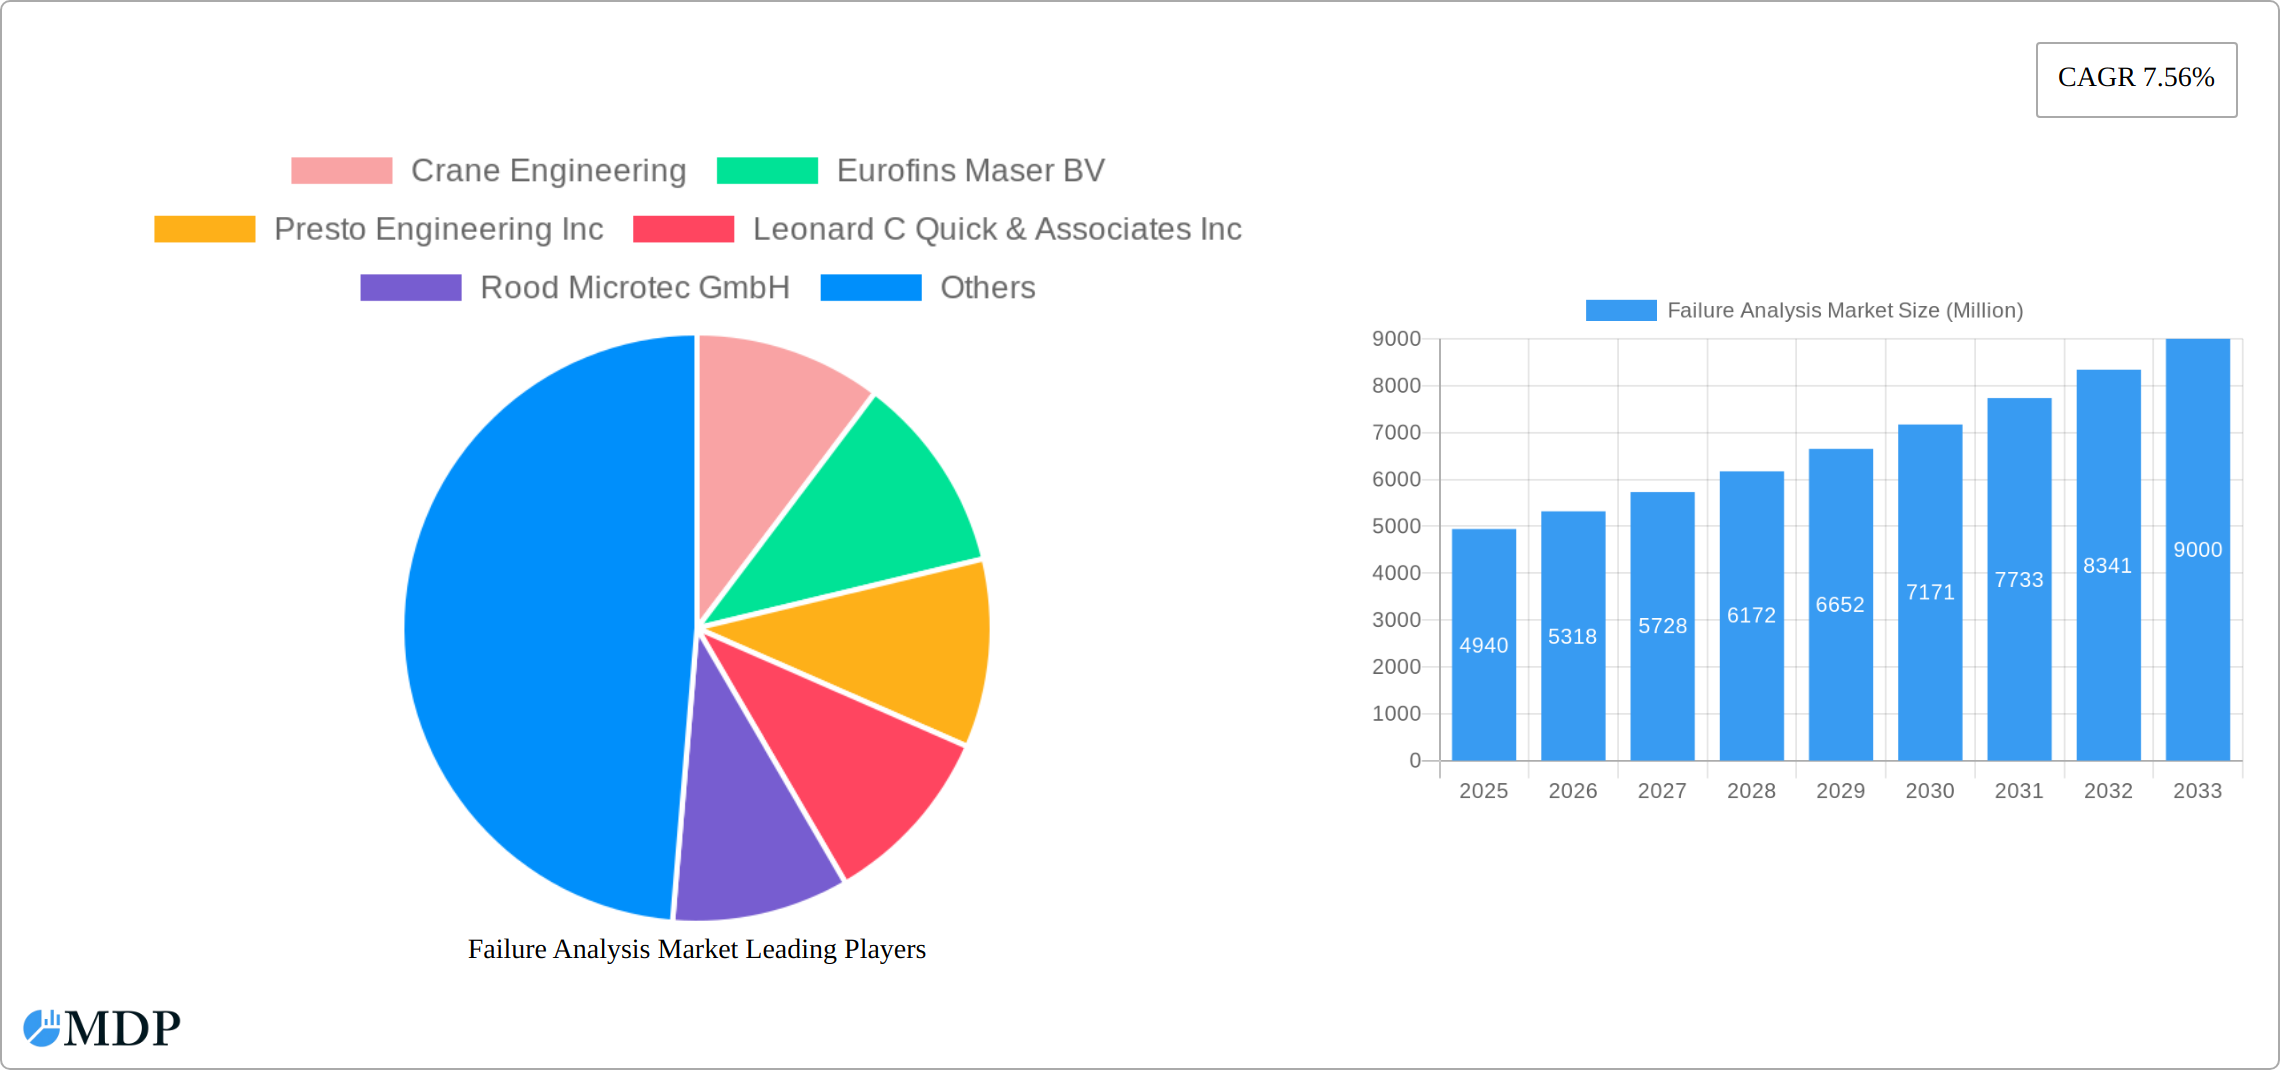
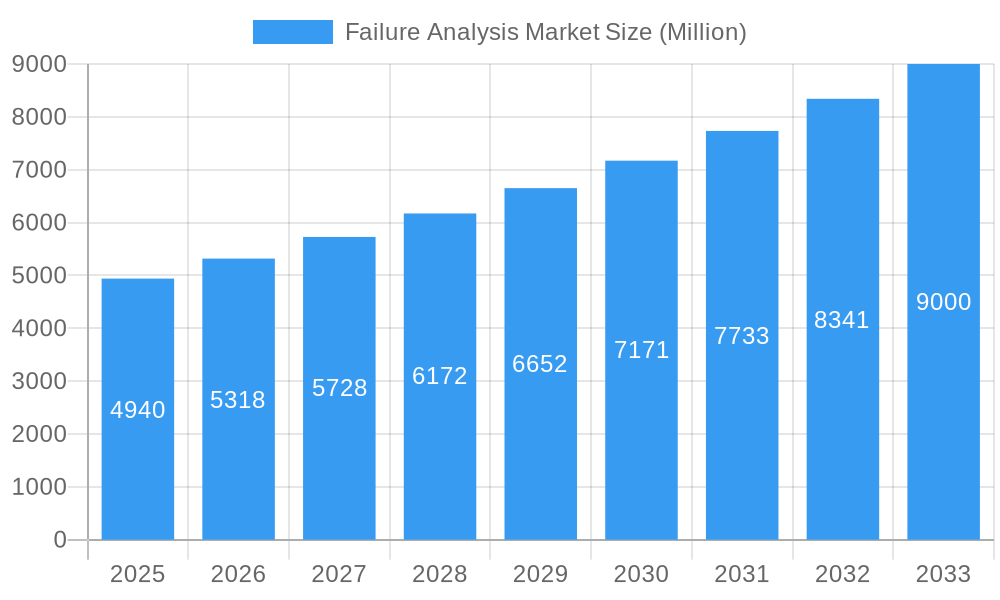
The Failure Analysis market, valued at $4.94 billion in 2025, is projected to experience robust growth, driven by increasing demand for advanced materials and miniaturized electronics across diverse industries. The Compound Annual Growth Rate (CAGR) of 7.56% from 2025 to 2033 indicates a significant expansion in market size, reaching an estimated $9.2 billion by 2033. Key growth drivers include the rising complexity of electronic components, stringent quality control requirements in manufacturing, and the growing need for preventative maintenance in sectors like automotive and aerospace. Technological advancements in techniques such as Scanning Electron Microscopy (SEM), Focused Ion Beam (FIB), and Secondary Ion Mass Spectrometry (SIMS) are further fueling market expansion. The automotive and electronics & semiconductor industries are expected to remain major end-users, while emerging applications in renewable energy and medical devices are also anticipated to contribute to market growth. However, high equipment costs and the need for specialized expertise can act as potential restraints. Segmentation by equipment type (SEM, TEM, FIB, etc.), end-user vertical, and technology reveals diverse opportunities across different application areas. Regions such as North America and Europe currently hold significant market share, driven by robust research & development activities and well-established manufacturing industries. However, the Asia-Pacific region is projected to witness faster growth due to rising manufacturing activities and increasing investments in advanced technologies.
Failure Analysis Market Market Size (In Billion)
The competitive landscape is characterized by a mix of established players and specialized service providers. Companies like Eurofins EAG Laboratories, TUV SUD, and others provide comprehensive failure analysis services, while equipment manufacturers contribute to the market through the sale and maintenance of advanced analytical tools. The market is likely to see increased consolidation in the coming years as companies seek to expand their service offerings and geographic reach. Furthermore, the increasing adoption of cloud-based solutions and automation technologies within failure analysis will influence the market's future trajectory, allowing for greater efficiency and accessibility of these critical services. The ongoing demand for improved product reliability and the rising need for quicker turnaround times for failure analysis will create a positive outlook for the market's long-term growth.
Failure Analysis Market Company Market Share
Failure Analysis Market: A Comprehensive Report (2019-2033)
This comprehensive report provides an in-depth analysis of the Failure Analysis Market, offering invaluable insights for stakeholders across the value chain. With a study period spanning 2019-2033, a base year of 2025, and a forecast period of 2025-2033, this report leverages historical data (2019-2024) to project future market trends and opportunities. The report covers key market segments, including equipment (SEM, FIB, TEM, Dual Beam, Other), end-user verticals (Automotive, Oil & Gas, Defense, Construction, Manufacturing, Electronics & Semiconductors, Other), and technologies (SIMS, EDX, CMP, SPM, FIB, RIE, Other). Leading players like Crane Engineering, Eurofins Maser BV, and Exponent Inc. are profiled, providing a holistic understanding of the competitive landscape. The report's value lies in its detailed analysis of market dynamics, industry trends, leading segments, and future opportunities, all underpinned by robust data and insightful commentary.
Failure Analysis Market Market Dynamics & Concentration
The Failure Analysis Market is characterized by a moderately concentrated landscape, with a few dominant players establishing significant market share through substantial investments in advanced technology and specialized human capital. While specific figures remain proprietary, industry analysis suggests that the top tier of companies collectively commands a substantial portion of the global market. This concentration is directly linked to the high capital expenditure required for cutting-edge analytical instrumentation, such as advanced electron microscopes and sophisticated spectroscopic devices, alongside the necessity for highly skilled personnel. Nevertheless, the market is a hotbed of continuous innovation, with ongoing advancements in microscopy (e.g., cryo-EM, in-situ microscopy) and spectroscopy (e.g., Raman, LIBS) significantly enhancing the precision and depth of failure investigations. Furthermore, evolving and increasingly stringent regulatory mandates across industries, particularly concerning environmental stewardship, product safety, and robust data integrity and security protocols, are shaping market operations and driving demand for reliable analysis. The competitive arena also faces pressure from the ongoing development and adoption of alternative methodologies, notably non-destructive testing (NDT) techniques, which offer complementary insights without compromising sample integrity. End-user imperatives, including the relentless drive towards product miniaturization and the pursuit of ever-higher performance benchmarks in sectors ranging from electronics and aerospace to medical devices, are powerful catalysts for market growth. Mergers and acquisitions (M&A) have been a notable feature, albeit at a measured pace, with a consistent pattern of strategic consolidation observed between 2019 and 2024. These transactions are primarily aimed at bolstering technological portfolios, acquiring specialized expertise, and extending geographical footprints to cater to a global client base.
- Market Concentration: A concentrated market structure where leading companies hold a significant share, driven by high entry barriers and technological expertise.
- Innovation Drivers: Continuous advancements in high-resolution microscopy (e.g., SEM, TEM, FIB-SEM), advanced spectroscopy techniques (e.g., XPS, EDX, SIMS), and the burgeoning integration of AI and machine learning for automated data interpretation and predictive analysis.
- Regulatory Frameworks: Stringent global and regional regulations governing product safety, environmental impact, and data privacy, necessitating meticulous failure analysis for compliance.
- Competitive Landscape: Influenced by the development and adoption of complementary non-destructive testing (NDT) methods, such as ultrasound and X-ray, which offer alternative approaches to material assessment.
- End-User Trends: Growing demand for enhanced product reliability, extended lifespan, and performance optimization, particularly in sectors focused on miniaturization and high-performance components.
- M&A Activity: A strategic trend focused on expanding technological capabilities, enhancing service offerings, and achieving greater market reach through targeted acquisitions.
Failure Analysis Market Industry Trends & Analysis
The Failure Analysis Market is poised for substantial expansion, projecting a robust Compound Annual Growth Rate (CAGR) of approximately xx% over the forecast period (2025-2033). This impressive growth trajectory is underpinned by the escalating demand for advanced materials and increasingly intricate components across a diverse spectrum of industries, including semiconductors, aerospace, automotive, and healthcare. Technological disruptions, particularly the profound integration of Artificial Intelligence (AI) and Machine Learning (ML) into data analysis workflows, are revolutionizing the field by significantly augmenting the efficiency, accuracy, and speed of failure investigations. This transformative trend is further amplified by the widespread adoption of sophisticated analytical techniques such as Secondary Ion Mass Spectrometry (SIMS) and Focused Ion Beam (FIB), which provide unparalleled granular insights into material composition, microstructure, and defect origins. Consumer and industrial expectations are demonstrably shifting towards products that exhibit greater reliability and longevity, thereby intensifying the imperative for comprehensive and precise failure analysis. The competitive dynamics within the market are characterized by intense rivalry, compelling companies to prioritize relentless innovation, forge strategic partnerships, and pursue synergistic acquisitions as key strategies for solidifying and expanding their market presence. The penetration of advanced analytical solutions, such as state-of-the-art Dual Beam systems, is experiencing steady growth, with an anticipated market penetration rate of approximately xx% by the year 2033, indicating a strong industry-wide commitment to adopting cutting-edge technologies.
Leading Markets & Segments in Failure Analysis Market
The Electronics and Semiconductors segment dominates the Failure Analysis Market, accounting for approximately xx% of the total market value in 2025, followed by the Automotive sector. North America and Europe remain the leading geographical markets, driven by a robust manufacturing base and high adoption of advanced technologies. Within equipment, Scanning Electron Microscopes (SEM) currently hold the largest market share, attributed to their versatility and relatively lower cost compared to other techniques.
- Key Drivers in Electronics & Semiconductors: High demand for miniaturization, increasing complexity of devices.
- Key Drivers in Automotive: Stringent safety and reliability standards, advancements in electric vehicles.
- Geographic Dominance: North America and Europe.
- Equipment Segment Dominance: Scanning Electron Microscopes (SEM).
Regional and Segmental Breakdown (2025 estimates): (Note: Specific percentage breakdowns are proprietary to the full report; xx represents predicted values).
- By Equipment: SEM (xx%), FIB (xx%), TEM (xx%), Dual Beam (xx%), Other (xx%).
- By End-user Vertical: Electronics & Semiconductors (xx%), Automotive (xx%), Oil & Gas (xx%), Defense (xx%), Others (xx%).
- By Technology: EDX (xx%), SIMS (xx%), FIB (xx%), Other (xx%).
Failure Analysis Market Product Developments
Recent advancements in failure analysis include the integration of AI for automated defect detection and analysis, improved resolution and speed in microscopy techniques, and the development of miniaturized and portable equipment for on-site analysis. These innovations provide enhanced efficiency, improved accuracy, and greater flexibility, enabling faster turnaround times and cost-effective solutions for various industries. The market is also seeing a growing adoption of cloud-based platforms for data storage and analysis, facilitating collaboration and data sharing.
Key Drivers of Failure Analysis Market Growth
The sustained growth of the Failure Analysis Market is propelled by a confluence of pivotal factors. Foremost among these are the continuous technological advancements in analytical instrumentation, particularly in high-resolution microscopy and sophisticated spectroscopy, which are enabling unprecedented levels of detail and diagnostic capability. The escalating complexity and sophistication of products across numerous industrial sectors necessitate advanced failure analysis techniques to ensure optimal reliability, performance, and safety. Moreover, increasingly stringent industry regulations and compliance standards mandate thorough and accurate failure analysis to guarantee product safety, efficacy, and adherence to legal requirements. The accelerating adoption of novel and advanced materials, including high-performance composites, advanced alloys, and nanomaterials, introduces unique challenges that require specialized and often bespoke failure analysis methodologies.
Challenges in the Failure Analysis Market Market
The market faces challenges such as high equipment costs, the need for specialized expertise, and potential supply chain disruptions impacting the availability of crucial components. The complexity of analysis can sometimes lead to lengthy turnaround times, impacting efficiency. Competitive pressures from substitute technologies and the emergence of new players also pose a challenge. We estimate that supply chain disruptions caused a xx Million decrease in market revenue in 2022.
Emerging Opportunities in Failure Analysis Market
The Failure Analysis Market is ripe with emerging opportunities, notably driven by the transformative potential of integrating Artificial Intelligence (AI) and Machine Learning (ML) into analytical processes. These technologies promise to automate complex tasks, enhance the precision and speed of failure root cause identification, and enable predictive failure analysis. Strategic alliances and collaborations between leading equipment manufacturers and specialized service providers are poised to unlock opportunities for developing holistic and end-to-end solutions tailored to the intricate needs of diverse industrial applications. Furthermore, the expansion into nascent and rapidly developing economies with burgeoning manufacturing sectors presents a significant avenue for market growth and penetration. The ongoing global emphasis on sustainability and the development of novel, eco-friendly materials are also creating a demand for new and innovative analytical techniques, offering fertile ground for research and development within the failure analysis domain.
Leading Players in the Failure Analysis Market Sector
- Crane Engineering
- Eurofins Maser BV
- Presto Engineering Inc
- Leonard C Quick & Associates Inc
- Rood Microtec GmbH
- McDowell Owens Engineering Inc
- NanoScope Services Ltd
- Exponent Inc
- CoreTest Technologies
- Eurofins EAG Laboratories
- Materials Testing
- TUV SUD
Key Milestones in Failure Analysis Market Industry
- June 2024: The critical infrastructure failure exemplified by the Atlanta water main break underscored the vital importance of robust inspection protocols and advanced failure analysis techniques, signaling a potential surge in demand for related services and technologies.
- April 2024: Advancements showcased in the 14ACMOS project, focusing on next-generation semiconductor manufacturing, highlighted the critical need for highly sophisticated, nanoscale-resolution failure analysis methodologies capable of inspecting and diagnosing defects at atomic and molecular levels.
Strategic Outlook for Failure Analysis Market Market
The Failure Analysis Market is poised for continued growth, driven by technological advancements, increasing product complexity, and rising demand for higher reliability and safety across diverse industries. Strategic investments in R&D, strategic partnerships, and expansion into new geographic markets will be key to success. The integration of AI and cloud-based solutions will shape the future of the industry, creating opportunities for data-driven insights and enhanced efficiency. The market's future potential is significant, with an expected market size of xx Million by 2033.
Failure Analysis Market Segmentation
-
1. Technology
- 1.1. Secondary ION Mass Spectrometry (SIMS)
- 1.2. Energy Dispersive X-ray Spectroscopy (EDX)
- 1.3. Chemical Mechanical Planarization (CMP)
- 1.4. Scanning Probe Microscopy
- 1.5. Focused Ion Beam (FIB)
- 1.6. Relative Ion Etching (RIE)
- 1.7. Other Technologies
-
2. Equipment
- 2.1. Scanning Electron Microscope (SEM)
- 2.2. Focused Ion Beam (FIB) System
- 2.3. Transmission Electron Microscope (TEM)
- 2.4. Dual Beam System
- 2.5. Other Equipment
-
3. End-user Vertical
- 3.1. Automotive
- 3.2. Oil and Gas
- 3.3. Defense
- 3.4. Construction
- 3.5. Manufacturing
- 3.6. Electronics and Semiconductors
- 3.7. Other End-user Verticals
Failure Analysis Market Segmentation By Geography
- 1. North America
- 2. Europe
- 3. Asia
- 4. Australia and New Zealand
- 5. Latin America
- 6. Middle East and Africa
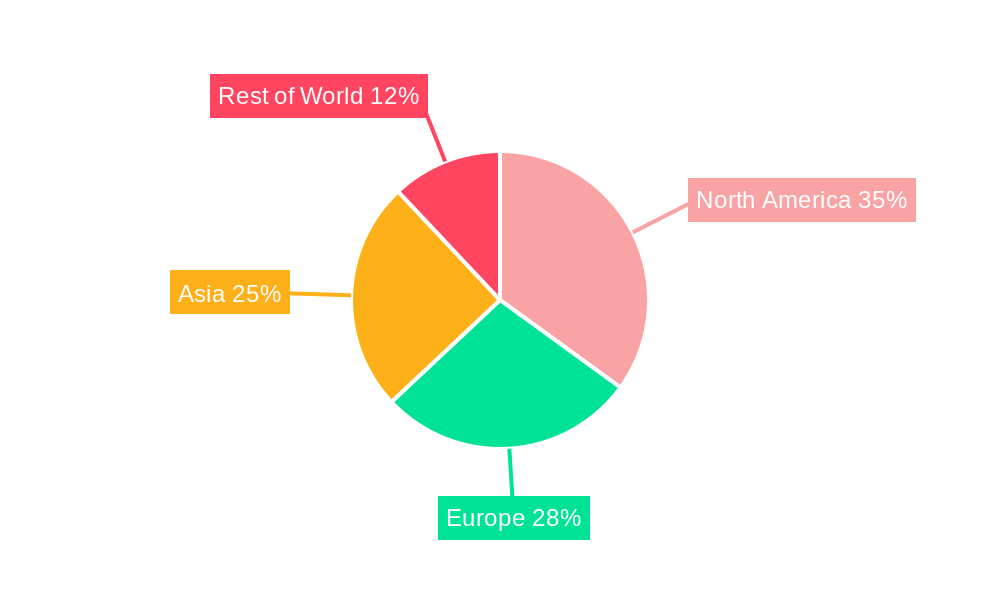
Failure Analysis Market Regional Market Share
Geographic Coverage of Failure Analysis Market
Failure Analysis Market REPORT HIGHLIGHTS
| Aspects | Details |
|---|---|
| Study Period | 2020-2034 |
| Base Year | 2025 |
| Estimated Year | 2026 |
| Forecast Period | 2026-2034 |
| Historical Period | 2020-2025 |
| Growth Rate | CAGR of 7.56% from 2020-2034 |
| Segmentation |
|
Table of Contents
- 1. Introduction
- 1.1. Research Scope
- 1.2. Market Segmentation
- 1.3. Research Objective
- 1.4. Definitions and Assumptions
- 2. Executive Summary
- 2.1. Market Snapshot
- 3. Market Dynamics
- 3.1. Market Drivers
- 3.2. Market Restrains
- 3.3. Market Trends
- 3.4. Market Opportunities
- 4. Market Factor Analysis
- 4.1. Porters Five Forces
- 4.1.1. Bargaining Power of Suppliers
- 4.1.2. Bargaining Power of Buyers
- 4.1.3. Threat of New Entrants
- 4.1.4. Threat of Substitutes
- 4.1.5. Competitive Rivalry
- 4.2. PESTEL analysis
- 4.3. BCG Analysis
- 4.3.1. Stars (High Growth, High Market Share)
- 4.3.2. Cash Cows (Low Growth, High Market Share)
- 4.3.3. Question Mark (High Growth, Low Market Share)
- 4.3.4. Dogs (Low Growth, Low Market Share)
- 4.4. Ansoff Matrix Analysis
- 4.5. Supply Chain Analysis
- 4.6. Regulatory Landscape
- 4.7. Current Market Potential and Opportunity Assessment (TAM–SAM–SOM Framework)
- 4.8. MDP Analyst Note
- 4.1. Porters Five Forces
- 5. Market Analysis, Insights and Forecast 2021-2033
- 5.1. Market Analysis, Insights and Forecast - by Technology
- 5.1.1. Secondary ION Mass Spectrometry (SIMS)
- 5.1.2. Energy Dispersive X-ray Spectroscopy (EDX)
- 5.1.3. Chemical Mechanical Planarization (CMP)
- 5.1.4. Scanning Probe Microscopy
- 5.1.5. Focused Ion Beam (FIB)
- 5.1.6. Relative Ion Etching (RIE)
- 5.1.7. Other Technologies
- 5.2. Market Analysis, Insights and Forecast - by Equipment
- 5.2.1. Scanning Electron Microscope (SEM)
- 5.2.2. Focused Ion Beam (FIB) System
- 5.2.3. Transmission Electron Microscope (TEM)
- 5.2.4. Dual Beam System
- 5.2.5. Other Equipment
- 5.3. Market Analysis, Insights and Forecast - by End-user Vertical
- 5.3.1. Automotive
- 5.3.2. Oil and Gas
- 5.3.3. Defense
- 5.3.4. Construction
- 5.3.5. Manufacturing
- 5.3.6. Electronics and Semiconductors
- 5.3.7. Other End-user Verticals
- 5.4. Market Analysis, Insights and Forecast - by Region
- 5.4.1. North America
- 5.4.2. Europe
- 5.4.3. Asia
- 5.4.4. Australia and New Zealand
- 5.4.5. Latin America
- 5.4.6. Middle East and Africa
- 5.1. Market Analysis, Insights and Forecast - by Technology
- 6. Global Failure Analysis Market Analysis, Insights and Forecast, 2021-2033
- 6.1. Market Analysis, Insights and Forecast - by Technology
- 6.1.1. Secondary ION Mass Spectrometry (SIMS)
- 6.1.2. Energy Dispersive X-ray Spectroscopy (EDX)
- 6.1.3. Chemical Mechanical Planarization (CMP)
- 6.1.4. Scanning Probe Microscopy
- 6.1.5. Focused Ion Beam (FIB)
- 6.1.6. Relative Ion Etching (RIE)
- 6.1.7. Other Technologies
- 6.2. Market Analysis, Insights and Forecast - by Equipment
- 6.2.1. Scanning Electron Microscope (SEM)
- 6.2.2. Focused Ion Beam (FIB) System
- 6.2.3. Transmission Electron Microscope (TEM)
- 6.2.4. Dual Beam System
- 6.2.5. Other Equipment
- 6.3. Market Analysis, Insights and Forecast - by End-user Vertical
- 6.3.1. Automotive
- 6.3.2. Oil and Gas
- 6.3.3. Defense
- 6.3.4. Construction
- 6.3.5. Manufacturing
- 6.3.6. Electronics and Semiconductors
- 6.3.7. Other End-user Verticals
- 6.1. Market Analysis, Insights and Forecast - by Technology
- 7. North America Failure Analysis Market Analysis, Insights and Forecast, 2020-2032
- 7.1. Market Analysis, Insights and Forecast - by Technology
- 7.1.1. Secondary ION Mass Spectrometry (SIMS)
- 7.1.2. Energy Dispersive X-ray Spectroscopy (EDX)
- 7.1.3. Chemical Mechanical Planarization (CMP)
- 7.1.4. Scanning Probe Microscopy
- 7.1.5. Focused Ion Beam (FIB)
- 7.1.6. Relative Ion Etching (RIE)
- 7.1.7. Other Technologies
- 7.2. Market Analysis, Insights and Forecast - by Equipment
- 7.2.1. Scanning Electron Microscope (SEM)
- 7.2.2. Focused Ion Beam (FIB) System
- 7.2.3. Transmission Electron Microscope (TEM)
- 7.2.4. Dual Beam System
- 7.2.5. Other Equipment
- 7.3. Market Analysis, Insights and Forecast - by End-user Vertical
- 7.3.1. Automotive
- 7.3.2. Oil and Gas
- 7.3.3. Defense
- 7.3.4. Construction
- 7.3.5. Manufacturing
- 7.3.6. Electronics and Semiconductors
- 7.3.7. Other End-user Verticals
- 7.1. Market Analysis, Insights and Forecast - by Technology
- 8. Europe Failure Analysis Market Analysis, Insights and Forecast, 2020-2032
- 8.1. Market Analysis, Insights and Forecast - by Technology
- 8.1.1. Secondary ION Mass Spectrometry (SIMS)
- 8.1.2. Energy Dispersive X-ray Spectroscopy (EDX)
- 8.1.3. Chemical Mechanical Planarization (CMP)
- 8.1.4. Scanning Probe Microscopy
- 8.1.5. Focused Ion Beam (FIB)
- 8.1.6. Relative Ion Etching (RIE)
- 8.1.7. Other Technologies
- 8.2. Market Analysis, Insights and Forecast - by Equipment
- 8.2.1. Scanning Electron Microscope (SEM)
- 8.2.2. Focused Ion Beam (FIB) System
- 8.2.3. Transmission Electron Microscope (TEM)
- 8.2.4. Dual Beam System
- 8.2.5. Other Equipment
- 8.3. Market Analysis, Insights and Forecast - by End-user Vertical
- 8.3.1. Automotive
- 8.3.2. Oil and Gas
- 8.3.3. Defense
- 8.3.4. Construction
- 8.3.5. Manufacturing
- 8.3.6. Electronics and Semiconductors
- 8.3.7. Other End-user Verticals
- 8.1. Market Analysis, Insights and Forecast - by Technology
- 9. Asia Failure Analysis Market Analysis, Insights and Forecast, 2020-2032
- 9.1. Market Analysis, Insights and Forecast - by Technology
- 9.1.1. Secondary ION Mass Spectrometry (SIMS)
- 9.1.2. Energy Dispersive X-ray Spectroscopy (EDX)
- 9.1.3. Chemical Mechanical Planarization (CMP)
- 9.1.4. Scanning Probe Microscopy
- 9.1.5. Focused Ion Beam (FIB)
- 9.1.6. Relative Ion Etching (RIE)
- 9.1.7. Other Technologies
- 9.2. Market Analysis, Insights and Forecast - by Equipment
- 9.2.1. Scanning Electron Microscope (SEM)
- 9.2.2. Focused Ion Beam (FIB) System
- 9.2.3. Transmission Electron Microscope (TEM)
- 9.2.4. Dual Beam System
- 9.2.5. Other Equipment
- 9.3. Market Analysis, Insights and Forecast - by End-user Vertical
- 9.3.1. Automotive
- 9.3.2. Oil and Gas
- 9.3.3. Defense
- 9.3.4. Construction
- 9.3.5. Manufacturing
- 9.3.6. Electronics and Semiconductors
- 9.3.7. Other End-user Verticals
- 9.1. Market Analysis, Insights and Forecast - by Technology
- 10. Australia and New Zealand Failure Analysis Market Analysis, Insights and Forecast, 2020-2032
- 10.1. Market Analysis, Insights and Forecast - by Technology
- 10.1.1. Secondary ION Mass Spectrometry (SIMS)
- 10.1.2. Energy Dispersive X-ray Spectroscopy (EDX)
- 10.1.3. Chemical Mechanical Planarization (CMP)
- 10.1.4. Scanning Probe Microscopy
- 10.1.5. Focused Ion Beam (FIB)
- 10.1.6. Relative Ion Etching (RIE)
- 10.1.7. Other Technologies
- 10.2. Market Analysis, Insights and Forecast - by Equipment
- 10.2.1. Scanning Electron Microscope (SEM)
- 10.2.2. Focused Ion Beam (FIB) System
- 10.2.3. Transmission Electron Microscope (TEM)
- 10.2.4. Dual Beam System
- 10.2.5. Other Equipment
- 10.3. Market Analysis, Insights and Forecast - by End-user Vertical
- 10.3.1. Automotive
- 10.3.2. Oil and Gas
- 10.3.3. Defense
- 10.3.4. Construction
- 10.3.5. Manufacturing
- 10.3.6. Electronics and Semiconductors
- 10.3.7. Other End-user Verticals
- 10.1. Market Analysis, Insights and Forecast - by Technology
- 11. Latin America Failure Analysis Market Analysis, Insights and Forecast, 2020-2032
- 11.1. Market Analysis, Insights and Forecast - by Technology
- 11.1.1. Secondary ION Mass Spectrometry (SIMS)
- 11.1.2. Energy Dispersive X-ray Spectroscopy (EDX)
- 11.1.3. Chemical Mechanical Planarization (CMP)
- 11.1.4. Scanning Probe Microscopy
- 11.1.5. Focused Ion Beam (FIB)
- 11.1.6. Relative Ion Etching (RIE)
- 11.1.7. Other Technologies
- 11.2. Market Analysis, Insights and Forecast - by Equipment
- 11.2.1. Scanning Electron Microscope (SEM)
- 11.2.2. Focused Ion Beam (FIB) System
- 11.2.3. Transmission Electron Microscope (TEM)
- 11.2.4. Dual Beam System
- 11.2.5. Other Equipment
- 11.3. Market Analysis, Insights and Forecast - by End-user Vertical
- 11.3.1. Automotive
- 11.3.2. Oil and Gas
- 11.3.3. Defense
- 11.3.4. Construction
- 11.3.5. Manufacturing
- 11.3.6. Electronics and Semiconductors
- 11.3.7. Other End-user Verticals
- 11.1. Market Analysis, Insights and Forecast - by Technology
- 12. Middle East and Africa Failure Analysis Market Analysis, Insights and Forecast, 2020-2032
- 12.1. Market Analysis, Insights and Forecast - by Technology
- 12.1.1. Secondary ION Mass Spectrometry (SIMS)
- 12.1.2. Energy Dispersive X-ray Spectroscopy (EDX)
- 12.1.3. Chemical Mechanical Planarization (CMP)
- 12.1.4. Scanning Probe Microscopy
- 12.1.5. Focused Ion Beam (FIB)
- 12.1.6. Relative Ion Etching (RIE)
- 12.1.7. Other Technologies
- 12.2. Market Analysis, Insights and Forecast - by Equipment
- 12.2.1. Scanning Electron Microscope (SEM)
- 12.2.2. Focused Ion Beam (FIB) System
- 12.2.3. Transmission Electron Microscope (TEM)
- 12.2.4. Dual Beam System
- 12.2.5. Other Equipment
- 12.3. Market Analysis, Insights and Forecast - by End-user Vertical
- 12.3.1. Automotive
- 12.3.2. Oil and Gas
- 12.3.3. Defense
- 12.3.4. Construction
- 12.3.5. Manufacturing
- 12.3.6. Electronics and Semiconductors
- 12.3.7. Other End-user Verticals
- 12.1. Market Analysis, Insights and Forecast - by Technology
- 13. Competitive Analysis
- 13.1. Company Profiles
- 13.1.1 Crane Engineering
- 13.1.1.1. Company Overview
- 13.1.1.2. Products
- 13.1.1.3. Company Financials
- 13.1.1.4. SWOT Analysis
- 13.1.2 Eurofins Maser BV
- 13.1.2.1. Company Overview
- 13.1.2.2. Products
- 13.1.2.3. Company Financials
- 13.1.2.4. SWOT Analysis
- 13.1.3 Presto Engineering Inc
- 13.1.3.1. Company Overview
- 13.1.3.2. Products
- 13.1.3.3. Company Financials
- 13.1.3.4. SWOT Analysis
- 13.1.4 Leonard C Quick & Associates Inc
- 13.1.4.1. Company Overview
- 13.1.4.2. Products
- 13.1.4.3. Company Financials
- 13.1.4.4. SWOT Analysis
- 13.1.5 Rood Microtec GmbH
- 13.1.5.1. Company Overview
- 13.1.5.2. Products
- 13.1.5.3. Company Financials
- 13.1.5.4. SWOT Analysis
- 13.1.6 McDowell Owens Engineering Inc
- 13.1.6.1. Company Overview
- 13.1.6.2. Products
- 13.1.6.3. Company Financials
- 13.1.6.4. SWOT Analysis
- 13.1.7 NanoScope Services Ltd
- 13.1.7.1. Company Overview
- 13.1.7.2. Products
- 13.1.7.3. Company Financials
- 13.1.7.4. SWOT Analysis
- 13.1.8 Exponent Inc
- 13.1.8.1. Company Overview
- 13.1.8.2. Products
- 13.1.8.3. Company Financials
- 13.1.8.4. SWOT Analysis
- 13.1.9 CoreTest Technologies
- 13.1.9.1. Company Overview
- 13.1.9.2. Products
- 13.1.9.3. Company Financials
- 13.1.9.4. SWOT Analysis
- 13.1.10 Eurofins EAG Laboratories
- 13.1.10.1. Company Overview
- 13.1.10.2. Products
- 13.1.10.3. Company Financials
- 13.1.10.4. SWOT Analysis
- 13.1.11 Materials Testing
- 13.1.11.1. Company Overview
- 13.1.11.2. Products
- 13.1.11.3. Company Financials
- 13.1.11.4. SWOT Analysis
- 13.1.12 TUV SUD
- 13.1.12.1. Company Overview
- 13.1.12.2. Products
- 13.1.12.3. Company Financials
- 13.1.12.4. SWOT Analysis
- 13.1.1 Crane Engineering
- 13.2. Market Entropy
- 13.2.1 Company's Key Areas Served
- 13.2.2 Recent Developments
- 13.3. Company Market Share Analysis 2025
- 13.3.1 Top 5 Companies Market Share Analysis
- 13.3.2 Top 3 Companies Market Share Analysis
- 13.4. List of Potential Customers
- 14. Research Methodology
List of Figures
- Figure 1: Global Failure Analysis Market Revenue Breakdown (Million, %) by Region 2025 & 2033
- Figure 2: North America Failure Analysis Market Revenue (Million), by Technology 2025 & 2033
- Figure 3: North America Failure Analysis Market Revenue Share (%), by Technology 2025 & 2033
- Figure 4: North America Failure Analysis Market Revenue (Million), by Equipment 2025 & 2033
- Figure 5: North America Failure Analysis Market Revenue Share (%), by Equipment 2025 & 2033
- Figure 6: North America Failure Analysis Market Revenue (Million), by End-user Vertical 2025 & 2033
- Figure 7: North America Failure Analysis Market Revenue Share (%), by End-user Vertical 2025 & 2033
- Figure 8: North America Failure Analysis Market Revenue (Million), by Country 2025 & 2033
- Figure 9: North America Failure Analysis Market Revenue Share (%), by Country 2025 & 2033
- Figure 10: Europe Failure Analysis Market Revenue (Million), by Technology 2025 & 2033
- Figure 11: Europe Failure Analysis Market Revenue Share (%), by Technology 2025 & 2033
- Figure 12: Europe Failure Analysis Market Revenue (Million), by Equipment 2025 & 2033
- Figure 13: Europe Failure Analysis Market Revenue Share (%), by Equipment 2025 & 2033
- Figure 14: Europe Failure Analysis Market Revenue (Million), by End-user Vertical 2025 & 2033
- Figure 15: Europe Failure Analysis Market Revenue Share (%), by End-user Vertical 2025 & 2033
- Figure 16: Europe Failure Analysis Market Revenue (Million), by Country 2025 & 2033
- Figure 17: Europe Failure Analysis Market Revenue Share (%), by Country 2025 & 2033
- Figure 18: Asia Failure Analysis Market Revenue (Million), by Technology 2025 & 2033
- Figure 19: Asia Failure Analysis Market Revenue Share (%), by Technology 2025 & 2033
- Figure 20: Asia Failure Analysis Market Revenue (Million), by Equipment 2025 & 2033
- Figure 21: Asia Failure Analysis Market Revenue Share (%), by Equipment 2025 & 2033
- Figure 22: Asia Failure Analysis Market Revenue (Million), by End-user Vertical 2025 & 2033
- Figure 23: Asia Failure Analysis Market Revenue Share (%), by End-user Vertical 2025 & 2033
- Figure 24: Asia Failure Analysis Market Revenue (Million), by Country 2025 & 2033
- Figure 25: Asia Failure Analysis Market Revenue Share (%), by Country 2025 & 2033
- Figure 26: Australia and New Zealand Failure Analysis Market Revenue (Million), by Technology 2025 & 2033
- Figure 27: Australia and New Zealand Failure Analysis Market Revenue Share (%), by Technology 2025 & 2033
- Figure 28: Australia and New Zealand Failure Analysis Market Revenue (Million), by Equipment 2025 & 2033
- Figure 29: Australia and New Zealand Failure Analysis Market Revenue Share (%), by Equipment 2025 & 2033
- Figure 30: Australia and New Zealand Failure Analysis Market Revenue (Million), by End-user Vertical 2025 & 2033
- Figure 31: Australia and New Zealand Failure Analysis Market Revenue Share (%), by End-user Vertical 2025 & 2033
- Figure 32: Australia and New Zealand Failure Analysis Market Revenue (Million), by Country 2025 & 2033
- Figure 33: Australia and New Zealand Failure Analysis Market Revenue Share (%), by Country 2025 & 2033
- Figure 34: Latin America Failure Analysis Market Revenue (Million), by Technology 2025 & 2033
- Figure 35: Latin America Failure Analysis Market Revenue Share (%), by Technology 2025 & 2033
- Figure 36: Latin America Failure Analysis Market Revenue (Million), by Equipment 2025 & 2033
- Figure 37: Latin America Failure Analysis Market Revenue Share (%), by Equipment 2025 & 2033
- Figure 38: Latin America Failure Analysis Market Revenue (Million), by End-user Vertical 2025 & 2033
- Figure 39: Latin America Failure Analysis Market Revenue Share (%), by End-user Vertical 2025 & 2033
- Figure 40: Latin America Failure Analysis Market Revenue (Million), by Country 2025 & 2033
- Figure 41: Latin America Failure Analysis Market Revenue Share (%), by Country 2025 & 2033
- Figure 42: Middle East and Africa Failure Analysis Market Revenue (Million), by Technology 2025 & 2033
- Figure 43: Middle East and Africa Failure Analysis Market Revenue Share (%), by Technology 2025 & 2033
- Figure 44: Middle East and Africa Failure Analysis Market Revenue (Million), by Equipment 2025 & 2033
- Figure 45: Middle East and Africa Failure Analysis Market Revenue Share (%), by Equipment 2025 & 2033
- Figure 46: Middle East and Africa Failure Analysis Market Revenue (Million), by End-user Vertical 2025 & 2033
- Figure 47: Middle East and Africa Failure Analysis Market Revenue Share (%), by End-user Vertical 2025 & 2033
- Figure 48: Middle East and Africa Failure Analysis Market Revenue (Million), by Country 2025 & 2033
- Figure 49: Middle East and Africa Failure Analysis Market Revenue Share (%), by Country 2025 & 2033
List of Tables
- Table 1: Global Failure Analysis Market Revenue Million Forecast, by Technology 2020 & 2033
- Table 2: Global Failure Analysis Market Revenue Million Forecast, by Equipment 2020 & 2033
- Table 3: Global Failure Analysis Market Revenue Million Forecast, by End-user Vertical 2020 & 2033
- Table 4: Global Failure Analysis Market Revenue Million Forecast, by Region 2020 & 2033
- Table 5: Global Failure Analysis Market Revenue Million Forecast, by Technology 2020 & 2033
- Table 6: Global Failure Analysis Market Revenue Million Forecast, by Equipment 2020 & 2033
- Table 7: Global Failure Analysis Market Revenue Million Forecast, by End-user Vertical 2020 & 2033
- Table 8: Global Failure Analysis Market Revenue Million Forecast, by Country 2020 & 2033
- Table 9: Global Failure Analysis Market Revenue Million Forecast, by Technology 2020 & 2033
- Table 10: Global Failure Analysis Market Revenue Million Forecast, by Equipment 2020 & 2033
- Table 11: Global Failure Analysis Market Revenue Million Forecast, by End-user Vertical 2020 & 2033
- Table 12: Global Failure Analysis Market Revenue Million Forecast, by Country 2020 & 2033
- Table 13: Global Failure Analysis Market Revenue Million Forecast, by Technology 2020 & 2033
- Table 14: Global Failure Analysis Market Revenue Million Forecast, by Equipment 2020 & 2033
- Table 15: Global Failure Analysis Market Revenue Million Forecast, by End-user Vertical 2020 & 2033
- Table 16: Global Failure Analysis Market Revenue Million Forecast, by Country 2020 & 2033
- Table 17: Global Failure Analysis Market Revenue Million Forecast, by Technology 2020 & 2033
- Table 18: Global Failure Analysis Market Revenue Million Forecast, by Equipment 2020 & 2033
- Table 19: Global Failure Analysis Market Revenue Million Forecast, by End-user Vertical 2020 & 2033
- Table 20: Global Failure Analysis Market Revenue Million Forecast, by Country 2020 & 2033
- Table 21: Global Failure Analysis Market Revenue Million Forecast, by Technology 2020 & 2033
- Table 22: Global Failure Analysis Market Revenue Million Forecast, by Equipment 2020 & 2033
- Table 23: Global Failure Analysis Market Revenue Million Forecast, by End-user Vertical 2020 & 2033
- Table 24: Global Failure Analysis Market Revenue Million Forecast, by Country 2020 & 2033
- Table 25: Global Failure Analysis Market Revenue Million Forecast, by Technology 2020 & 2033
- Table 26: Global Failure Analysis Market Revenue Million Forecast, by Equipment 2020 & 2033
- Table 27: Global Failure Analysis Market Revenue Million Forecast, by End-user Vertical 2020 & 2033
- Table 28: Global Failure Analysis Market Revenue Million Forecast, by Country 2020 & 2033
Frequently Asked Questions
1. What is the projected Compound Annual Growth Rate (CAGR) of the Failure Analysis Market?
The projected CAGR is approximately 7.56%.
2. Which companies are prominent players in the Failure Analysis Market?
Key companies in the market include Crane Engineering, Eurofins Maser BV, Presto Engineering Inc, Leonard C Quick & Associates Inc, Rood Microtec GmbH, McDowell Owens Engineering Inc, NanoScope Services Ltd, Exponent Inc, CoreTest Technologies, Eurofins EAG Laboratories, Materials Testing, TUV SUD.
3. What are the main segments of the Failure Analysis Market?
The market segments include Technology, Equipment, End-user Vertical.
4. Can you provide details about the market size?
The market size is estimated to be USD 4.94 Million as of 2022.
5. What are some drivers contributing to market growth?
Ageing Infrastructure and Increasing Need for Maintenance; Technological Advancements Drive the Market Growth; Innovation in Materials. Design. and Production Methods.
6. What are the notable trends driving market growth?
Growth in the Construction Sector Boosting the Demand for Furniture Products.
7. Are there any restraints impacting market growth?
High Equipment Cost Challenge the Market.
8. Can you provide examples of recent developments in the market?
June 2024 - The Atlanta government announced a State of Emergency due to a water main break affecting businesses, schools, and hospitals in the midtown and downtown areas. This incident highlights the broader issue of aging infrastructure across North America. With over 2,600 miles of pipes, some of which are more than 100 years old, Atlanta faces major challenges in maintaining and upgrading its water network.
9. What pricing options are available for accessing the report?
Pricing options include single-user, multi-user, and enterprise licenses priced at USD 4750, USD 5250, and USD 8750 respectively.
10. Is the market size provided in terms of value or volume?
The market size is provided in terms of value, measured in Million.
11. Are there any specific market keywords associated with the report?
Yes, the market keyword associated with the report is "Failure Analysis Market," which aids in identifying and referencing the specific market segment covered.
12. How do I determine which pricing option suits my needs best?
The pricing options vary based on user requirements and access needs. Individual users may opt for single-user licenses, while businesses requiring broader access may choose multi-user or enterprise licenses for cost-effective access to the report.
13. Are there any additional resources or data provided in the Failure Analysis Market report?
While the report offers comprehensive insights, it's advisable to review the specific contents or supplementary materials provided to ascertain if additional resources or data are available.
14. How can I stay updated on further developments or reports in the Failure Analysis Market?
To stay informed about further developments, trends, and reports in the Failure Analysis Market, consider subscribing to industry newsletters, following relevant companies and organizations, or regularly checking reputable industry news sources and publications.
Methodology
Step 1 - Identification of Relevant Samples Size from Population Database


Step 2 - Approaches for Defining Global Market Size (Value, Volume* & Price*)

Note*: In applicable scenarios
Step 3 - Data Sources
Primary Research
- Web Analytics
- Survey Reports
- Research Institute
- Latest Research Reports
- Opinion Leaders
Secondary Research
- Annual Reports
- White Paper
- Latest Press Release
- Industry Association
- Paid Database
- Investor Presentations

Step 4 - Data Triangulation
Involves using different sources of information in order to increase the validity of a study
These sources are likely to be stakeholders in a program - participants, other researchers, program staff, other community members, and so on.
Then we put all data in single framework & apply various statistical tools to find out the dynamic on the market.
During the analysis stage, feedback from the stakeholder groups would be compared to determine areas of agreement as well as areas of divergence