

Key Insights
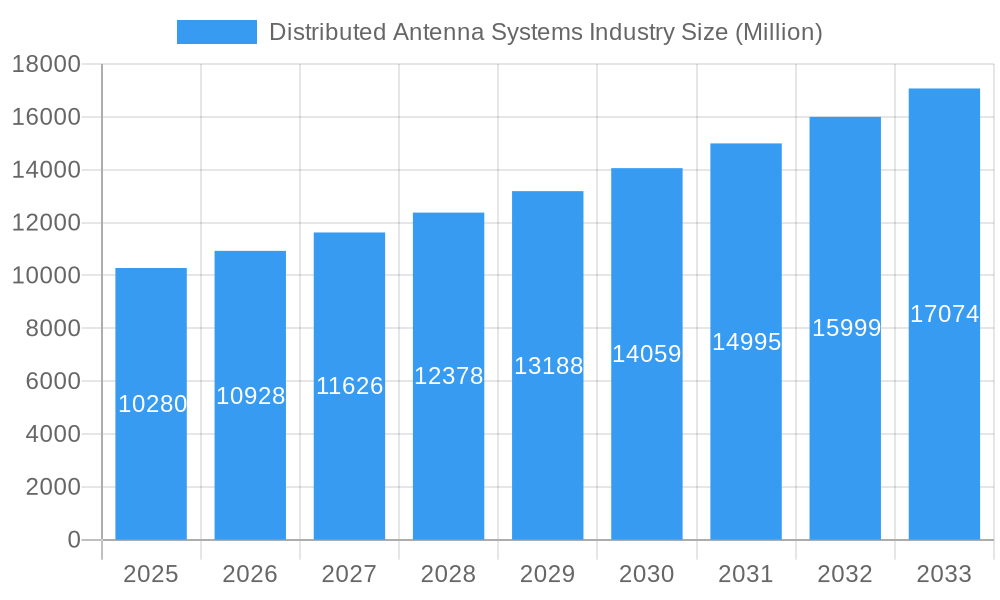
The Distributed Antenna Systems (DAS) market is experiencing robust growth, projected to reach a valuation of $10.28 billion in 2025, expanding at a Compound Annual Growth Rate (CAGR) of 6.03%. This expansion is fueled by several key drivers. The increasing demand for high-speed, reliable wireless connectivity across diverse sectors, including healthcare, manufacturing, and transportation, is a primary catalyst. The proliferation of 5G networks necessitates DAS deployments to ensure optimal signal coverage and capacity within dense urban areas and large indoor venues. Furthermore, the growing adoption of smart city initiatives and the rising need for enhanced public safety communications are contributing significantly to market growth. The market is segmented by application (enterprise DAS, public safety DAS, other applications), type (active, passive, digital, hybrid), and end-user (manufacturing, healthcare, government, transportation, sports & entertainment, telecommunications, others). Active DAS currently holds a significant market share due to its superior performance, but the adoption of digital and hybrid systems is gaining traction, driven by cost-effectiveness and advanced features. North America and Asia-Pacific are expected to remain leading regional markets, owing to significant investments in infrastructure development and the expanding user base. However, growing competition and the initial high cost of DAS deployment pose challenges to market growth.
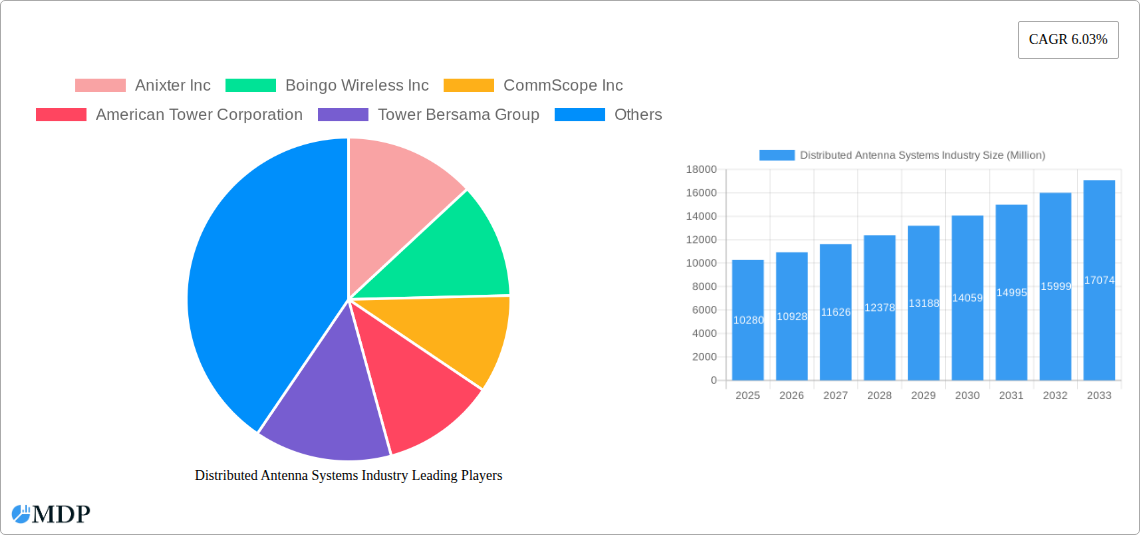
Distributed Antenna Systems Industry Market Size (In Billion)
Despite these challenges, the long-term outlook for the DAS industry remains positive. The ongoing technological advancements in DAS technology, such as the integration of Software Defined Networking (SDN) and Network Function Virtualization (NFV), are paving the way for more flexible, scalable, and cost-effective solutions. This is further encouraging the adoption of DAS in emerging markets. Furthermore, favorable government regulations and initiatives aimed at improving communication infrastructure are expected to stimulate market growth in the coming years. The competitive landscape comprises established players such as Anixter Inc, Boingo Wireless Inc, CommScope Inc, and American Tower Corporation, alongside several other regional and specialized companies. Their strategic initiatives, including mergers, acquisitions, and partnerships, will significantly shape the future of the DAS market. The forecast period from 2025 to 2033 promises sustained growth, driven by the convergence of technological innovation, increasing demand for better connectivity, and supportive regulatory environments.
Distributed Antenna Systems Industry Company Market Share
Distributed Antenna Systems (DAS) Industry Report: 2019-2033
This comprehensive report provides an in-depth analysis of the Distributed Antenna Systems (DAS) industry, covering market dynamics, leading players, technological advancements, and future growth prospects. With a study period spanning 2019-2033, a base year of 2025, and a forecast period of 2025-2033, this report is an invaluable resource for industry stakeholders, investors, and strategic decision-makers. The global DAS market is projected to reach xx Million by 2033, exhibiting a robust CAGR of xx% during the forecast period.
Distributed Antenna Systems Industry Market Dynamics & Concentration
The Distributed Antenna Systems (DAS) market is characterized by a moderately concentrated landscape with several key players vying for market share. Market concentration is influenced by factors such as technological innovation, regulatory frameworks, and the emergence of product substitutes. While precise market share data for each company requires further investigation, American Tower Corporation, CommScope Inc, and Corning Inc are among the leading players, holding a significant portion of the market. Mergers and acquisitions (M&A) activity has played a role in shaping the market landscape, with an estimated xx M&A deals recorded between 2019 and 2024.
- Innovation Drivers: The increasing demand for enhanced mobile broadband coverage, particularly in dense urban areas and large venues, is a major driver of innovation in DAS technology. The development of 5G networks is further fueling this trend.
- Regulatory Frameworks: Government regulations regarding spectrum allocation and infrastructure deployment significantly impact market growth. Favorable regulatory environments can accelerate market expansion.
- Product Substitutes: While DAS remains a dominant technology for improving cellular coverage, other technologies such as small cells and Wi-Fi are emerging as potential substitutes, impacting the competitive dynamics.
- End-User Trends: The increasing adoption of DAS across diverse end-user segments, including healthcare, manufacturing, and transportation, is driving market growth. The demand for reliable and high-speed connectivity is a key factor in this trend.
- M&A Activities: Consolidation within the industry through M&A activity is expected to continue, leading to larger, more integrated players with enhanced technological capabilities and broader market reach.
Distributed Antenna Systems Industry Industry Trends & Analysis
The DAS market is experiencing significant growth, driven by factors such as the expanding adoption of 5G networks, the increasing demand for improved indoor coverage, and the growing need for reliable communication in public safety applications. Technological advancements, such as the development of active and hybrid DAS systems, are enhancing the capabilities and efficiency of DAS deployments. Consumer preference for seamless connectivity across various locations and applications is another major growth driver. Competitive dynamics are characterized by ongoing innovation, strategic partnerships, and the consolidation of market players. The market penetration of DAS is expected to increase significantly over the forecast period, particularly in developing economies.
Leading Markets & Segments in Distributed Antenna Systems Industry
The North American region currently dominates the DAS market, driven by robust infrastructure development, significant investments in 5G networks, and the high demand for enhanced wireless coverage. However, Asia-Pacific is emerging as a rapidly expanding market, fueled by increasing urbanization and the growth of mobile subscribers.
Dominant Segments:
- Application: Enterprise DAS holds a substantial market share due to the rising need for reliable communication systems in businesses of all sizes. Public Safety DAS is another rapidly growing segment driven by government initiatives to improve emergency response capabilities.
- Type: Active DAS systems are currently dominant due to their superior performance and scalability. However, the adoption of hybrid and digital DAS systems is growing.
- End-User: The telecommunications sector is a major end-user of DAS systems, followed by the healthcare and transportation sectors. Growth in other end-user segments, such as manufacturing, sports and entertainment, and government is expected to drive future market expansion.
Key Drivers:
- Economic Policies: Government initiatives promoting infrastructure development and digital transformation are key drivers.
- Infrastructure: Existing cellular infrastructure limitations drive demand for DAS solutions.
Distributed Antenna Systems Industry Product Developments
Recent product developments in the DAS industry focus on enhancing performance, scalability, and integration with 5G networks. The trend is towards more advanced, intelligent DAS systems capable of adapting to changing network conditions and providing optimal coverage. Innovations in antenna design, signal processing, and remote management capabilities are driving product differentiation and competitive advantage. The market is also seeing a rise in hybrid DAS systems, which combine the benefits of both active and passive technologies, delivering optimized performance and cost-effectiveness.
Key Drivers of Distributed Antenna Systems Industry Growth
The growth of the DAS industry is primarily driven by several key factors: the increasing demand for improved wireless coverage, especially in dense urban areas and indoor environments; the rapid deployment of 5G networks, which requires enhanced infrastructure solutions; and the rising need for reliable communications in critical infrastructure sectors such as healthcare, public safety, and transportation. Technological advancements, favorable government regulations, and expanding applications in various industries are also contributing to market expansion.
Challenges in the Distributed Antenna Systems Industry Market
The DAS market faces several challenges, including high upfront investment costs, complex installation procedures, and potential interference issues. Regulatory hurdles related to spectrum allocation and infrastructure deployment can also impede growth. Furthermore, competition from alternative technologies, such as small cells, and supply chain constraints impact market dynamics. The complexity of integrating DAS with existing communication networks can also present a significant obstacle. The overall impact of these challenges varies depending on region and specific market segment, but they collectively affect market growth rate.
Emerging Opportunities in Distributed Antenna Systems Industry
The DAS market presents several significant growth opportunities. Technological advancements such as the integration of Artificial Intelligence (AI) and Machine Learning (ML) for network optimization present considerable potential. Strategic partnerships between DAS providers and mobile network operators (MNOs) can open new avenues for market expansion. Furthermore, the growing adoption of DAS in emerging markets and the increasing demand for private 5G networks are likely to create significant opportunities in the coming years. Expanding into new application segments and developing innovative solutions tailored to specific end-user needs will be critical.
Leading Players in the Distributed Antenna Systems Industry Sector
- Anixter Inc
- Boingo Wireless Inc
- CommScope Inc
- American Tower Corporation
- Tower Bersama Group
- Corning Inc
- TE Connectivity Ltd
- Comba Telecom Systems Holdings Ltd
- Antenna Products Corporation
- Cobham PLC
- SOLiD Inc
Key Milestones in Distributed Antenna Systems Industry Industry
- July 2023: American Tower Corporation and Xcel Energy Center announced the deployment of a 5G DAS solution at the arena, signifying a significant step in enhancing fan experience and showcasing the potential of DAS in large venues.
- October 2022: PROSE Technologies launched a new Active DAS system for 5G networks and its first 5G in-building DAS in a major commercial complex in Mumbai, highlighting the growing adoption of 5G DAS in both developed and emerging markets.
Strategic Outlook for Distributed Antenna Systems Industry Market
The future of the DAS market looks promising, driven by the continued rollout of 5G networks, increasing demand for improved wireless coverage, and the expansion of DAS applications across various industry sectors. Strategic partnerships, technological innovations, and expansion into new geographical markets will be crucial for sustained growth. The focus on delivering cost-effective, scalable, and easily deployable solutions will be key to achieving market leadership. The potential for integrating DAS with other technologies, such as IoT and edge computing, offers additional avenues for growth and innovation.
Distributed Antenna Systems Industry Segmentation
-
1. Type
- 1.1. Active
- 1.2. Passive
- 1.3. Digital
- 1.4. Hybrid
-
2. End-User
- 2.1. Manufacturing
- 2.2. Healthcare
- 2.3. Government
- 2.4. Transportation
- 2.5. Sports and Entertainment
- 2.6. Telecommunications
- 2.7. Other End-Users
-
3. Application
- 3.1. Enterprise DAS
- 3.2. Public Safety DAS
- 3.3. Other Applications
Distributed Antenna Systems Industry Segmentation By Geography
- 1. North America
- 2. Europe
- 3. Asia
- 4. Australia and New Zealand
- 5. Latin America
- 6. Middle East and Africa
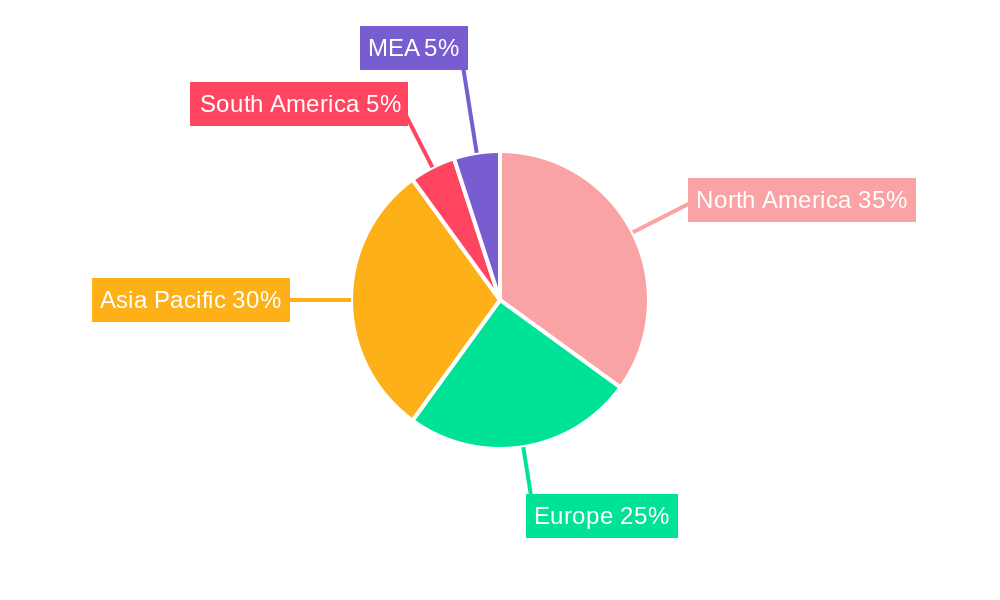
Distributed Antenna Systems Industry Regional Market Share
Geographic Coverage of Distributed Antenna Systems Industry
Distributed Antenna Systems Industry REPORT HIGHLIGHTS
| Aspects | Details |
|---|---|
| Study Period | 2020-2034 |
| Base Year | 2025 |
| Estimated Year | 2026 |
| Forecast Period | 2026-2034 |
| Historical Period | 2020-2025 |
| Growth Rate | CAGR of 6.03% from 2020-2034 |
| Segmentation |
|
Table of Contents
- 1. Introduction
- 1.1. Research Scope
- 1.2. Market Segmentation
- 1.3. Research Objective
- 1.4. Definitions and Assumptions
- 2. Executive Summary
- 2.1. Market Snapshot
- 3. Market Dynamics
- 3.1. Market Drivers
- 3.2. Market Restrains
- 3.3. Market Trends
- 3.4. Market Opportunities
- 4. Market Factor Analysis
- 4.1. Porters Five Forces
- 4.1.1. Bargaining Power of Suppliers
- 4.1.2. Bargaining Power of Buyers
- 4.1.3. Threat of New Entrants
- 4.1.4. Threat of Substitutes
- 4.1.5. Competitive Rivalry
- 4.2. PESTEL analysis
- 4.3. BCG Analysis
- 4.3.1. Stars (High Growth, High Market Share)
- 4.3.2. Cash Cows (Low Growth, High Market Share)
- 4.3.3. Question Mark (High Growth, Low Market Share)
- 4.3.4. Dogs (Low Growth, Low Market Share)
- 4.4. Ansoff Matrix Analysis
- 4.5. Supply Chain Analysis
- 4.6. Regulatory Landscape
- 4.7. Current Market Potential and Opportunity Assessment (TAM–SAM–SOM Framework)
- 4.8. MDP Analyst Note
- 4.1. Porters Five Forces
- 5. Market Analysis, Insights and Forecast 2021-2033
- 5.1. Market Analysis, Insights and Forecast - by Type
- 5.1.1. Active
- 5.1.2. Passive
- 5.1.3. Digital
- 5.1.4. Hybrid
- 5.2. Market Analysis, Insights and Forecast - by End-User
- 5.2.1. Manufacturing
- 5.2.2. Healthcare
- 5.2.3. Government
- 5.2.4. Transportation
- 5.2.5. Sports and Entertainment
- 5.2.6. Telecommunications
- 5.2.7. Other End-Users
- 5.3. Market Analysis, Insights and Forecast - by Application
- 5.3.1. Enterprise DAS
- 5.3.2. Public Safety DAS
- 5.3.3. Other Applications
- 5.4. Market Analysis, Insights and Forecast - by Region
- 5.4.1. North America
- 5.4.2. Europe
- 5.4.3. Asia
- 5.4.4. Australia and New Zealand
- 5.4.5. Latin America
- 5.4.6. Middle East and Africa
- 5.1. Market Analysis, Insights and Forecast - by Type
- 6. Global Distributed Antenna Systems Industry Analysis, Insights and Forecast, 2021-2033
- 6.1. Market Analysis, Insights and Forecast - by Type
- 6.1.1. Active
- 6.1.2. Passive
- 6.1.3. Digital
- 6.1.4. Hybrid
- 6.2. Market Analysis, Insights and Forecast - by End-User
- 6.2.1. Manufacturing
- 6.2.2. Healthcare
- 6.2.3. Government
- 6.2.4. Transportation
- 6.2.5. Sports and Entertainment
- 6.2.6. Telecommunications
- 6.2.7. Other End-Users
- 6.3. Market Analysis, Insights and Forecast - by Application
- 6.3.1. Enterprise DAS
- 6.3.2. Public Safety DAS
- 6.3.3. Other Applications
- 6.1. Market Analysis, Insights and Forecast - by Type
- 7. North America Distributed Antenna Systems Industry Analysis, Insights and Forecast, 2020-2032
- 7.1. Market Analysis, Insights and Forecast - by Type
- 7.1.1. Active
- 7.1.2. Passive
- 7.1.3. Digital
- 7.1.4. Hybrid
- 7.2. Market Analysis, Insights and Forecast - by End-User
- 7.2.1. Manufacturing
- 7.2.2. Healthcare
- 7.2.3. Government
- 7.2.4. Transportation
- 7.2.5. Sports and Entertainment
- 7.2.6. Telecommunications
- 7.2.7. Other End-Users
- 7.3. Market Analysis, Insights and Forecast - by Application
- 7.3.1. Enterprise DAS
- 7.3.2. Public Safety DAS
- 7.3.3. Other Applications
- 7.1. Market Analysis, Insights and Forecast - by Type
- 8. Europe Distributed Antenna Systems Industry Analysis, Insights and Forecast, 2020-2032
- 8.1. Market Analysis, Insights and Forecast - by Type
- 8.1.1. Active
- 8.1.2. Passive
- 8.1.3. Digital
- 8.1.4. Hybrid
- 8.2. Market Analysis, Insights and Forecast - by End-User
- 8.2.1. Manufacturing
- 8.2.2. Healthcare
- 8.2.3. Government
- 8.2.4. Transportation
- 8.2.5. Sports and Entertainment
- 8.2.6. Telecommunications
- 8.2.7. Other End-Users
- 8.3. Market Analysis, Insights and Forecast - by Application
- 8.3.1. Enterprise DAS
- 8.3.2. Public Safety DAS
- 8.3.3. Other Applications
- 8.1. Market Analysis, Insights and Forecast - by Type
- 9. Asia Distributed Antenna Systems Industry Analysis, Insights and Forecast, 2020-2032
- 9.1. Market Analysis, Insights and Forecast - by Type
- 9.1.1. Active
- 9.1.2. Passive
- 9.1.3. Digital
- 9.1.4. Hybrid
- 9.2. Market Analysis, Insights and Forecast - by End-User
- 9.2.1. Manufacturing
- 9.2.2. Healthcare
- 9.2.3. Government
- 9.2.4. Transportation
- 9.2.5. Sports and Entertainment
- 9.2.6. Telecommunications
- 9.2.7. Other End-Users
- 9.3. Market Analysis, Insights and Forecast - by Application
- 9.3.1. Enterprise DAS
- 9.3.2. Public Safety DAS
- 9.3.3. Other Applications
- 9.1. Market Analysis, Insights and Forecast - by Type
- 10. Australia and New Zealand Distributed Antenna Systems Industry Analysis, Insights and Forecast, 2020-2032
- 10.1. Market Analysis, Insights and Forecast - by Type
- 10.1.1. Active
- 10.1.2. Passive
- 10.1.3. Digital
- 10.1.4. Hybrid
- 10.2. Market Analysis, Insights and Forecast - by End-User
- 10.2.1. Manufacturing
- 10.2.2. Healthcare
- 10.2.3. Government
- 10.2.4. Transportation
- 10.2.5. Sports and Entertainment
- 10.2.6. Telecommunications
- 10.2.7. Other End-Users
- 10.3. Market Analysis, Insights and Forecast - by Application
- 10.3.1. Enterprise DAS
- 10.3.2. Public Safety DAS
- 10.3.3. Other Applications
- 10.1. Market Analysis, Insights and Forecast - by Type
- 11. Latin America Distributed Antenna Systems Industry Analysis, Insights and Forecast, 2020-2032
- 11.1. Market Analysis, Insights and Forecast - by Type
- 11.1.1. Active
- 11.1.2. Passive
- 11.1.3. Digital
- 11.1.4. Hybrid
- 11.2. Market Analysis, Insights and Forecast - by End-User
- 11.2.1. Manufacturing
- 11.2.2. Healthcare
- 11.2.3. Government
- 11.2.4. Transportation
- 11.2.5. Sports and Entertainment
- 11.2.6. Telecommunications
- 11.2.7. Other End-Users
- 11.3. Market Analysis, Insights and Forecast - by Application
- 11.3.1. Enterprise DAS
- 11.3.2. Public Safety DAS
- 11.3.3. Other Applications
- 11.1. Market Analysis, Insights and Forecast - by Type
- 12. Middle East and Africa Distributed Antenna Systems Industry Analysis, Insights and Forecast, 2020-2032
- 12.1. Market Analysis, Insights and Forecast - by Type
- 12.1.1. Active
- 12.1.2. Passive
- 12.1.3. Digital
- 12.1.4. Hybrid
- 12.2. Market Analysis, Insights and Forecast - by End-User
- 12.2.1. Manufacturing
- 12.2.2. Healthcare
- 12.2.3. Government
- 12.2.4. Transportation
- 12.2.5. Sports and Entertainment
- 12.2.6. Telecommunications
- 12.2.7. Other End-Users
- 12.3. Market Analysis, Insights and Forecast - by Application
- 12.3.1. Enterprise DAS
- 12.3.2. Public Safety DAS
- 12.3.3. Other Applications
- 12.1. Market Analysis, Insights and Forecast - by Type
- 13. Competitive Analysis
- 13.1. Company Profiles
- 13.1.1 Anixter Inc
- 13.1.1.1. Company Overview
- 13.1.1.2. Products
- 13.1.1.3. Company Financials
- 13.1.1.4. SWOT Analysis
- 13.1.2 Boingo Wireless Inc
- 13.1.2.1. Company Overview
- 13.1.2.2. Products
- 13.1.2.3. Company Financials
- 13.1.2.4. SWOT Analysis
- 13.1.3 CommScope Inc
- 13.1.3.1. Company Overview
- 13.1.3.2. Products
- 13.1.3.3. Company Financials
- 13.1.3.4. SWOT Analysis
- 13.1.4 American Tower Corporation
- 13.1.4.1. Company Overview
- 13.1.4.2. Products
- 13.1.4.3. Company Financials
- 13.1.4.4. SWOT Analysis
- 13.1.5 Tower Bersama Group
- 13.1.5.1. Company Overview
- 13.1.5.2. Products
- 13.1.5.3. Company Financials
- 13.1.5.4. SWOT Analysis
- 13.1.6 Corning Inc
- 13.1.6.1. Company Overview
- 13.1.6.2. Products
- 13.1.6.3. Company Financials
- 13.1.6.4. SWOT Analysis
- 13.1.7 TE Connectivity Ltd
- 13.1.7.1. Company Overview
- 13.1.7.2. Products
- 13.1.7.3. Company Financials
- 13.1.7.4. SWOT Analysis
- 13.1.8 Comba Telecom Systems Holdings Ltd
- 13.1.8.1. Company Overview
- 13.1.8.2. Products
- 13.1.8.3. Company Financials
- 13.1.8.4. SWOT Analysis
- 13.1.9 Antenna Products Corporation
- 13.1.9.1. Company Overview
- 13.1.9.2. Products
- 13.1.9.3. Company Financials
- 13.1.9.4. SWOT Analysis
- 13.1.10 Cobham PLC
- 13.1.10.1. Company Overview
- 13.1.10.2. Products
- 13.1.10.3. Company Financials
- 13.1.10.4. SWOT Analysis
- 13.1.11 SOLiD Inc
- 13.1.11.1. Company Overview
- 13.1.11.2. Products
- 13.1.11.3. Company Financials
- 13.1.11.4. SWOT Analysis
- 13.1.1 Anixter Inc
- 13.2. Market Entropy
- 13.2.1 Company's Key Areas Served
- 13.2.2 Recent Developments
- 13.3. Company Market Share Analysis 2025
- 13.3.1 Top 5 Companies Market Share Analysis
- 13.3.2 Top 3 Companies Market Share Analysis
- 13.4. List of Potential Customers
- 14. Research Methodology
List of Figures
- Figure 1: Global Distributed Antenna Systems Industry Revenue Breakdown (Million, %) by Region 2025 & 2033
- Figure 2: North America Distributed Antenna Systems Industry Revenue (Million), by Type 2025 & 2033
- Figure 3: North America Distributed Antenna Systems Industry Revenue Share (%), by Type 2025 & 2033
- Figure 4: North America Distributed Antenna Systems Industry Revenue (Million), by End-User 2025 & 2033
- Figure 5: North America Distributed Antenna Systems Industry Revenue Share (%), by End-User 2025 & 2033
- Figure 6: North America Distributed Antenna Systems Industry Revenue (Million), by Application 2025 & 2033
- Figure 7: North America Distributed Antenna Systems Industry Revenue Share (%), by Application 2025 & 2033
- Figure 8: North America Distributed Antenna Systems Industry Revenue (Million), by Country 2025 & 2033
- Figure 9: North America Distributed Antenna Systems Industry Revenue Share (%), by Country 2025 & 2033
- Figure 10: Europe Distributed Antenna Systems Industry Revenue (Million), by Type 2025 & 2033
- Figure 11: Europe Distributed Antenna Systems Industry Revenue Share (%), by Type 2025 & 2033
- Figure 12: Europe Distributed Antenna Systems Industry Revenue (Million), by End-User 2025 & 2033
- Figure 13: Europe Distributed Antenna Systems Industry Revenue Share (%), by End-User 2025 & 2033
- Figure 14: Europe Distributed Antenna Systems Industry Revenue (Million), by Application 2025 & 2033
- Figure 15: Europe Distributed Antenna Systems Industry Revenue Share (%), by Application 2025 & 2033
- Figure 16: Europe Distributed Antenna Systems Industry Revenue (Million), by Country 2025 & 2033
- Figure 17: Europe Distributed Antenna Systems Industry Revenue Share (%), by Country 2025 & 2033
- Figure 18: Asia Distributed Antenna Systems Industry Revenue (Million), by Type 2025 & 2033
- Figure 19: Asia Distributed Antenna Systems Industry Revenue Share (%), by Type 2025 & 2033
- Figure 20: Asia Distributed Antenna Systems Industry Revenue (Million), by End-User 2025 & 2033
- Figure 21: Asia Distributed Antenna Systems Industry Revenue Share (%), by End-User 2025 & 2033
- Figure 22: Asia Distributed Antenna Systems Industry Revenue (Million), by Application 2025 & 2033
- Figure 23: Asia Distributed Antenna Systems Industry Revenue Share (%), by Application 2025 & 2033
- Figure 24: Asia Distributed Antenna Systems Industry Revenue (Million), by Country 2025 & 2033
- Figure 25: Asia Distributed Antenna Systems Industry Revenue Share (%), by Country 2025 & 2033
- Figure 26: Australia and New Zealand Distributed Antenna Systems Industry Revenue (Million), by Type 2025 & 2033
- Figure 27: Australia and New Zealand Distributed Antenna Systems Industry Revenue Share (%), by Type 2025 & 2033
- Figure 28: Australia and New Zealand Distributed Antenna Systems Industry Revenue (Million), by End-User 2025 & 2033
- Figure 29: Australia and New Zealand Distributed Antenna Systems Industry Revenue Share (%), by End-User 2025 & 2033
- Figure 30: Australia and New Zealand Distributed Antenna Systems Industry Revenue (Million), by Application 2025 & 2033
- Figure 31: Australia and New Zealand Distributed Antenna Systems Industry Revenue Share (%), by Application 2025 & 2033
- Figure 32: Australia and New Zealand Distributed Antenna Systems Industry Revenue (Million), by Country 2025 & 2033
- Figure 33: Australia and New Zealand Distributed Antenna Systems Industry Revenue Share (%), by Country 2025 & 2033
- Figure 34: Latin America Distributed Antenna Systems Industry Revenue (Million), by Type 2025 & 2033
- Figure 35: Latin America Distributed Antenna Systems Industry Revenue Share (%), by Type 2025 & 2033
- Figure 36: Latin America Distributed Antenna Systems Industry Revenue (Million), by End-User 2025 & 2033
- Figure 37: Latin America Distributed Antenna Systems Industry Revenue Share (%), by End-User 2025 & 2033
- Figure 38: Latin America Distributed Antenna Systems Industry Revenue (Million), by Application 2025 & 2033
- Figure 39: Latin America Distributed Antenna Systems Industry Revenue Share (%), by Application 2025 & 2033
- Figure 40: Latin America Distributed Antenna Systems Industry Revenue (Million), by Country 2025 & 2033
- Figure 41: Latin America Distributed Antenna Systems Industry Revenue Share (%), by Country 2025 & 2033
- Figure 42: Middle East and Africa Distributed Antenna Systems Industry Revenue (Million), by Type 2025 & 2033
- Figure 43: Middle East and Africa Distributed Antenna Systems Industry Revenue Share (%), by Type 2025 & 2033
- Figure 44: Middle East and Africa Distributed Antenna Systems Industry Revenue (Million), by End-User 2025 & 2033
- Figure 45: Middle East and Africa Distributed Antenna Systems Industry Revenue Share (%), by End-User 2025 & 2033
- Figure 46: Middle East and Africa Distributed Antenna Systems Industry Revenue (Million), by Application 2025 & 2033
- Figure 47: Middle East and Africa Distributed Antenna Systems Industry Revenue Share (%), by Application 2025 & 2033
- Figure 48: Middle East and Africa Distributed Antenna Systems Industry Revenue (Million), by Country 2025 & 2033
- Figure 49: Middle East and Africa Distributed Antenna Systems Industry Revenue Share (%), by Country 2025 & 2033
List of Tables
- Table 1: Global Distributed Antenna Systems Industry Revenue Million Forecast, by Type 2020 & 2033
- Table 2: Global Distributed Antenna Systems Industry Revenue Million Forecast, by End-User 2020 & 2033
- Table 3: Global Distributed Antenna Systems Industry Revenue Million Forecast, by Application 2020 & 2033
- Table 4: Global Distributed Antenna Systems Industry Revenue Million Forecast, by Region 2020 & 2033
- Table 5: Global Distributed Antenna Systems Industry Revenue Million Forecast, by Type 2020 & 2033
- Table 6: Global Distributed Antenna Systems Industry Revenue Million Forecast, by End-User 2020 & 2033
- Table 7: Global Distributed Antenna Systems Industry Revenue Million Forecast, by Application 2020 & 2033
- Table 8: Global Distributed Antenna Systems Industry Revenue Million Forecast, by Country 2020 & 2033
- Table 9: Global Distributed Antenna Systems Industry Revenue Million Forecast, by Type 2020 & 2033
- Table 10: Global Distributed Antenna Systems Industry Revenue Million Forecast, by End-User 2020 & 2033
- Table 11: Global Distributed Antenna Systems Industry Revenue Million Forecast, by Application 2020 & 2033
- Table 12: Global Distributed Antenna Systems Industry Revenue Million Forecast, by Country 2020 & 2033
- Table 13: Global Distributed Antenna Systems Industry Revenue Million Forecast, by Type 2020 & 2033
- Table 14: Global Distributed Antenna Systems Industry Revenue Million Forecast, by End-User 2020 & 2033
- Table 15: Global Distributed Antenna Systems Industry Revenue Million Forecast, by Application 2020 & 2033
- Table 16: Global Distributed Antenna Systems Industry Revenue Million Forecast, by Country 2020 & 2033
- Table 17: Global Distributed Antenna Systems Industry Revenue Million Forecast, by Type 2020 & 2033
- Table 18: Global Distributed Antenna Systems Industry Revenue Million Forecast, by End-User 2020 & 2033
- Table 19: Global Distributed Antenna Systems Industry Revenue Million Forecast, by Application 2020 & 2033
- Table 20: Global Distributed Antenna Systems Industry Revenue Million Forecast, by Country 2020 & 2033
- Table 21: Global Distributed Antenna Systems Industry Revenue Million Forecast, by Type 2020 & 2033
- Table 22: Global Distributed Antenna Systems Industry Revenue Million Forecast, by End-User 2020 & 2033
- Table 23: Global Distributed Antenna Systems Industry Revenue Million Forecast, by Application 2020 & 2033
- Table 24: Global Distributed Antenna Systems Industry Revenue Million Forecast, by Country 2020 & 2033
- Table 25: Global Distributed Antenna Systems Industry Revenue Million Forecast, by Type 2020 & 2033
- Table 26: Global Distributed Antenna Systems Industry Revenue Million Forecast, by End-User 2020 & 2033
- Table 27: Global Distributed Antenna Systems Industry Revenue Million Forecast, by Application 2020 & 2033
- Table 28: Global Distributed Antenna Systems Industry Revenue Million Forecast, by Country 2020 & 2033
Frequently Asked Questions
1. What is the projected Compound Annual Growth Rate (CAGR) of the Distributed Antenna Systems Industry?
The projected CAGR is approximately 6.03%.
2. Which companies are prominent players in the Distributed Antenna Systems Industry?
Key companies in the market include Anixter Inc, Boingo Wireless Inc, CommScope Inc, American Tower Corporation, Tower Bersama Group, Corning Inc, TE Connectivity Ltd, Comba Telecom Systems Holdings Ltd, Antenna Products Corporation, Cobham PLC, SOLiD Inc.
3. What are the main segments of the Distributed Antenna Systems Industry?
The market segments include Type, End-User, Application.
4. Can you provide details about the market size?
The market size is estimated to be USD 10.28 Million as of 2022.
5. What are some drivers contributing to market growth?
DAS Ability to Support Multiple Telecom Carriers and Upcoming Technologies.
6. What are the notable trends driving market growth?
Sport and Entertainment Segment to Hold a Significant Market Share.
7. Are there any restraints impacting market growth?
Lack of Awareness About Intellectual Property Outsourcing.
8. Can you provide examples of recent developments in the market?
July 2023: American Tower Corporation and Xcel Energy Center announced the deployment of a Distributed Antenna System (DAS) solution that will bring 5G technology to the arena. The company enters a new era of fan engagement and provides cutting-edge applications for the Minnesota Wild fans, with an updated, neutral-host 5G DAS.
9. What pricing options are available for accessing the report?
Pricing options include single-user, multi-user, and enterprise licenses priced at USD 4750, USD 5250, and USD 8750 respectively.
10. Is the market size provided in terms of value or volume?
The market size is provided in terms of value, measured in Million.
11. Are there any specific market keywords associated with the report?
Yes, the market keyword associated with the report is "Distributed Antenna Systems Industry," which aids in identifying and referencing the specific market segment covered.
12. How do I determine which pricing option suits my needs best?
The pricing options vary based on user requirements and access needs. Individual users may opt for single-user licenses, while businesses requiring broader access may choose multi-user or enterprise licenses for cost-effective access to the report.
13. Are there any additional resources or data provided in the Distributed Antenna Systems Industry report?
While the report offers comprehensive insights, it's advisable to review the specific contents or supplementary materials provided to ascertain if additional resources or data are available.
14. How can I stay updated on further developments or reports in the Distributed Antenna Systems Industry?
To stay informed about further developments, trends, and reports in the Distributed Antenna Systems Industry, consider subscribing to industry newsletters, following relevant companies and organizations, or regularly checking reputable industry news sources and publications.
Methodology
Step 1 - Identification of Relevant Samples Size from Population Database


Step 2 - Approaches for Defining Global Market Size (Value, Volume* & Price*)

Note*: In applicable scenarios
Step 3 - Data Sources
Primary Research
- Web Analytics
- Survey Reports
- Research Institute
- Latest Research Reports
- Opinion Leaders
Secondary Research
- Annual Reports
- White Paper
- Latest Press Release
- Industry Association
- Paid Database
- Investor Presentations

Step 4 - Data Triangulation
Involves using different sources of information in order to increase the validity of a study
These sources are likely to be stakeholders in a program - participants, other researchers, program staff, other community members, and so on.
Then we put all data in single framework & apply various statistical tools to find out the dynamic on the market.
During the analysis stage, feedback from the stakeholder groups would be compared to determine areas of agreement as well as areas of divergence