

Key Insights
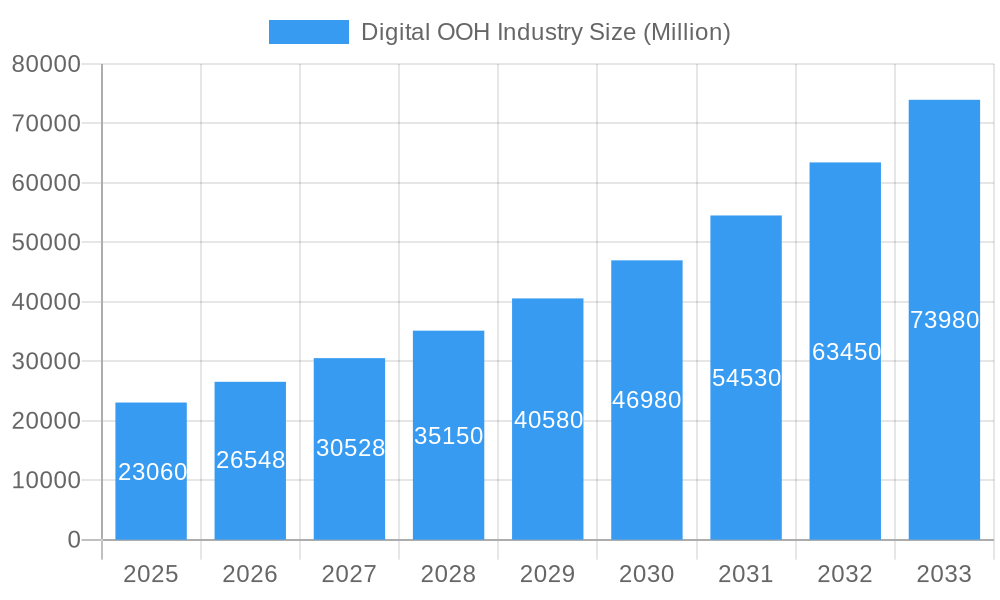
The Digital Out-of-Home (DOOH) advertising market is experiencing robust growth, projected to reach \$23.06 billion in 2025 and exhibiting a Compound Annual Growth Rate (CAGR) of 15.20%. This expansion is driven by several key factors. Firstly, the increasing adoption of programmatic advertising allows for targeted and data-driven campaigns, maximizing ROI for advertisers. Secondly, the enhanced capabilities of DOOH displays, such as high-resolution screens and interactive features, deliver more engaging and impactful advertisements compared to traditional static billboards. Thirdly, the rise of smart city initiatives integrates DOOH seamlessly into urban environments, creating more opportunities for impactful placements. Finally, the integration of DOOH with other digital channels provides omnichannel marketing possibilities, further boosting its appeal. The market is segmented by application (billboards, transit, street furniture, and other applications) and end-user (retail, healthcare/pharmaceuticals, financial services, automotive, telecom/utilities, government agencies, and others), each showing unique growth trajectories. North America and Europe currently hold significant market shares, but the Asia-Pacific region is expected to witness the most rapid growth due to its expanding urban populations and rising digital advertising spending.
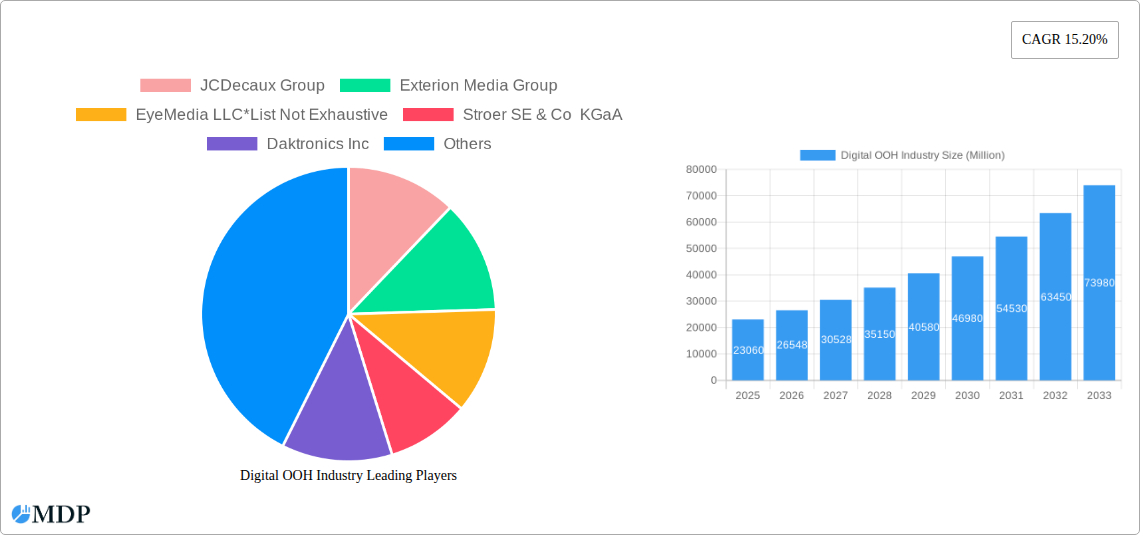
Digital OOH Industry Market Size (In Billion)
The competitive landscape of the DOOH industry is characterized by a mix of large multinational companies and specialized regional players. Major companies like JCDecaux, Exterion Media, and Clear Channel Outdoor are leveraging their extensive networks and technological expertise to maintain market leadership. However, smaller, more agile companies are innovating in areas such as interactive displays, data analytics, and programmatic buying, creating a dynamic and competitive market. The industry is also witnessing a trend towards consolidation, with larger companies acquiring smaller players to expand their geographic reach and technological capabilities. While challenges such as high initial investment costs and dependence on favorable economic conditions exist, the overall market outlook for the DOOH advertising industry remains positive, with continued strong growth predicted through 2033.
Digital OOH Industry Company Market Share
Digital OOH Industry Market Report: 2019-2033
This comprehensive report provides a detailed analysis of the Digital Out-of-Home (DOOH) advertising industry, projecting a market valued at $XX Million by 2033. It offers actionable insights for stakeholders, encompassing market dynamics, leading players, technological advancements, and future growth opportunities. The report covers the period 2019-2033, with a focus on the forecast period 2025-2033 and a base year of 2025. This in-depth analysis is crucial for businesses seeking to navigate and capitalize on the rapid evolution of the DOOH landscape.
Digital OOH Industry Market Dynamics & Concentration
The global Digital OOH market exhibits a moderately concentrated landscape, with key players vying for market share. The market is characterized by ongoing innovation, driven by advancements in display technology, data analytics, and programmatic advertising. Regulatory frameworks, varying across different geographical regions, play a significant role in shaping market access and expansion strategies. Product substitutes, such as digital video advertising and social media campaigns, present competitive pressures. End-user trends, particularly the growing adoption of DOOH by retail, healthcare, and financial services sectors, significantly influence market growth. Furthermore, M&A activity within the industry has intensified, leading to consolidation and reshaping the competitive dynamics.
- Market Concentration: The top 5 players hold an estimated xx% of the global market share in 2025.
- Innovation Drivers: Programmatic advertising, AI-powered targeting, and interactive displays are key drivers.
- Regulatory Frameworks: Varying regulations regarding advertising placement and content impact market accessibility.
- Product Substitutes: Digital video and social media advertising pose a competitive challenge.
- End-User Trends: Growing adoption across retail, healthcare, and financial services fuels market expansion.
- M&A Activity: An estimated xx M&A deals occurred in the historical period (2019-2024), leading to industry consolidation.
Digital OOH Industry Industry Trends & Analysis
The Digital OOH market is experiencing robust growth, driven by several key factors. The increasing adoption of programmatic advertising allows for more precise targeting and improved campaign effectiveness, fostering growth. Technological advancements, such as the integration of advanced analytics and interactive capabilities, enhance the appeal of DOOH for advertisers. Shifting consumer preferences towards engaging and visually rich advertising formats fuel demand. The competitive landscape is characterized by both cooperation and competition, with companies collaborating on technology development while simultaneously vying for market share. The compound annual growth rate (CAGR) for the Digital OOH market is projected to be xx% during the forecast period (2025-2033), with market penetration expected to reach xx% by 2033.
Leading Markets & Segments in Digital OOH Industry
The North American region currently holds the largest market share in the Digital OOH industry, followed by Europe. Within these regions, major cities with high foot traffic and dense populations represent the most lucrative segments.
Key Drivers:
- North America: Strong economic conditions, advanced infrastructure, and early adoption of programmatic advertising.
- Europe: High population density in major urban centers, coupled with a developed advertising market.
- Asia-Pacific: Rapid urbanization and increasing disposable incomes are fueling growth, though regulatory hurdles may exist.
Dominant Segments:
- Application: Billboards currently dominate the application segment, followed by transit advertising. Street furniture is experiencing rapid growth.
- End-User: The retail sector is a major end-user, followed by the healthcare/pharmaceutical and financial services sectors. Government agencies represent a growing segment.
Digital OOH Industry Product Developments
Recent innovations in DOOH technology include the integration of augmented reality (AR) and virtual reality (VR) experiences, enhancing audience engagement. Programmatic advertising platforms continue to evolve, offering greater precision in targeting and campaign management. Smart screens with integrated sensors collect data on audience interactions, enabling better measurement of advertising effectiveness. These advancements are enhancing the overall value proposition of DOOH for advertisers, leading to increased market adoption.
Key Drivers of Digital OOH Industry Growth
Technological advancements in display technology, data analytics, and programmatic advertising are primary growth drivers. Economic factors, such as increasing advertising budgets and rising disposable incomes, fuel demand. Supportive regulatory frameworks, facilitating the deployment of DOOH infrastructure, contribute significantly. For example, the government initiatives promoting smart city development in several regions create opportunities for DOOH expansion.
Challenges in the Digital OOH Industry Market
Regulatory hurdles regarding advertising placement and content vary across regions, posing challenges. Supply chain disruptions related to hardware manufacturing and installation can impact market growth. Intense competition amongst existing and emerging players creates pressure on pricing and profitability. For example, supply chain constraints in 2022 impacted the availability of key components, leading to a xx% increase in installation costs.
Emerging Opportunities in Digital OOH Industry
The integration of advanced technologies like AI and machine learning will optimize targeting and campaign performance. Strategic partnerships between DOOH providers and data analytics companies are creating opportunities for improved campaign measurement. Expansion into new geographic markets, particularly in developing economies with rapidly growing urban populations, presents significant potential for market expansion.
Leading Players in the Digital OOH Industry Sector
- JCDecaux Group
- Exterion Media Group
- EyeMedia LLC
- Stroer SE & Co KGaA
- Daktronics Inc
- The Times Group
- BroadSign International LLC
- OUTFRONT Media
- oOh!media Limited
- SevenOne Media GmbH
- Talon Outdoor Ltd
- QMS Media Limited
- Clear Channel Outdoor Holdings Inc
Key Milestones in Digital OOH Industry Industry
- June 2022: JCDecaux launches programmatic DOOH product in Brazil in collaboration with VIOOH, enhancing programmatic advertising capabilities.
- April 2022: Adani Airports introduces programmatic DOOH media through Lemma, expanding programmatic advertising into the Indian airport ecosystem.
Strategic Outlook for Digital OOH Industry Market
The Digital OOH market is poised for continued growth, driven by technological innovations and increasing advertiser demand for targeted and engaging advertising solutions. Strategic partnerships, focused on data integration and programmatic capabilities, will further accelerate market expansion. The focus on data-driven insights and enhanced measurement capabilities will attract greater investment, securing the long-term growth of this dynamic industry.
Digital OOH Industry Segmentation
-
1. Application
- 1.1. Billboard
- 1.2. Transit
- 1.3. Street Furniture
- 1.4. Other Applications
-
2. End-User
- 2.1. Retail
- 2.2. Healthcare/Pharmaceuticals
- 2.3. Financial Services
- 2.4. Automotive
- 2.5. Telecom/Utilities
- 2.6. Government Agencies
- 2.7. Other End-Users
Digital OOH Industry Segmentation By Geography
-
1. North America
- 1.1. United States
- 1.2. Canada
-
2. Europe
- 2.1. Germany
- 2.2. United Kingdom
- 2.3. Spain
- 2.4. France
- 2.5. Rest of Europe
-
3. Asia Pacific
- 3.1. China
- 3.2. India
- 3.3. Japan
- 3.4. Singapore
- 3.5. South Korea
- 3.6. Rest of Asia Pacific
-
4. Latin America
- 4.1. Brazil
- 4.2. Mexico
- 4.3. Chile
- 4.4. Rest of Latin America
-
5. Middle East and Africa
- 5.1. GCC
- 5.2. South Africa
- 5.3. Rest of Middle East and Africa
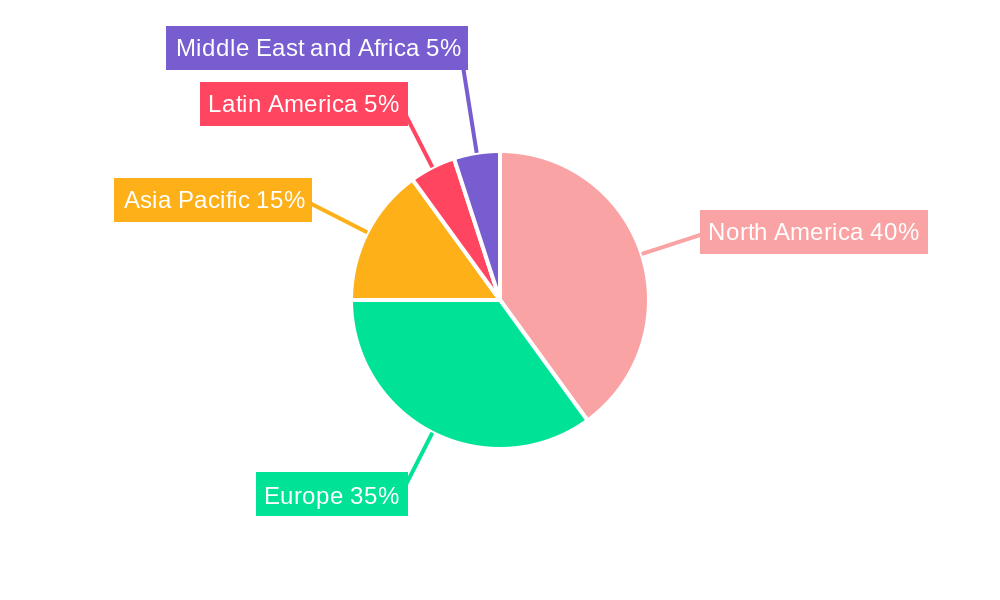
Digital OOH Industry Regional Market Share
Geographic Coverage of Digital OOH Industry
Digital OOH Industry REPORT HIGHLIGHTS
| Aspects | Details |
|---|---|
| Study Period | 2020-2034 |
| Base Year | 2025 |
| Estimated Year | 2026 |
| Forecast Period | 2026-2034 |
| Historical Period | 2020-2025 |
| Growth Rate | CAGR of 15.20% from 2020-2034 |
| Segmentation |
|
Table of Contents
- 1. Introduction
- 1.1. Research Scope
- 1.2. Market Segmentation
- 1.3. Research Objective
- 1.4. Definitions and Assumptions
- 2. Executive Summary
- 2.1. Market Snapshot
- 3. Market Dynamics
- 3.1. Market Drivers
- 3.2. Market Restrains
- 3.3. Market Trends
- 3.4. Market Opportunities
- 4. Market Factor Analysis
- 4.1. Porters Five Forces
- 4.1.1. Bargaining Power of Suppliers
- 4.1.2. Bargaining Power of Buyers
- 4.1.3. Threat of New Entrants
- 4.1.4. Threat of Substitutes
- 4.1.5. Competitive Rivalry
- 4.2. PESTEL analysis
- 4.3. BCG Analysis
- 4.3.1. Stars (High Growth, High Market Share)
- 4.3.2. Cash Cows (Low Growth, High Market Share)
- 4.3.3. Question Mark (High Growth, Low Market Share)
- 4.3.4. Dogs (Low Growth, Low Market Share)
- 4.4. Ansoff Matrix Analysis
- 4.5. Supply Chain Analysis
- 4.6. Regulatory Landscape
- 4.7. Current Market Potential and Opportunity Assessment (TAM–SAM–SOM Framework)
- 4.8. MDP Analyst Note
- 4.1. Porters Five Forces
- 5. Market Analysis, Insights and Forecast 2021-2033
- 5.1. Market Analysis, Insights and Forecast - by Application
- 5.1.1. Billboard
- 5.1.2. Transit
- 5.1.3. Street Furniture
- 5.1.4. Other Applications
- 5.2. Market Analysis, Insights and Forecast - by End-User
- 5.2.1. Retail
- 5.2.2. Healthcare/Pharmaceuticals
- 5.2.3. Financial Services
- 5.2.4. Automotive
- 5.2.5. Telecom/Utilities
- 5.2.6. Government Agencies
- 5.2.7. Other End-Users
- 5.3. Market Analysis, Insights and Forecast - by Region
- 5.3.1. North America
- 5.3.2. Europe
- 5.3.3. Asia Pacific
- 5.3.4. Latin America
- 5.3.5. Middle East and Africa
- 5.1. Market Analysis, Insights and Forecast - by Application
- 6. Global Digital OOH Industry Analysis, Insights and Forecast, 2021-2033
- 6.1. Market Analysis, Insights and Forecast - by Application
- 6.1.1. Billboard
- 6.1.2. Transit
- 6.1.3. Street Furniture
- 6.1.4. Other Applications
- 6.2. Market Analysis, Insights and Forecast - by End-User
- 6.2.1. Retail
- 6.2.2. Healthcare/Pharmaceuticals
- 6.2.3. Financial Services
- 6.2.4. Automotive
- 6.2.5. Telecom/Utilities
- 6.2.6. Government Agencies
- 6.2.7. Other End-Users
- 6.1. Market Analysis, Insights and Forecast - by Application
- 7. North America Digital OOH Industry Analysis, Insights and Forecast, 2020-2032
- 7.1. Market Analysis, Insights and Forecast - by Application
- 7.1.1. Billboard
- 7.1.2. Transit
- 7.1.3. Street Furniture
- 7.1.4. Other Applications
- 7.2. Market Analysis, Insights and Forecast - by End-User
- 7.2.1. Retail
- 7.2.2. Healthcare/Pharmaceuticals
- 7.2.3. Financial Services
- 7.2.4. Automotive
- 7.2.5. Telecom/Utilities
- 7.2.6. Government Agencies
- 7.2.7. Other End-Users
- 7.1. Market Analysis, Insights and Forecast - by Application
- 8. Europe Digital OOH Industry Analysis, Insights and Forecast, 2020-2032
- 8.1. Market Analysis, Insights and Forecast - by Application
- 8.1.1. Billboard
- 8.1.2. Transit
- 8.1.3. Street Furniture
- 8.1.4. Other Applications
- 8.2. Market Analysis, Insights and Forecast - by End-User
- 8.2.1. Retail
- 8.2.2. Healthcare/Pharmaceuticals
- 8.2.3. Financial Services
- 8.2.4. Automotive
- 8.2.5. Telecom/Utilities
- 8.2.6. Government Agencies
- 8.2.7. Other End-Users
- 8.1. Market Analysis, Insights and Forecast - by Application
- 9. Asia Pacific Digital OOH Industry Analysis, Insights and Forecast, 2020-2032
- 9.1. Market Analysis, Insights and Forecast - by Application
- 9.1.1. Billboard
- 9.1.2. Transit
- 9.1.3. Street Furniture
- 9.1.4. Other Applications
- 9.2. Market Analysis, Insights and Forecast - by End-User
- 9.2.1. Retail
- 9.2.2. Healthcare/Pharmaceuticals
- 9.2.3. Financial Services
- 9.2.4. Automotive
- 9.2.5. Telecom/Utilities
- 9.2.6. Government Agencies
- 9.2.7. Other End-Users
- 9.1. Market Analysis, Insights and Forecast - by Application
- 10. Latin America Digital OOH Industry Analysis, Insights and Forecast, 2020-2032
- 10.1. Market Analysis, Insights and Forecast - by Application
- 10.1.1. Billboard
- 10.1.2. Transit
- 10.1.3. Street Furniture
- 10.1.4. Other Applications
- 10.2. Market Analysis, Insights and Forecast - by End-User
- 10.2.1. Retail
- 10.2.2. Healthcare/Pharmaceuticals
- 10.2.3. Financial Services
- 10.2.4. Automotive
- 10.2.5. Telecom/Utilities
- 10.2.6. Government Agencies
- 10.2.7. Other End-Users
- 10.1. Market Analysis, Insights and Forecast - by Application
- 11. Middle East and Africa Digital OOH Industry Analysis, Insights and Forecast, 2020-2032
- 11.1. Market Analysis, Insights and Forecast - by Application
- 11.1.1. Billboard
- 11.1.2. Transit
- 11.1.3. Street Furniture
- 11.1.4. Other Applications
- 11.2. Market Analysis, Insights and Forecast - by End-User
- 11.2.1. Retail
- 11.2.2. Healthcare/Pharmaceuticals
- 11.2.3. Financial Services
- 11.2.4. Automotive
- 11.2.5. Telecom/Utilities
- 11.2.6. Government Agencies
- 11.2.7. Other End-Users
- 11.1. Market Analysis, Insights and Forecast - by Application
- 12. Competitive Analysis
- 12.1. Company Profiles
- 12.1.1 JCDecaux Group
- 12.1.1.1. Company Overview
- 12.1.1.2. Products
- 12.1.1.3. Company Financials
- 12.1.1.4. SWOT Analysis
- 12.1.2 Exterion Media Group
- 12.1.2.1. Company Overview
- 12.1.2.2. Products
- 12.1.2.3. Company Financials
- 12.1.2.4. SWOT Analysis
- 12.1.3 EyeMedia LLC*List Not Exhaustive
- 12.1.3.1. Company Overview
- 12.1.3.2. Products
- 12.1.3.3. Company Financials
- 12.1.3.4. SWOT Analysis
- 12.1.4 Stroer SE & Co KGaA
- 12.1.4.1. Company Overview
- 12.1.4.2. Products
- 12.1.4.3. Company Financials
- 12.1.4.4. SWOT Analysis
- 12.1.5 Daktronics Inc
- 12.1.5.1. Company Overview
- 12.1.5.2. Products
- 12.1.5.3. Company Financials
- 12.1.5.4. SWOT Analysis
- 12.1.6 The Times Group
- 12.1.6.1. Company Overview
- 12.1.6.2. Products
- 12.1.6.3. Company Financials
- 12.1.6.4. SWOT Analysis
- 12.1.7 BroadSign International LLC
- 12.1.7.1. Company Overview
- 12.1.7.2. Products
- 12.1.7.3. Company Financials
- 12.1.7.4. SWOT Analysis
- 12.1.8 OUTFRONT Media
- 12.1.8.1. Company Overview
- 12.1.8.2. Products
- 12.1.8.3. Company Financials
- 12.1.8.4. SWOT Analysis
- 12.1.9 oOh!media Limited
- 12.1.9.1. Company Overview
- 12.1.9.2. Products
- 12.1.9.3. Company Financials
- 12.1.9.4. SWOT Analysis
- 12.1.10 SevenOne Media GmbH
- 12.1.10.1. Company Overview
- 12.1.10.2. Products
- 12.1.10.3. Company Financials
- 12.1.10.4. SWOT Analysis
- 12.1.11 Talon Outdoor Ltd
- 12.1.11.1. Company Overview
- 12.1.11.2. Products
- 12.1.11.3. Company Financials
- 12.1.11.4. SWOT Analysis
- 12.1.12 QMS Media Limited
- 12.1.12.1. Company Overview
- 12.1.12.2. Products
- 12.1.12.3. Company Financials
- 12.1.12.4. SWOT Analysis
- 12.1.13 Clear Channel Outdoor Holdings Inc
- 12.1.13.1. Company Overview
- 12.1.13.2. Products
- 12.1.13.3. Company Financials
- 12.1.13.4. SWOT Analysis
- 12.1.1 JCDecaux Group
- 12.2. Market Entropy
- 12.2.1 Company's Key Areas Served
- 12.2.2 Recent Developments
- 12.3. Company Market Share Analysis 2025
- 12.3.1 Top 5 Companies Market Share Analysis
- 12.3.2 Top 3 Companies Market Share Analysis
- 12.4. List of Potential Customers
- 13. Research Methodology
List of Figures
- Figure 1: Global Digital OOH Industry Revenue Breakdown (Million, %) by Region 2025 & 2033
- Figure 2: North America Digital OOH Industry Revenue (Million), by Application 2025 & 2033
- Figure 3: North America Digital OOH Industry Revenue Share (%), by Application 2025 & 2033
- Figure 4: North America Digital OOH Industry Revenue (Million), by End-User 2025 & 2033
- Figure 5: North America Digital OOH Industry Revenue Share (%), by End-User 2025 & 2033
- Figure 6: North America Digital OOH Industry Revenue (Million), by Country 2025 & 2033
- Figure 7: North America Digital OOH Industry Revenue Share (%), by Country 2025 & 2033
- Figure 8: Europe Digital OOH Industry Revenue (Million), by Application 2025 & 2033
- Figure 9: Europe Digital OOH Industry Revenue Share (%), by Application 2025 & 2033
- Figure 10: Europe Digital OOH Industry Revenue (Million), by End-User 2025 & 2033
- Figure 11: Europe Digital OOH Industry Revenue Share (%), by End-User 2025 & 2033
- Figure 12: Europe Digital OOH Industry Revenue (Million), by Country 2025 & 2033
- Figure 13: Europe Digital OOH Industry Revenue Share (%), by Country 2025 & 2033
- Figure 14: Asia Pacific Digital OOH Industry Revenue (Million), by Application 2025 & 2033
- Figure 15: Asia Pacific Digital OOH Industry Revenue Share (%), by Application 2025 & 2033
- Figure 16: Asia Pacific Digital OOH Industry Revenue (Million), by End-User 2025 & 2033
- Figure 17: Asia Pacific Digital OOH Industry Revenue Share (%), by End-User 2025 & 2033
- Figure 18: Asia Pacific Digital OOH Industry Revenue (Million), by Country 2025 & 2033
- Figure 19: Asia Pacific Digital OOH Industry Revenue Share (%), by Country 2025 & 2033
- Figure 20: Latin America Digital OOH Industry Revenue (Million), by Application 2025 & 2033
- Figure 21: Latin America Digital OOH Industry Revenue Share (%), by Application 2025 & 2033
- Figure 22: Latin America Digital OOH Industry Revenue (Million), by End-User 2025 & 2033
- Figure 23: Latin America Digital OOH Industry Revenue Share (%), by End-User 2025 & 2033
- Figure 24: Latin America Digital OOH Industry Revenue (Million), by Country 2025 & 2033
- Figure 25: Latin America Digital OOH Industry Revenue Share (%), by Country 2025 & 2033
- Figure 26: Middle East and Africa Digital OOH Industry Revenue (Million), by Application 2025 & 2033
- Figure 27: Middle East and Africa Digital OOH Industry Revenue Share (%), by Application 2025 & 2033
- Figure 28: Middle East and Africa Digital OOH Industry Revenue (Million), by End-User 2025 & 2033
- Figure 29: Middle East and Africa Digital OOH Industry Revenue Share (%), by End-User 2025 & 2033
- Figure 30: Middle East and Africa Digital OOH Industry Revenue (Million), by Country 2025 & 2033
- Figure 31: Middle East and Africa Digital OOH Industry Revenue Share (%), by Country 2025 & 2033
List of Tables
- Table 1: Global Digital OOH Industry Revenue Million Forecast, by Application 2020 & 2033
- Table 2: Global Digital OOH Industry Revenue Million Forecast, by End-User 2020 & 2033
- Table 3: Global Digital OOH Industry Revenue Million Forecast, by Region 2020 & 2033
- Table 4: Global Digital OOH Industry Revenue Million Forecast, by Application 2020 & 2033
- Table 5: Global Digital OOH Industry Revenue Million Forecast, by End-User 2020 & 2033
- Table 6: Global Digital OOH Industry Revenue Million Forecast, by Country 2020 & 2033
- Table 7: United States Digital OOH Industry Revenue (Million) Forecast, by Application 2020 & 2033
- Table 8: Canada Digital OOH Industry Revenue (Million) Forecast, by Application 2020 & 2033
- Table 9: Global Digital OOH Industry Revenue Million Forecast, by Application 2020 & 2033
- Table 10: Global Digital OOH Industry Revenue Million Forecast, by End-User 2020 & 2033
- Table 11: Global Digital OOH Industry Revenue Million Forecast, by Country 2020 & 2033
- Table 12: Germany Digital OOH Industry Revenue (Million) Forecast, by Application 2020 & 2033
- Table 13: United Kingdom Digital OOH Industry Revenue (Million) Forecast, by Application 2020 & 2033
- Table 14: Spain Digital OOH Industry Revenue (Million) Forecast, by Application 2020 & 2033
- Table 15: France Digital OOH Industry Revenue (Million) Forecast, by Application 2020 & 2033
- Table 16: Rest of Europe Digital OOH Industry Revenue (Million) Forecast, by Application 2020 & 2033
- Table 17: Global Digital OOH Industry Revenue Million Forecast, by Application 2020 & 2033
- Table 18: Global Digital OOH Industry Revenue Million Forecast, by End-User 2020 & 2033
- Table 19: Global Digital OOH Industry Revenue Million Forecast, by Country 2020 & 2033
- Table 20: China Digital OOH Industry Revenue (Million) Forecast, by Application 2020 & 2033
- Table 21: India Digital OOH Industry Revenue (Million) Forecast, by Application 2020 & 2033
- Table 22: Japan Digital OOH Industry Revenue (Million) Forecast, by Application 2020 & 2033
- Table 23: Singapore Digital OOH Industry Revenue (Million) Forecast, by Application 2020 & 2033
- Table 24: South Korea Digital OOH Industry Revenue (Million) Forecast, by Application 2020 & 2033
- Table 25: Rest of Asia Pacific Digital OOH Industry Revenue (Million) Forecast, by Application 2020 & 2033
- Table 26: Global Digital OOH Industry Revenue Million Forecast, by Application 2020 & 2033
- Table 27: Global Digital OOH Industry Revenue Million Forecast, by End-User 2020 & 2033
- Table 28: Global Digital OOH Industry Revenue Million Forecast, by Country 2020 & 2033
- Table 29: Brazil Digital OOH Industry Revenue (Million) Forecast, by Application 2020 & 2033
- Table 30: Mexico Digital OOH Industry Revenue (Million) Forecast, by Application 2020 & 2033
- Table 31: Chile Digital OOH Industry Revenue (Million) Forecast, by Application 2020 & 2033
- Table 32: Rest of Latin America Digital OOH Industry Revenue (Million) Forecast, by Application 2020 & 2033
- Table 33: Global Digital OOH Industry Revenue Million Forecast, by Application 2020 & 2033
- Table 34: Global Digital OOH Industry Revenue Million Forecast, by End-User 2020 & 2033
- Table 35: Global Digital OOH Industry Revenue Million Forecast, by Country 2020 & 2033
- Table 36: GCC Digital OOH Industry Revenue (Million) Forecast, by Application 2020 & 2033
- Table 37: South Africa Digital OOH Industry Revenue (Million) Forecast, by Application 2020 & 2033
- Table 38: Rest of Middle East and Africa Digital OOH Industry Revenue (Million) Forecast, by Application 2020 & 2033
Frequently Asked Questions
1. What is the projected Compound Annual Growth Rate (CAGR) of the Digital OOH Industry?
The projected CAGR is approximately 15.20%.
2. Which companies are prominent players in the Digital OOH Industry?
Key companies in the market include JCDecaux Group, Exterion Media Group, EyeMedia LLC*List Not Exhaustive, Stroer SE & Co KGaA, Daktronics Inc, The Times Group, BroadSign International LLC, OUTFRONT Media, oOh!media Limited, SevenOne Media GmbH, Talon Outdoor Ltd, QMS Media Limited, Clear Channel Outdoor Holdings Inc.
3. What are the main segments of the Digital OOH Industry?
The market segments include Application, End-User.
4. Can you provide details about the market size?
The market size is estimated to be USD 23.06 Million as of 2022.
5. What are some drivers contributing to market growth?
Increase in Public Transit Infrastructure; Increasing Adoption of Digital Screens; High Advertising Flexibility with Connected Screens.
6. What are the notable trends driving market growth?
Transit Accounts for a Significant Share of Digital OOH Market.
7. Are there any restraints impacting market growth?
High Installation and Maintenance Costs.
8. Can you provide examples of recent developments in the market?
June 2022 - JCDecaux has announced the launch of its programmatic DOOH product for the Brazilian market in collaboration with VIOOH. JCDecaux will be able to offer its customers efficient programmatic digital out-of-home campaigns on its premium screens across Brazil using the VIOOH platform, assisting brands in making meaningful connections with people and ensuring they get the most out of their media expenditures.
9. What pricing options are available for accessing the report?
Pricing options include single-user, multi-user, and enterprise licenses priced at USD 4750, USD 5250, and USD 8750 respectively.
10. Is the market size provided in terms of value or volume?
The market size is provided in terms of value, measured in Million.
11. Are there any specific market keywords associated with the report?
Yes, the market keyword associated with the report is "Digital OOH Industry," which aids in identifying and referencing the specific market segment covered.
12. How do I determine which pricing option suits my needs best?
The pricing options vary based on user requirements and access needs. Individual users may opt for single-user licenses, while businesses requiring broader access may choose multi-user or enterprise licenses for cost-effective access to the report.
13. Are there any additional resources or data provided in the Digital OOH Industry report?
While the report offers comprehensive insights, it's advisable to review the specific contents or supplementary materials provided to ascertain if additional resources or data are available.
14. How can I stay updated on further developments or reports in the Digital OOH Industry?
To stay informed about further developments, trends, and reports in the Digital OOH Industry, consider subscribing to industry newsletters, following relevant companies and organizations, or regularly checking reputable industry news sources and publications.
Methodology
Step 1 - Identification of Relevant Samples Size from Population Database


Step 2 - Approaches for Defining Global Market Size (Value, Volume* & Price*)

Note*: In applicable scenarios
Step 3 - Data Sources
Primary Research
- Web Analytics
- Survey Reports
- Research Institute
- Latest Research Reports
- Opinion Leaders
Secondary Research
- Annual Reports
- White Paper
- Latest Press Release
- Industry Association
- Paid Database
- Investor Presentations

Step 4 - Data Triangulation
Involves using different sources of information in order to increase the validity of a study
These sources are likely to be stakeholders in a program - participants, other researchers, program staff, other community members, and so on.
Then we put all data in single framework & apply various statistical tools to find out the dynamic on the market.
During the analysis stage, feedback from the stakeholder groups would be compared to determine areas of agreement as well as areas of divergence