

Key Insights
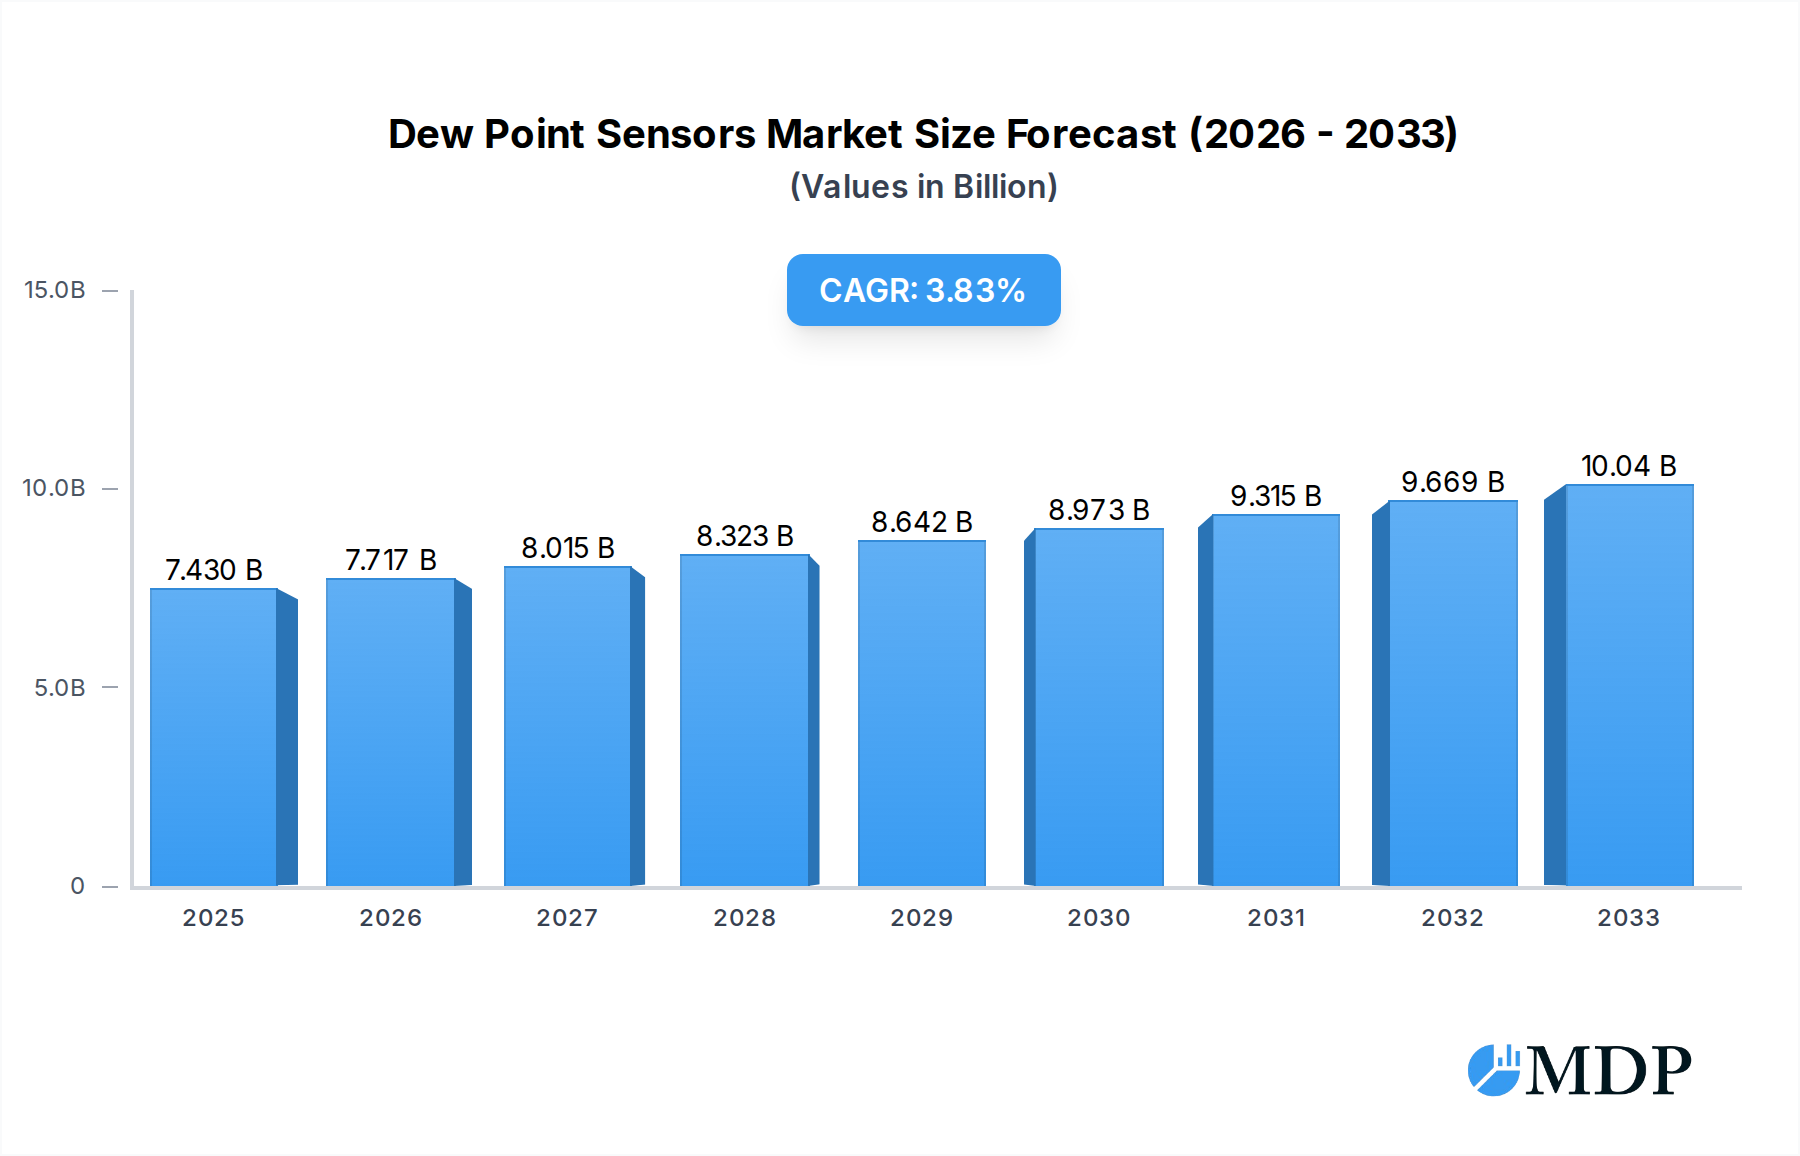
The global Dew Point Sensors market is poised for significant expansion, projected to reach USD 7.43 billion by 2025. This growth is underpinned by a robust Compound Annual Growth Rate (CAGR) of 3.8% between 2019 and 2033, indicating sustained demand and innovation within the sector. Key drivers fueling this expansion include the escalating need for precise moisture control in critical industrial processes, particularly within the petrochemical and semiconductor industries. The growing adoption of sophisticated manufacturing techniques and the increasing emphasis on product quality and process efficiency are compelling industries to invest in advanced dew point measurement solutions. Furthermore, the pharmaceutical sector's stringent regulatory requirements regarding humidity levels are also a major contributor to market growth. The continuous development of more accurate, compact, and cost-effective dew point sensor technologies, including advancements in capacitance and resistance-based methods, will further stimulate market penetration. Emerging economies are also expected to witness accelerated adoption due to industrialization and infrastructure development.

Dew Point Sensors Market Size (In Billion)
The market for dew point sensors is characterized by a dynamic interplay of drivers and restraints. While the increasing demand for industrial automation and the necessity for preserving product integrity are significant growth catalysts, potential restraints include the high initial cost of sophisticated sensor systems and the availability of alternative, albeit less precise, moisture detection methods in certain niche applications. However, the evolving technological landscape, with innovations like cold mirror methods offering enhanced accuracy, is likely to mitigate these challenges. Geographically, North America and Europe currently lead the market, driven by established industrial bases and stringent quality standards. Nevertheless, the Asia Pacific region, led by China and India, is anticipated to exhibit the fastest growth, propelled by rapid industrialization, a burgeoning manufacturing sector, and increasing investments in advanced technologies. The competitive landscape features established players like Mettler-Toledo, AMETEK, and GE, alongside emerging companies, all vying to capture market share through product innovation, strategic partnerships, and global expansion.
Dew Point Sensors Company Market Share
Dew Point Sensors Market Report: Comprehensive Analysis and Forecast (2019–2033)
This in-depth market research report offers an unparalleled analysis of the global Dew Point Sensors market, providing critical insights for industry stakeholders. Covering a study period from 2019 to 2033, with a base year of 2025 and a forecast period of 2025–2033, this report delivers actionable intelligence on market dynamics, trends, leading players, and future opportunities. With an estimated market size projected to reach xx billion by 2033, this report is an indispensable resource for understanding the burgeoning dew point sensor industry.
Dew Point Sensors Market Dynamics & Concentration
The global Dew Point Sensors market exhibits a moderate level of concentration, with key players like Mettler-Toledo, AMETEK, and GE holding significant market share. Innovation drivers are primarily fueled by the increasing demand for precise moisture measurement in critical applications across the petrochemical, semiconductor, and pharmaceutical industries. Regulatory frameworks, particularly those focused on product quality and safety in food and beverage, are also shaping market dynamics. Product substitutes, while present, often lack the precision and reliability offered by advanced dew point sensor technologies. End-user trends reveal a growing preference for digital integration and IoT capabilities, enabling remote monitoring and data analytics. Mergers and Acquisitions (M&A) activities have been relatively steady, indicating a consolidation phase as companies seek to expand their product portfolios and geographical reach. The number of M&A deals is estimated to be around xx during the historical period.
Dew Point Sensors Industry Trends & Analysis
The Dew Point Sensors industry is poised for significant growth, driven by several compelling factors. A key market growth driver is the escalating industrialization and automation across emerging economies, necessitating stringent moisture control for process efficiency and product integrity. Technological disruptions are a constant theme, with advancements in sensor materials, miniaturization, and digital connectivity enhancing performance and reducing costs. For instance, the adoption of advanced capacitance and resistance methods, offering improved accuracy and faster response times, is a notable trend. Consumer preferences are increasingly leaning towards smart sensors with predictive maintenance capabilities and seamless integration into existing control systems. This shift is also propelled by the growing emphasis on energy efficiency and waste reduction in industrial processes. Competitive dynamics are characterized by intense R&D efforts, strategic partnerships, and a focus on offering customized solutions to diverse end-users. The market penetration of advanced dew point sensors is projected to rise, with a compound annual growth rate (CAGR) of approximately xx% expected over the forecast period. This growth trajectory is further supported by the increasing stringency of environmental regulations and the need for robust quality control in high-stakes industries.
Leading Markets & Segments in Dew Point Sensors
The Petrochemical segment is anticipated to be a dominant market for dew point sensors, driven by the critical need for precise moisture measurement in hydrocarbon processing, refining, and natural gas applications. The ability to prevent corrosion, optimize product quality, and ensure safety makes dew point monitoring indispensable. Within this segment, the Capacitance Method of dew point sensing is expected to lead due to its accuracy, stability, and suitability for a wide range of operating conditions.
- Dominance of Petrochemical Application:
- Economic Policies: Supportive government policies for the energy sector and investments in refining infrastructure in regions like the Middle East and North America fuel demand.
- Infrastructure Development: Extensive exploration and production activities necessitate robust process control instrumentation.
- Safety Regulations: Stringent safety standards in hydrocarbon handling mandate precise monitoring of moisture levels to prevent hazardous conditions.
The Semiconductor industry also presents a substantial market due to the ultra-dry environments required for microchip fabrication. Even minute moisture levels can lead to defects, impacting yields. The demand for high-purity gases and controlled atmospheres further amplifies the need for accurate dew point measurement.
- Dominance of Semiconductor Application:
- Technological Advancement: The continuous drive for smaller and more powerful microchips requires increasingly sophisticated manufacturing processes.
- Quality Control Imperative: Defects caused by moisture contamination are exceptionally costly to rectify.
- R&D Investment: Significant investments in research and development for next-generation semiconductor technologies create a sustained demand for advanced sensing solutions.
In terms of sensor types, the Capacitance Method is a key driver of growth across various segments, offering superior performance and longevity compared to older technologies. The Cold Mirror Method, while more expensive, finds niche applications where absolute precision is paramount.
Dew Point Sensors Product Developments
Recent product developments in dew point sensors are focused on enhancing precision, miniaturization, and connectivity. Innovations include the integration of advanced AI algorithms for predictive diagnostics and self-calibration, leading to reduced maintenance requirements and improved uptime. The development of robust sensors capable of operating in extreme temperatures and corrosive environments is expanding their application scope. Competitive advantages are being derived from cloud-based data logging and remote monitoring capabilities, enabling real-time insights and proactive adjustments in industrial processes.
Key Drivers of Dew Point Sensors Growth
The growth of the dew point sensors market is propelled by several key factors. Increasing industrial automation and the demand for stringent quality control across diverse sectors, including petrochemical, semiconductor, food, and pharmaceutical industries, are primary drivers. Technological advancements, such as the development of more accurate and reliable sensor technologies like capacitance and cold mirror methods, are expanding their applicability. Furthermore, evolving environmental regulations mandating precise moisture monitoring for process efficiency and emissions control are acting as significant catalysts for market expansion. The growing adoption of IoT and Industry 4.0 initiatives, which rely on real-time data from sensors, is also fueling demand for advanced dew point sensors.
Challenges in the Dew Point Sensors Market
Despite robust growth, the dew point sensors market faces certain challenges. High initial investment costs for certain advanced sensor technologies can be a barrier for smaller enterprises. The need for regular calibration and maintenance, though decreasing with technological advancements, can still be a concern. Intense competition among established players and the emergence of new entrants can lead to price pressures. Furthermore, the complexity of integrating sensors into existing industrial infrastructure and ensuring compatibility can pose technical hurdles. Supply chain disruptions for critical components can also impact production timelines and product availability.
Emerging Opportunities in Dew Point Sensors
Emerging opportunities in the dew point sensors market are largely driven by technological breakthroughs and expanding application areas. The increasing demand for smart sensors with advanced analytics and AI capabilities presents a significant growth avenue. Strategic partnerships between sensor manufacturers and industrial automation solution providers are creating integrated offerings that cater to specific industry needs. Market expansion into developing economies, where industrialization is rapidly accelerating, offers substantial untapped potential. The growing focus on sustainability and energy efficiency across industries will also drive the adoption of precise moisture measurement solutions.
Leading Players in the Dew Point Sensors Sector
- Mettler-Toledo
- AMETEK
- GE
- Arizona Instrument
- Koehler
- PCE Deutschland
- Mitsubishi
- Shimadzu
- A&D Company
- COSA Xentaur
- Process Sensing Technologies
- CVS Controls
- Endress+Hauser (Spectra)
- Kett
- MAC Instruments
Key Milestones in Dew Point Sensors Industry
- 2019: Introduction of advanced capacitive dew point sensors with enhanced stability and faster response times.
- 2020: Increased adoption of IoT-enabled dew point sensors for remote monitoring and data analytics in the petrochemical sector.
- 2021: Development of miniaturized dew point sensors for specialized applications in the semiconductor industry.
- 2022: Launch of ruggedized dew point sensors designed to withstand extreme environmental conditions in industrial settings.
- 2023: Growing emphasis on AI-driven predictive maintenance features in dew point sensor systems.
- 2024: Significant advancements in cold mirror dew point technology, offering enhanced absolute accuracy for critical laboratory and industrial processes.
Strategic Outlook for Dew Point Sensors Market
The strategic outlook for the dew point sensors market is exceptionally positive, driven by sustained demand from core industries and emerging applications. Future growth will be accelerated by the continued integration of digital technologies, including AI and IoT, to provide smarter and more predictive moisture management solutions. The focus on sustainability and energy efficiency will further bolster demand, as precise dew point control optimizes industrial processes. Strategic investments in research and development, coupled with targeted market expansion into high-growth regions, will be crucial for companies to capitalize on the evolving landscape and maintain a competitive edge in this dynamic market.
Dew Point Sensors Segmentation
-
1. Application
- 1.1. Petrochemical
- 1.2. Semiconductor
- 1.3. Food Industry
- 1.4. Pharmaceutical Industry
- 1.5. Other
-
2. Types
- 2.1. Capacitance Method
- 2.2. Resistance Method
- 2.3. Cold Mirror Method
- 2.4. Other
Dew Point Sensors Segmentation By Geography
-
1. North America
- 1.1. United States
- 1.2. Canada
- 1.3. Mexico
-
2. South America
- 2.1. Brazil
- 2.2. Argentina
- 2.3. Rest of South America
-
3. Europe
- 3.1. United Kingdom
- 3.2. Germany
- 3.3. France
- 3.4. Italy
- 3.5. Spain
- 3.6. Russia
- 3.7. Benelux
- 3.8. Nordics
- 3.9. Rest of Europe
-
4. Middle East & Africa
- 4.1. Turkey
- 4.2. Israel
- 4.3. GCC
- 4.4. North Africa
- 4.5. South Africa
- 4.6. Rest of Middle East & Africa
-
5. Asia Pacific
- 5.1. China
- 5.2. India
- 5.3. Japan
- 5.4. South Korea
- 5.5. ASEAN
- 5.6. Oceania
- 5.7. Rest of Asia Pacific
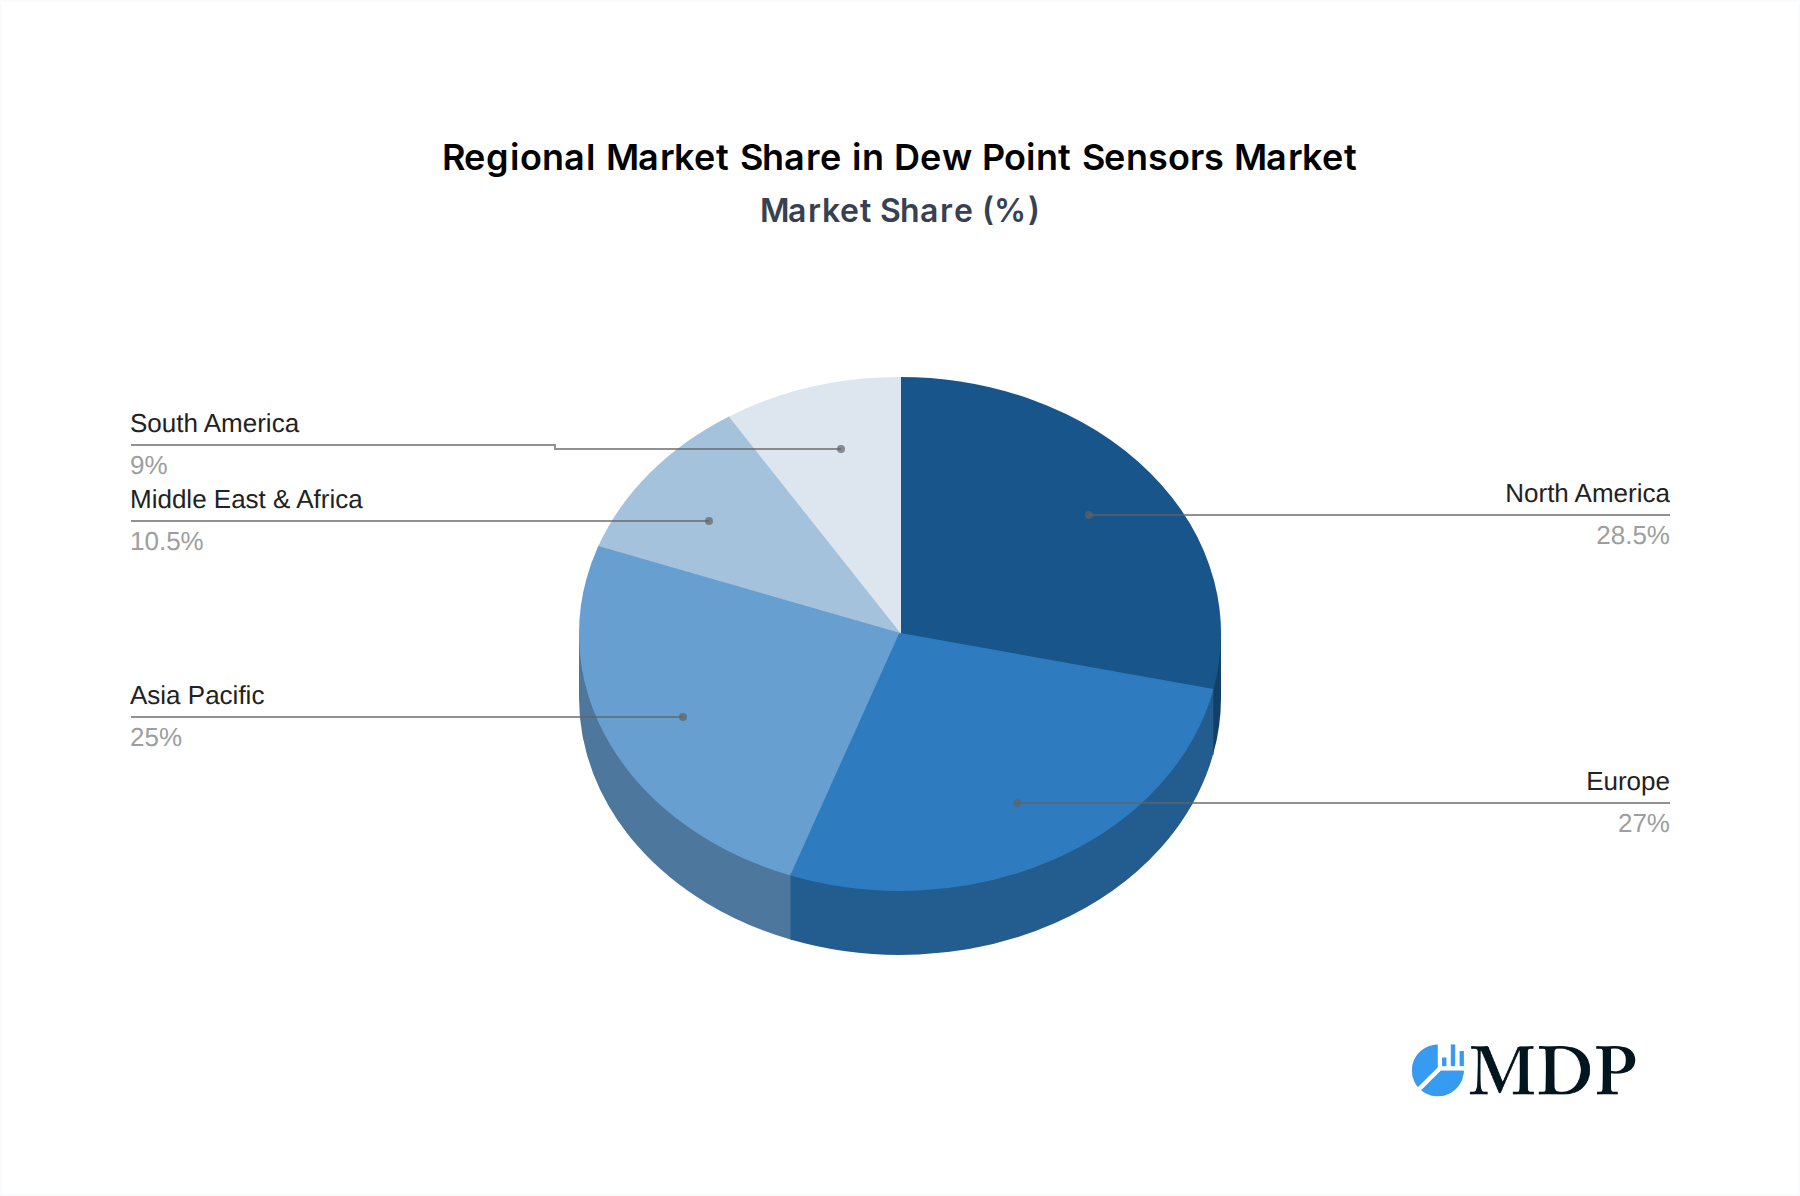
Dew Point Sensors Regional Market Share
Geographic Coverage of Dew Point Sensors
Dew Point Sensors REPORT HIGHLIGHTS
| Aspects | Details |
|---|---|
| Study Period | 2020-2034 |
| Base Year | 2025 |
| Estimated Year | 2026 |
| Forecast Period | 2026-2034 |
| Historical Period | 2020-2025 |
| Growth Rate | CAGR of 3.8% from 2020-2034 |
| Segmentation |
|
Table of Contents
- 1. Introduction
- 1.1. Research Scope
- 1.2. Market Segmentation
- 1.3. Research Methodology
- 1.4. Definitions and Assumptions
- 2. Executive Summary
- 2.1. Introduction
- 3. Market Dynamics
- 3.1. Introduction
- 3.2. Market Drivers
- 3.3. Market Restrains
- 3.4. Market Trends
- 4. Market Factor Analysis
- 4.1. Porters Five Forces
- 4.2. Supply/Value Chain
- 4.3. PESTEL analysis
- 4.4. Market Entropy
- 4.5. Patent/Trademark Analysis
- 5. Global Dew Point Sensors Analysis, Insights and Forecast, 2020-2032
- 5.1. Market Analysis, Insights and Forecast - by Application
- 5.1.1. Petrochemical
- 5.1.2. Semiconductor
- 5.1.3. Food Industry
- 5.1.4. Pharmaceutical Industry
- 5.1.5. Other
- 5.2. Market Analysis, Insights and Forecast - by Types
- 5.2.1. Capacitance Method
- 5.2.2. Resistance Method
- 5.2.3. Cold Mirror Method
- 5.2.4. Other
- 5.3. Market Analysis, Insights and Forecast - by Region
- 5.3.1. North America
- 5.3.2. South America
- 5.3.3. Europe
- 5.3.4. Middle East & Africa
- 5.3.5. Asia Pacific
- 5.1. Market Analysis, Insights and Forecast - by Application
- 6. North America Dew Point Sensors Analysis, Insights and Forecast, 2020-2032
- 6.1. Market Analysis, Insights and Forecast - by Application
- 6.1.1. Petrochemical
- 6.1.2. Semiconductor
- 6.1.3. Food Industry
- 6.1.4. Pharmaceutical Industry
- 6.1.5. Other
- 6.2. Market Analysis, Insights and Forecast - by Types
- 6.2.1. Capacitance Method
- 6.2.2. Resistance Method
- 6.2.3. Cold Mirror Method
- 6.2.4. Other
- 6.1. Market Analysis, Insights and Forecast - by Application
- 7. South America Dew Point Sensors Analysis, Insights and Forecast, 2020-2032
- 7.1. Market Analysis, Insights and Forecast - by Application
- 7.1.1. Petrochemical
- 7.1.2. Semiconductor
- 7.1.3. Food Industry
- 7.1.4. Pharmaceutical Industry
- 7.1.5. Other
- 7.2. Market Analysis, Insights and Forecast - by Types
- 7.2.1. Capacitance Method
- 7.2.2. Resistance Method
- 7.2.3. Cold Mirror Method
- 7.2.4. Other
- 7.1. Market Analysis, Insights and Forecast - by Application
- 8. Europe Dew Point Sensors Analysis, Insights and Forecast, 2020-2032
- 8.1. Market Analysis, Insights and Forecast - by Application
- 8.1.1. Petrochemical
- 8.1.2. Semiconductor
- 8.1.3. Food Industry
- 8.1.4. Pharmaceutical Industry
- 8.1.5. Other
- 8.2. Market Analysis, Insights and Forecast - by Types
- 8.2.1. Capacitance Method
- 8.2.2. Resistance Method
- 8.2.3. Cold Mirror Method
- 8.2.4. Other
- 8.1. Market Analysis, Insights and Forecast - by Application
- 9. Middle East & Africa Dew Point Sensors Analysis, Insights and Forecast, 2020-2032
- 9.1. Market Analysis, Insights and Forecast - by Application
- 9.1.1. Petrochemical
- 9.1.2. Semiconductor
- 9.1.3. Food Industry
- 9.1.4. Pharmaceutical Industry
- 9.1.5. Other
- 9.2. Market Analysis, Insights and Forecast - by Types
- 9.2.1. Capacitance Method
- 9.2.2. Resistance Method
- 9.2.3. Cold Mirror Method
- 9.2.4. Other
- 9.1. Market Analysis, Insights and Forecast - by Application
- 10. Asia Pacific Dew Point Sensors Analysis, Insights and Forecast, 2020-2032
- 10.1. Market Analysis, Insights and Forecast - by Application
- 10.1.1. Petrochemical
- 10.1.2. Semiconductor
- 10.1.3. Food Industry
- 10.1.4. Pharmaceutical Industry
- 10.1.5. Other
- 10.2. Market Analysis, Insights and Forecast - by Types
- 10.2.1. Capacitance Method
- 10.2.2. Resistance Method
- 10.2.3. Cold Mirror Method
- 10.2.4. Other
- 10.1. Market Analysis, Insights and Forecast - by Application
- 11. Competitive Analysis
- 11.1. Global Market Share Analysis 2025
- 11.2. Company Profiles
- 11.2.1 Mettler-Toledo
- 11.2.1.1. Overview
- 11.2.1.2. Products
- 11.2.1.3. SWOT Analysis
- 11.2.1.4. Recent Developments
- 11.2.1.5. Financials (Based on Availability)
- 11.2.2 AMETEK
- 11.2.2.1. Overview
- 11.2.2.2. Products
- 11.2.2.3. SWOT Analysis
- 11.2.2.4. Recent Developments
- 11.2.2.5. Financials (Based on Availability)
- 11.2.3 GE
- 11.2.3.1. Overview
- 11.2.3.2. Products
- 11.2.3.3. SWOT Analysis
- 11.2.3.4. Recent Developments
- 11.2.3.5. Financials (Based on Availability)
- 11.2.4 Arizona Instrument
- 11.2.4.1. Overview
- 11.2.4.2. Products
- 11.2.4.3. SWOT Analysis
- 11.2.4.4. Recent Developments
- 11.2.4.5. Financials (Based on Availability)
- 11.2.5 Koehler
- 11.2.5.1. Overview
- 11.2.5.2. Products
- 11.2.5.3. SWOT Analysis
- 11.2.5.4. Recent Developments
- 11.2.5.5. Financials (Based on Availability)
- 11.2.6 PCE Deutschland
- 11.2.6.1. Overview
- 11.2.6.2. Products
- 11.2.6.3. SWOT Analysis
- 11.2.6.4. Recent Developments
- 11.2.6.5. Financials (Based on Availability)
- 11.2.7 Mitsubishi
- 11.2.7.1. Overview
- 11.2.7.2. Products
- 11.2.7.3. SWOT Analysis
- 11.2.7.4. Recent Developments
- 11.2.7.5. Financials (Based on Availability)
- 11.2.8 Shimadzu
- 11.2.8.1. Overview
- 11.2.8.2. Products
- 11.2.8.3. SWOT Analysis
- 11.2.8.4. Recent Developments
- 11.2.8.5. Financials (Based on Availability)
- 11.2.9 A&D Company
- 11.2.9.1. Overview
- 11.2.9.2. Products
- 11.2.9.3. SWOT Analysis
- 11.2.9.4. Recent Developments
- 11.2.9.5. Financials (Based on Availability)
- 11.2.10 COSA Xentaur
- 11.2.10.1. Overview
- 11.2.10.2. Products
- 11.2.10.3. SWOT Analysis
- 11.2.10.4. Recent Developments
- 11.2.10.5. Financials (Based on Availability)
- 11.2.11 Process Sensing Technologies
- 11.2.11.1. Overview
- 11.2.11.2. Products
- 11.2.11.3. SWOT Analysis
- 11.2.11.4. Recent Developments
- 11.2.11.5. Financials (Based on Availability)
- 11.2.12 CVS Controls
- 11.2.12.1. Overview
- 11.2.12.2. Products
- 11.2.12.3. SWOT Analysis
- 11.2.12.4. Recent Developments
- 11.2.12.5. Financials (Based on Availability)
- 11.2.13 Endress+Hauser(Spectra)
- 11.2.13.1. Overview
- 11.2.13.2. Products
- 11.2.13.3. SWOT Analysis
- 11.2.13.4. Recent Developments
- 11.2.13.5. Financials (Based on Availability)
- 11.2.14 Kett
- 11.2.14.1. Overview
- 11.2.14.2. Products
- 11.2.14.3. SWOT Analysis
- 11.2.14.4. Recent Developments
- 11.2.14.5. Financials (Based on Availability)
- 11.2.15 MAC Instruments
- 11.2.15.1. Overview
- 11.2.15.2. Products
- 11.2.15.3. SWOT Analysis
- 11.2.15.4. Recent Developments
- 11.2.15.5. Financials (Based on Availability)
- 11.2.1 Mettler-Toledo
List of Figures
- Figure 1: Global Dew Point Sensors Revenue Breakdown (billion, %) by Region 2025 & 2033
- Figure 2: North America Dew Point Sensors Revenue (billion), by Application 2025 & 2033
- Figure 3: North America Dew Point Sensors Revenue Share (%), by Application 2025 & 2033
- Figure 4: North America Dew Point Sensors Revenue (billion), by Types 2025 & 2033
- Figure 5: North America Dew Point Sensors Revenue Share (%), by Types 2025 & 2033
- Figure 6: North America Dew Point Sensors Revenue (billion), by Country 2025 & 2033
- Figure 7: North America Dew Point Sensors Revenue Share (%), by Country 2025 & 2033
- Figure 8: South America Dew Point Sensors Revenue (billion), by Application 2025 & 2033
- Figure 9: South America Dew Point Sensors Revenue Share (%), by Application 2025 & 2033
- Figure 10: South America Dew Point Sensors Revenue (billion), by Types 2025 & 2033
- Figure 11: South America Dew Point Sensors Revenue Share (%), by Types 2025 & 2033
- Figure 12: South America Dew Point Sensors Revenue (billion), by Country 2025 & 2033
- Figure 13: South America Dew Point Sensors Revenue Share (%), by Country 2025 & 2033
- Figure 14: Europe Dew Point Sensors Revenue (billion), by Application 2025 & 2033
- Figure 15: Europe Dew Point Sensors Revenue Share (%), by Application 2025 & 2033
- Figure 16: Europe Dew Point Sensors Revenue (billion), by Types 2025 & 2033
- Figure 17: Europe Dew Point Sensors Revenue Share (%), by Types 2025 & 2033
- Figure 18: Europe Dew Point Sensors Revenue (billion), by Country 2025 & 2033
- Figure 19: Europe Dew Point Sensors Revenue Share (%), by Country 2025 & 2033
- Figure 20: Middle East & Africa Dew Point Sensors Revenue (billion), by Application 2025 & 2033
- Figure 21: Middle East & Africa Dew Point Sensors Revenue Share (%), by Application 2025 & 2033
- Figure 22: Middle East & Africa Dew Point Sensors Revenue (billion), by Types 2025 & 2033
- Figure 23: Middle East & Africa Dew Point Sensors Revenue Share (%), by Types 2025 & 2033
- Figure 24: Middle East & Africa Dew Point Sensors Revenue (billion), by Country 2025 & 2033
- Figure 25: Middle East & Africa Dew Point Sensors Revenue Share (%), by Country 2025 & 2033
- Figure 26: Asia Pacific Dew Point Sensors Revenue (billion), by Application 2025 & 2033
- Figure 27: Asia Pacific Dew Point Sensors Revenue Share (%), by Application 2025 & 2033
- Figure 28: Asia Pacific Dew Point Sensors Revenue (billion), by Types 2025 & 2033
- Figure 29: Asia Pacific Dew Point Sensors Revenue Share (%), by Types 2025 & 2033
- Figure 30: Asia Pacific Dew Point Sensors Revenue (billion), by Country 2025 & 2033
- Figure 31: Asia Pacific Dew Point Sensors Revenue Share (%), by Country 2025 & 2033
List of Tables
- Table 1: Global Dew Point Sensors Revenue billion Forecast, by Application 2020 & 2033
- Table 2: Global Dew Point Sensors Revenue billion Forecast, by Types 2020 & 2033
- Table 3: Global Dew Point Sensors Revenue billion Forecast, by Region 2020 & 2033
- Table 4: Global Dew Point Sensors Revenue billion Forecast, by Application 2020 & 2033
- Table 5: Global Dew Point Sensors Revenue billion Forecast, by Types 2020 & 2033
- Table 6: Global Dew Point Sensors Revenue billion Forecast, by Country 2020 & 2033
- Table 7: United States Dew Point Sensors Revenue (billion) Forecast, by Application 2020 & 2033
- Table 8: Canada Dew Point Sensors Revenue (billion) Forecast, by Application 2020 & 2033
- Table 9: Mexico Dew Point Sensors Revenue (billion) Forecast, by Application 2020 & 2033
- Table 10: Global Dew Point Sensors Revenue billion Forecast, by Application 2020 & 2033
- Table 11: Global Dew Point Sensors Revenue billion Forecast, by Types 2020 & 2033
- Table 12: Global Dew Point Sensors Revenue billion Forecast, by Country 2020 & 2033
- Table 13: Brazil Dew Point Sensors Revenue (billion) Forecast, by Application 2020 & 2033
- Table 14: Argentina Dew Point Sensors Revenue (billion) Forecast, by Application 2020 & 2033
- Table 15: Rest of South America Dew Point Sensors Revenue (billion) Forecast, by Application 2020 & 2033
- Table 16: Global Dew Point Sensors Revenue billion Forecast, by Application 2020 & 2033
- Table 17: Global Dew Point Sensors Revenue billion Forecast, by Types 2020 & 2033
- Table 18: Global Dew Point Sensors Revenue billion Forecast, by Country 2020 & 2033
- Table 19: United Kingdom Dew Point Sensors Revenue (billion) Forecast, by Application 2020 & 2033
- Table 20: Germany Dew Point Sensors Revenue (billion) Forecast, by Application 2020 & 2033
- Table 21: France Dew Point Sensors Revenue (billion) Forecast, by Application 2020 & 2033
- Table 22: Italy Dew Point Sensors Revenue (billion) Forecast, by Application 2020 & 2033
- Table 23: Spain Dew Point Sensors Revenue (billion) Forecast, by Application 2020 & 2033
- Table 24: Russia Dew Point Sensors Revenue (billion) Forecast, by Application 2020 & 2033
- Table 25: Benelux Dew Point Sensors Revenue (billion) Forecast, by Application 2020 & 2033
- Table 26: Nordics Dew Point Sensors Revenue (billion) Forecast, by Application 2020 & 2033
- Table 27: Rest of Europe Dew Point Sensors Revenue (billion) Forecast, by Application 2020 & 2033
- Table 28: Global Dew Point Sensors Revenue billion Forecast, by Application 2020 & 2033
- Table 29: Global Dew Point Sensors Revenue billion Forecast, by Types 2020 & 2033
- Table 30: Global Dew Point Sensors Revenue billion Forecast, by Country 2020 & 2033
- Table 31: Turkey Dew Point Sensors Revenue (billion) Forecast, by Application 2020 & 2033
- Table 32: Israel Dew Point Sensors Revenue (billion) Forecast, by Application 2020 & 2033
- Table 33: GCC Dew Point Sensors Revenue (billion) Forecast, by Application 2020 & 2033
- Table 34: North Africa Dew Point Sensors Revenue (billion) Forecast, by Application 2020 & 2033
- Table 35: South Africa Dew Point Sensors Revenue (billion) Forecast, by Application 2020 & 2033
- Table 36: Rest of Middle East & Africa Dew Point Sensors Revenue (billion) Forecast, by Application 2020 & 2033
- Table 37: Global Dew Point Sensors Revenue billion Forecast, by Application 2020 & 2033
- Table 38: Global Dew Point Sensors Revenue billion Forecast, by Types 2020 & 2033
- Table 39: Global Dew Point Sensors Revenue billion Forecast, by Country 2020 & 2033
- Table 40: China Dew Point Sensors Revenue (billion) Forecast, by Application 2020 & 2033
- Table 41: India Dew Point Sensors Revenue (billion) Forecast, by Application 2020 & 2033
- Table 42: Japan Dew Point Sensors Revenue (billion) Forecast, by Application 2020 & 2033
- Table 43: South Korea Dew Point Sensors Revenue (billion) Forecast, by Application 2020 & 2033
- Table 44: ASEAN Dew Point Sensors Revenue (billion) Forecast, by Application 2020 & 2033
- Table 45: Oceania Dew Point Sensors Revenue (billion) Forecast, by Application 2020 & 2033
- Table 46: Rest of Asia Pacific Dew Point Sensors Revenue (billion) Forecast, by Application 2020 & 2033
Frequently Asked Questions
1. What is the projected Compound Annual Growth Rate (CAGR) of the Dew Point Sensors?
The projected CAGR is approximately 3.8%.
2. Which companies are prominent players in the Dew Point Sensors?
Key companies in the market include Mettler-Toledo, AMETEK, GE, Arizona Instrument, Koehler, PCE Deutschland, Mitsubishi, Shimadzu, A&D Company, COSA Xentaur, Process Sensing Technologies, CVS Controls, Endress+Hauser(Spectra), Kett, MAC Instruments.
3. What are the main segments of the Dew Point Sensors?
The market segments include Application, Types.
4. Can you provide details about the market size?
The market size is estimated to be USD 7.43 billion as of 2022.
5. What are some drivers contributing to market growth?
N/A
6. What are the notable trends driving market growth?
N/A
7. Are there any restraints impacting market growth?
N/A
8. Can you provide examples of recent developments in the market?
N/A
9. What pricing options are available for accessing the report?
Pricing options include single-user, multi-user, and enterprise licenses priced at USD 4900.00, USD 7350.00, and USD 9800.00 respectively.
10. Is the market size provided in terms of value or volume?
The market size is provided in terms of value, measured in billion.
11. Are there any specific market keywords associated with the report?
Yes, the market keyword associated with the report is "Dew Point Sensors," which aids in identifying and referencing the specific market segment covered.
12. How do I determine which pricing option suits my needs best?
The pricing options vary based on user requirements and access needs. Individual users may opt for single-user licenses, while businesses requiring broader access may choose multi-user or enterprise licenses for cost-effective access to the report.
13. Are there any additional resources or data provided in the Dew Point Sensors report?
While the report offers comprehensive insights, it's advisable to review the specific contents or supplementary materials provided to ascertain if additional resources or data are available.
14. How can I stay updated on further developments or reports in the Dew Point Sensors?
To stay informed about further developments, trends, and reports in the Dew Point Sensors, consider subscribing to industry newsletters, following relevant companies and organizations, or regularly checking reputable industry news sources and publications.
Methodology
Step 1 - Identification of Relevant Samples Size from Population Database


Step 2 - Approaches for Defining Global Market Size (Value, Volume* & Price*)

Note*: In applicable scenarios
Step 3 - Data Sources
Primary Research
- Web Analytics
- Survey Reports
- Research Institute
- Latest Research Reports
- Opinion Leaders
Secondary Research
- Annual Reports
- White Paper
- Latest Press Release
- Industry Association
- Paid Database
- Investor Presentations

Step 4 - Data Triangulation
Involves using different sources of information in order to increase the validity of a study
These sources are likely to be stakeholders in a program - participants, other researchers, program staff, other community members, and so on.
Then we put all data in single framework & apply various statistical tools to find out the dynamic on the market.
During the analysis stage, feedback from the stakeholder groups would be compared to determine areas of agreement as well as areas of divergence