

Key Insights
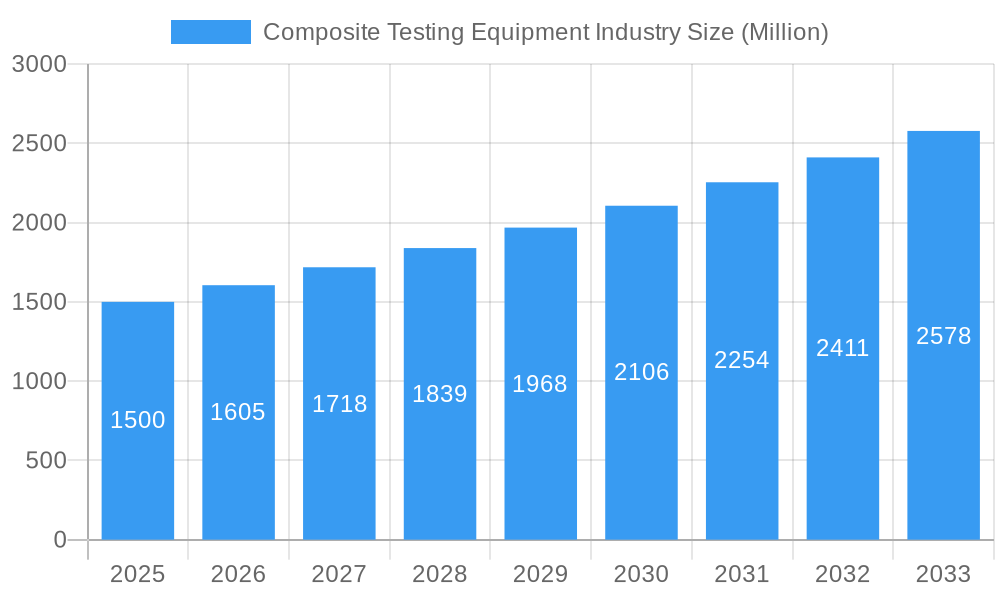
The global composite testing equipment market is poised for significant expansion, driven by escalating demand for high-performance materials across key industries. With a projected Compound Annual Growth Rate (CAGR) of 7.16%, the market is expected to grow from its current size of 2.58 billion in the base year 2025, reaching substantial new heights by 2033. Key growth drivers include the aerospace and defense sector's increasing reliance on lightweight, high-strength composites for enhanced safety and performance. Similarly, the automotive industry's pursuit of fuel efficiency and innovative vehicle designs is a major catalyst. The building and construction sector's growing adoption of composite materials in infrastructure projects further bolsters market growth. The increasing use of advanced non-destructive testing (NDT) techniques, which ensure thorough material evaluation without compromising sample integrity, is also a significant contributor. The market is segmented by product type (ceramic, continuous fiber, discontinuous fiber, polymer matrix, and other composites), testing method (destructive and non-destructive), and application (aerospace, automotive, building & construction, electricals & electronics, and others). Intense competition exists among established players such as Henkel, Intertek, and Element Materials Technology, alongside specialized testing laboratories. The Asia-Pacific region, fueled by its burgeoning manufacturing and construction sectors, is anticipated to lead market growth, eventually surpassing North America and Europe in market share.
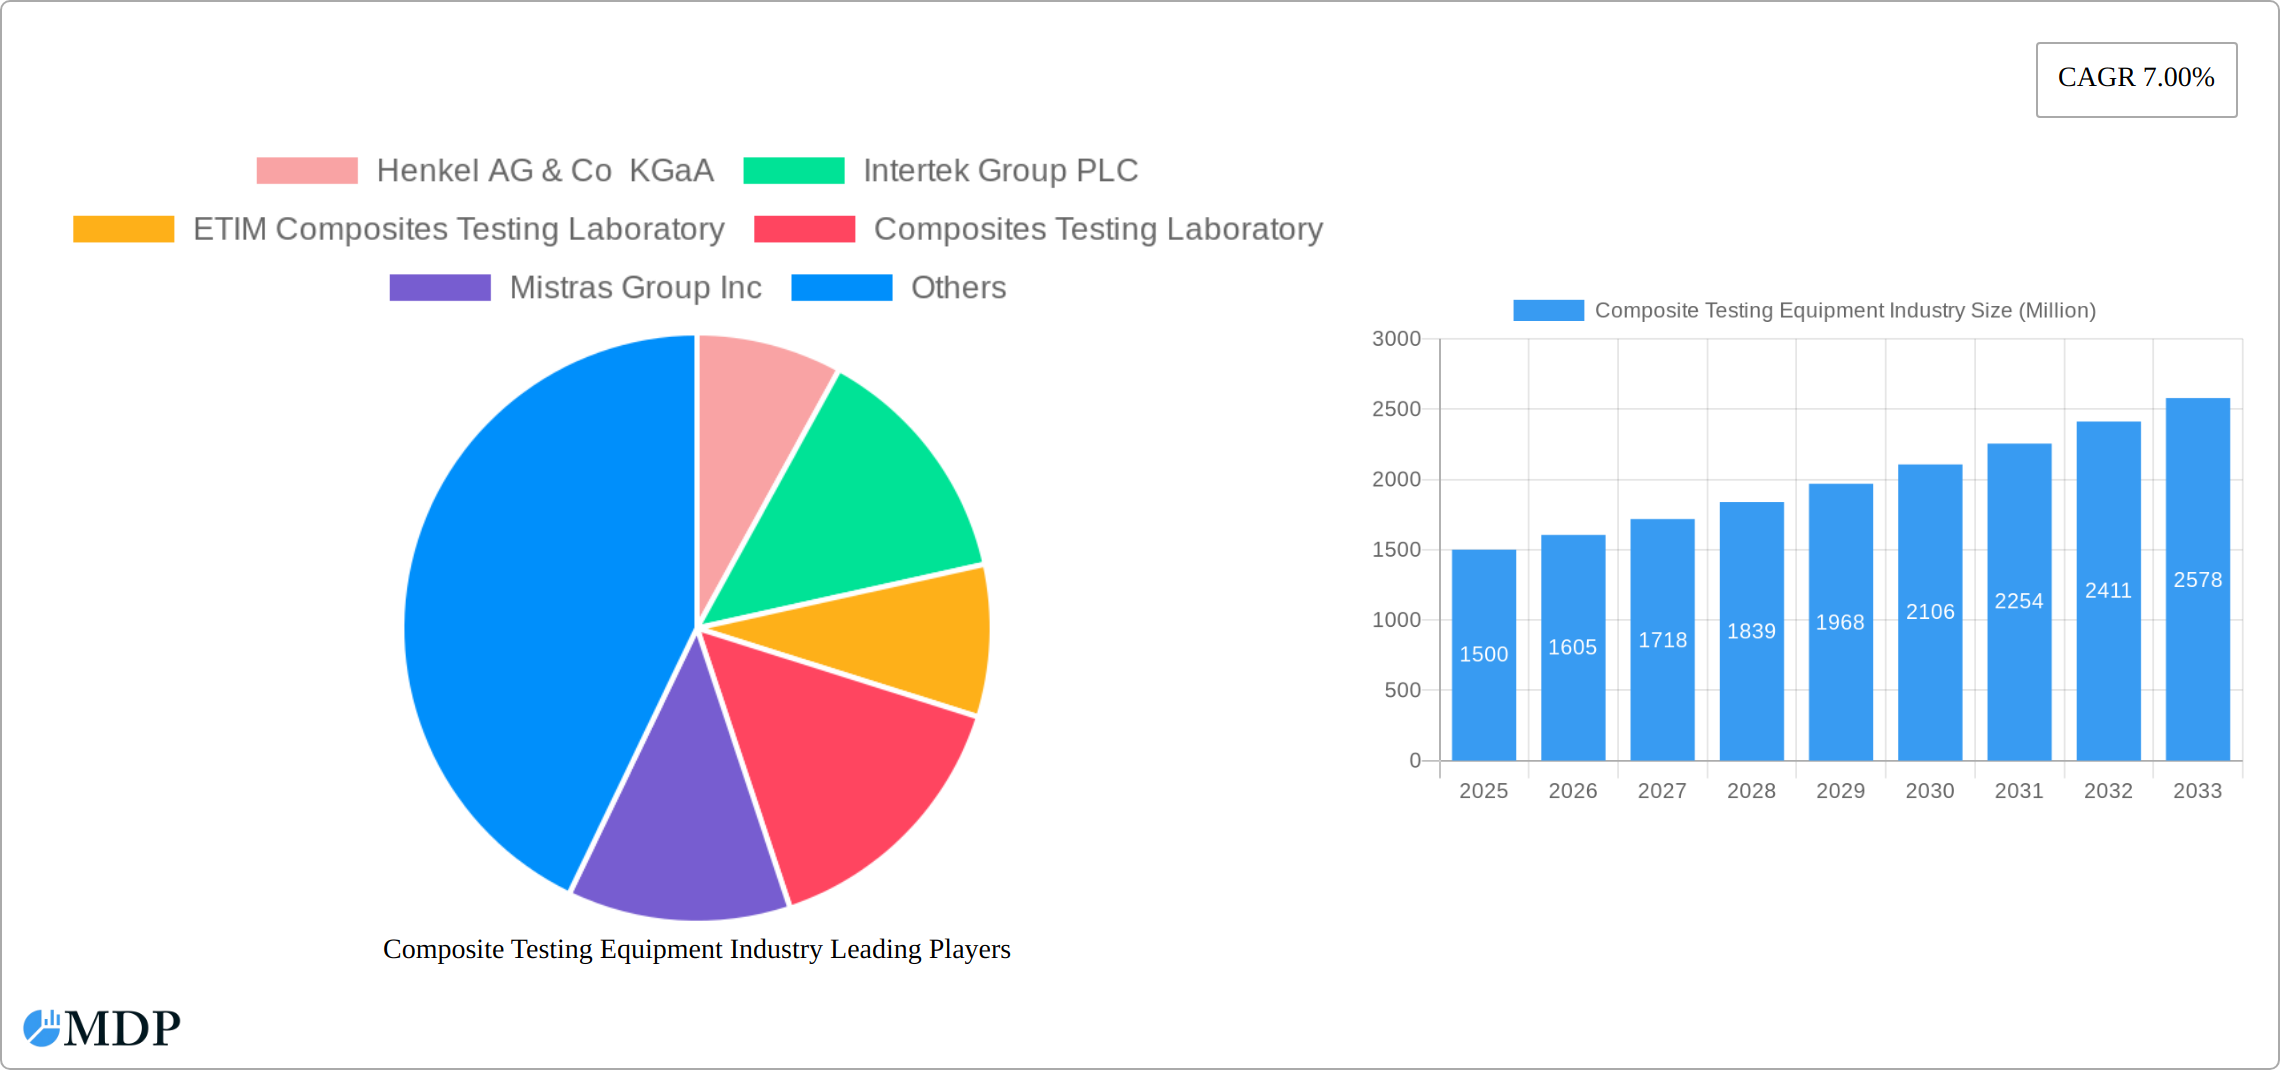
Composite Testing Equipment Industry Market Size (In Billion)
The market offers substantial opportunities for manufacturers of sophisticated testing equipment aligned with the evolving needs of composite materials. Companies that embrace advanced technologies like automated testing and data analytics are strategically positioned for increased market share. However, challenges such as the high cost of advanced equipment and the requirement for skilled technicians persist. Stringent regulatory requirements for material testing and safety standards present both hurdles and opportunities for market participants. Innovation and strategic partnerships will be crucial for sustained success in this competitive and dynamic market. Future growth will be intrinsically linked to advancements in composite materials, necessitating the parallel development of more sophisticated testing technologies.
Composite Testing Equipment Industry Company Market Share
Composite Testing Equipment Market Report: 2019-2033
This comprehensive report provides a detailed analysis of the global Composite Testing Equipment market, offering invaluable insights for stakeholders, investors, and industry professionals. Covering the period from 2019 to 2033, with a focus on 2025, this report meticulously examines market dynamics, trends, leading players, and future growth prospects. The report utilizes a robust methodology, incorporating both primary and secondary research, to provide a reliable and accurate assessment of this rapidly evolving market. The total market size is estimated at xx Million in 2025, projected to reach xx Million by 2033, exhibiting a CAGR of xx% during the forecast period (2025-2033).
Composite Testing Equipment Industry Market Dynamics & Concentration
The global composite testing equipment market is characterized by moderate concentration, with several key players holding significant market share. The market's growth is fueled by increasing demand for lightweight and high-strength materials across diverse industries, particularly aerospace & defense, automotive, and wind energy. Stringent quality control regulations and the need for rigorous testing procedures are driving market expansion. Technological advancements, such as the development of non-destructive testing (NDT) methods, are enhancing efficiency and accuracy. Furthermore, the market is experiencing considerable M&A activity, as larger players seek to consolidate their position and expand their product portfolios. The competitive landscape is dynamic, with ongoing innovation and the introduction of new testing equipment and methodologies.
- Market Share: The top 5 players account for approximately xx% of the global market share in 2025.
- M&A Activity: A total of xx M&A deals were recorded in the composite testing equipment industry between 2019 and 2024.
- Innovation Drivers: Advancements in NDT techniques, automation, and software integration.
- Regulatory Landscape: Stringent standards and regulations concerning material quality and safety drive demand for sophisticated testing equipment.
- Product Substitutes: Limited direct substitutes, though alternative testing methods may exist.
- End-User Trends: Growing preference for advanced composite materials due to their superior properties.
Composite Testing Equipment Industry Industry Trends & Analysis
The composite testing equipment market is experiencing robust growth driven by several factors. The increasing adoption of composites across various sectors is a major catalyst, spurred by the demand for lighter, stronger, and more durable materials. Technological advancements are leading to the development of more sophisticated and efficient testing equipment, enhancing accuracy and reducing testing times. Consumer preferences are shifting towards products made with high-performance composites, driving demand for reliable testing capabilities. Competitive dynamics are intense, with companies focusing on product innovation, strategic partnerships, and geographical expansion to gain a market edge. The market penetration of advanced testing techniques, like digital image correlation (DIC), is steadily increasing, leading to higher accuracy and data analysis capabilities.
- CAGR (2025-2033): xx%
- Market Penetration (NDT): xx% in 2025, projected to reach xx% by 2033.
- Growth Drivers: Rising demand for high-performance composites, technological advancements, and stringent quality control regulations.
- Technological Disruptions: Automation, AI-driven analysis, and advanced NDT techniques are reshaping the market landscape.
- Consumer Preferences: Demand for lightweight, high-strength, and environmentally friendly composite materials fuels market growth.
- Competitive Dynamics: Intense competition amongst established players and emerging companies driving innovation and price optimization.
Leading Markets & Segments in Composite Testing Equipment Industry
The aerospace and defense sector represents the dominant application segment for composite testing equipment, followed by the automotive industry. Geographically, North America and Europe hold significant market shares, driven by strong industrial bases and substantial investments in R&D. Within product types, Polymer Matrix Composites and Continuous Fiber Composites dominate, reflecting the widespread use of these materials. Destructive testing methods remain prevalent, although the adoption of non-destructive techniques is gradually increasing.
Key Drivers:
- Aerospace & Defense: Stringent safety and quality standards, high demand for lightweight materials.
- Automotive: Growing adoption of composites in vehicle bodies and components for weight reduction and fuel efficiency.
- Building & Construction: Increased use of composite materials in infrastructure projects.
- Economic Policies: Government initiatives promoting advanced materials and manufacturing technologies in several regions.
- Infrastructure Development: Significant investments in infrastructure globally are driving demand for robust construction materials and testing solutions.
Dominance Analysis:
The dominance of aerospace & defense is attributed to the stringent quality standards and high demand for lightweight materials in aircraft manufacturing. The automotive industry's significant adoption of composites for weight reduction contributes to its substantial market share. The prevalence of Polymer Matrix Composites and Continuous Fiber Composites reflects their extensive use across these key application sectors. North America's strong industrial base and technological advancements, along with Europe's established aerospace industry, underpin their leading regional positions.
Composite Testing Equipment Industry Product Developments
Recent product innovations focus on enhancing accuracy, automation, and data analysis capabilities. New testing equipment incorporates advanced NDT techniques like ultrasonic testing and thermography, alongside improved data acquisition and processing software. The market also sees the emergence of portable and modular testing systems, catering to diverse testing needs and locations. These developments improve efficiency, reduce testing times, and enable more comprehensive material characterization. Such features offer significant competitive advantages, enabling manufacturers to offer superior testing solutions to meet growing industry demands.
Key Drivers of Composite Testing Equipment Industry Growth
The growth of the composite testing equipment market is propelled by several factors. Firstly, the increasing adoption of composite materials across numerous sectors drives the need for robust testing methodologies. Secondly, stringent regulatory requirements concerning material quality and safety necessitate rigorous testing procedures. Thirdly, technological advancements, including the introduction of advanced NDT techniques and automated testing systems, are boosting market growth by improving accuracy, efficiency, and cost-effectiveness.
Challenges in the Composite Testing Equipment Industry Market
The composite testing equipment market, while experiencing robust growth, is not without its significant hurdles. A primary concern remains the substantial initial investment cost associated with acquiring cutting-edge testing machinery, which can present a considerable barrier to entry, particularly for burgeoning businesses and smaller enterprises. Furthermore, the intrinsic complexity of composite material testing procedures, often requiring highly specialized knowledge and skilled technicians, can impede wider market penetration. The global supply chain, prone to disruptions and volatility in raw material pricing, can directly impact the profitability and operational efficiency of manufacturers. Finally, the market is characterized by intense competition among established and emerging players, leading to considerable pressure on pricing strategies and profit margins.
Emerging Opportunities in Composite Testing Equipment Industry
Despite the existing challenges, the composite testing equipment market is brimming with promising opportunities. The escalating demand for lightweight yet high-strength composite materials across a diverse spectrum of industries, including renewable energy (especially for wind turbine components) and the advanced medical sector (for implants and prosthetics), is carving out significant avenues for expansion. The formation of strategic partnerships and collaborative ventures between leading equipment manufacturers and raw material suppliers can foster synergistic growth and accelerate innovation. The ongoing development and refinement of new testing standards and certifications are poised to further stimulate market expansion by ensuring quality and reliability. Moreover, the pervasive integration of digital technologies, such as AI-driven data analytics and IoT connectivity, presents a transformative opportunity to revolutionize testing capabilities, leading to more efficient, predictive, and insightful outcomes.
Leading Players in the Composite Testing Equipment Industry Sector
- Henkel AG & Co KGaA (Materials and Adhesives)
- Intertek Group PLC (Testing, Inspection, and Certification)
- ETIM Composites Testing Laboratory (Specialized Testing Services)
- Composites Testing Laboratory (Specialized Testing Services)
- Mistras Group Inc (Inspection, Monitoring, and Testing Solutions)
- Westmoreland Mechanical Testing & Research Inc (Mechanical Testing Services)
- Element Materials Technology (Materials Testing and Certification)
- Matrix Composites Inc (a subsidiary of ITT Inc) (Composite Material Manufacturing and Testing)
- Instron Corporation (a part of Illinois Tool Works Inc) (Materials Testing Equipment)
Key Milestones in Composite Testing Equipment Industry Industry
- 2020: Instron Corporation revolutionized the market with the introduction of a new, highly automated testing system designed for enhanced throughput and accuracy.
- 2021: Intertek Group PLC strategically expanded its service portfolio and geographic reach through the acquisition of a prominent smaller testing company.
- 2022: Element Materials Technology launched advanced Non-Destructive Testing (NDT) software, significantly improving the defect detection and analysis capabilities for composites.
- 2023: A notable milestone was achieved by a smaller, innovative competitor with the development of a highly portable composite testing unit, increasing accessibility for on-site inspections.
- 2024: The implementation of new regulatory standards across various sectors has a profound impact on the required testing procedures for specific composite materials, driving demand for updated equipment and methodologies.
Strategic Outlook for Composite Testing Equipment Industry Market
The future trajectory of the composite testing equipment market appears exceptionally promising, propelled by the sustained and growing global demand for advanced composite materials and the relentless pace of technological innovation. Strategic alliances and robust collaborations will be paramount for stakeholders to effectively navigate the increasingly competitive landscape and capitalize on emerging trends. A critical focus on developing user-friendly, cost-effective, and exceptionally accurate testing solutions will be essential for sustained market leadership. Significant growth opportunities lie in expanding into emerging geographical markets and the tailored development of specialized testing equipment for highly specific niche applications. Furthermore, the deep integration of Artificial Intelligence (AI) and Machine Learning (ML) into testing processes is set to dramatically enhance operational efficiency, refine data analysis capabilities, and ultimately drive further, unprecedented market expansion.
Composite Testing Equipment Industry Segmentation
-
1. Product Type
- 1.1. Ceramic Matrix Composites
- 1.2. Continuous Fiber Composites
- 1.3. Discontinuous Fiber Composites
- 1.4. Polymer Matrix Composites
- 1.5. Other Composites
-
2. Testing Method
- 2.1. Destructive
- 2.2. Non-destructive
-
3. Application
- 3.1. Aerospace and Defense
- 3.2. Automotive
- 3.3. Building & Construction
- 3.4. Electricals & Electronics
- 3.5. Others (Sporting Goods, Wind Energy, etc. )
Composite Testing Equipment Industry Segmentation By Geography
- 1. North America
- 2. Europe
- 3. Asia Pacific
- 4. Latin America
- 5. Middle East
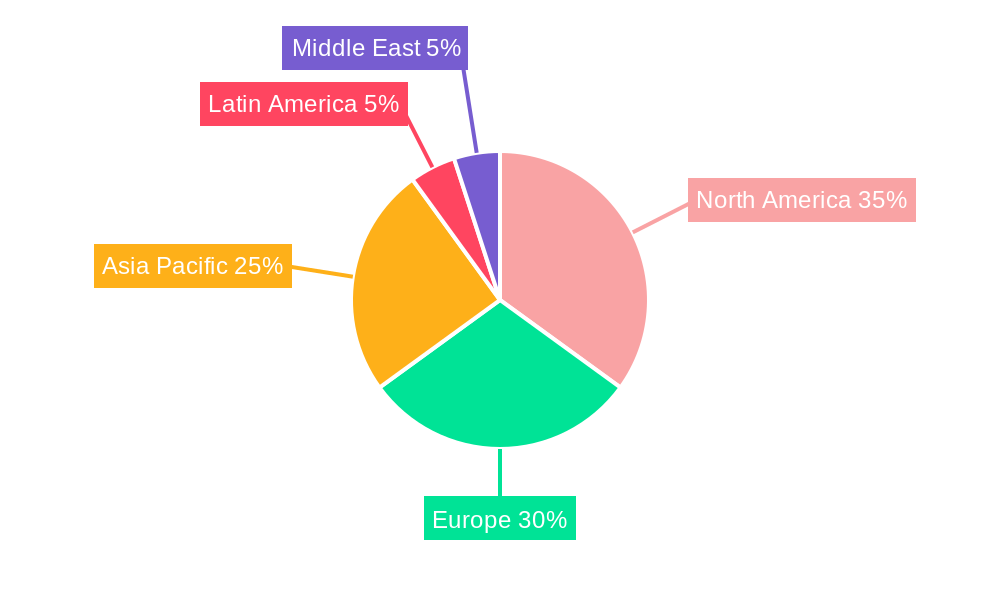
Composite Testing Equipment Industry Regional Market Share
Geographic Coverage of Composite Testing Equipment Industry
Composite Testing Equipment Industry REPORT HIGHLIGHTS
| Aspects | Details |
|---|---|
| Study Period | 2020-2034 |
| Base Year | 2025 |
| Estimated Year | 2026 |
| Forecast Period | 2026-2034 |
| Historical Period | 2020-2025 |
| Growth Rate | CAGR of 7.16% from 2020-2034 |
| Segmentation |
|
Table of Contents
- 1. Introduction
- 1.1. Research Scope
- 1.2. Market Segmentation
- 1.3. Research Objective
- 1.4. Definitions and Assumptions
- 2. Executive Summary
- 2.1. Market Snapshot
- 3. Market Dynamics
- 3.1. Market Drivers
- 3.2. Market Restrains
- 3.3. Market Trends
- 3.4. Market Opportunities
- 4. Market Factor Analysis
- 4.1. Porters Five Forces
- 4.1.1. Bargaining Power of Suppliers
- 4.1.2. Bargaining Power of Buyers
- 4.1.3. Threat of New Entrants
- 4.1.4. Threat of Substitutes
- 4.1.5. Competitive Rivalry
- 4.2. PESTEL analysis
- 4.3. BCG Analysis
- 4.3.1. Stars (High Growth, High Market Share)
- 4.3.2. Cash Cows (Low Growth, High Market Share)
- 4.3.3. Question Mark (High Growth, Low Market Share)
- 4.3.4. Dogs (Low Growth, Low Market Share)
- 4.4. Ansoff Matrix Analysis
- 4.5. Supply Chain Analysis
- 4.6. Regulatory Landscape
- 4.7. Current Market Potential and Opportunity Assessment (TAM–SAM–SOM Framework)
- 4.8. MDP Analyst Note
- 4.1. Porters Five Forces
- 5. Market Analysis, Insights and Forecast 2021-2033
- 5.1. Market Analysis, Insights and Forecast - by Product Type
- 5.1.1. Ceramic Matrix Composites
- 5.1.2. Continuous Fiber Composites
- 5.1.3. Discontinuous Fiber Composites
- 5.1.4. Polymer Matrix Composites
- 5.1.5. Other Composites
- 5.2. Market Analysis, Insights and Forecast - by Testing Method
- 5.2.1. Destructive
- 5.2.2. Non-destructive
- 5.3. Market Analysis, Insights and Forecast - by Application
- 5.3.1. Aerospace and Defense
- 5.3.2. Automotive
- 5.3.3. Building & Construction
- 5.3.4. Electricals & Electronics
- 5.3.5. Others (Sporting Goods, Wind Energy, etc. )
- 5.4. Market Analysis, Insights and Forecast - by Region
- 5.4.1. North America
- 5.4.2. Europe
- 5.4.3. Asia Pacific
- 5.4.4. Latin America
- 5.4.5. Middle East
- 5.1. Market Analysis, Insights and Forecast - by Product Type
- 6. Global Composite Testing Equipment Industry Analysis, Insights and Forecast, 2021-2033
- 6.1. Market Analysis, Insights and Forecast - by Product Type
- 6.1.1. Ceramic Matrix Composites
- 6.1.2. Continuous Fiber Composites
- 6.1.3. Discontinuous Fiber Composites
- 6.1.4. Polymer Matrix Composites
- 6.1.5. Other Composites
- 6.2. Market Analysis, Insights and Forecast - by Testing Method
- 6.2.1. Destructive
- 6.2.2. Non-destructive
- 6.3. Market Analysis, Insights and Forecast - by Application
- 6.3.1. Aerospace and Defense
- 6.3.2. Automotive
- 6.3.3. Building & Construction
- 6.3.4. Electricals & Electronics
- 6.3.5. Others (Sporting Goods, Wind Energy, etc. )
- 6.1. Market Analysis, Insights and Forecast - by Product Type
- 7. North America Composite Testing Equipment Industry Analysis, Insights and Forecast, 2020-2032
- 7.1. Market Analysis, Insights and Forecast - by Product Type
- 7.1.1. Ceramic Matrix Composites
- 7.1.2. Continuous Fiber Composites
- 7.1.3. Discontinuous Fiber Composites
- 7.1.4. Polymer Matrix Composites
- 7.1.5. Other Composites
- 7.2. Market Analysis, Insights and Forecast - by Testing Method
- 7.2.1. Destructive
- 7.2.2. Non-destructive
- 7.3. Market Analysis, Insights and Forecast - by Application
- 7.3.1. Aerospace and Defense
- 7.3.2. Automotive
- 7.3.3. Building & Construction
- 7.3.4. Electricals & Electronics
- 7.3.5. Others (Sporting Goods, Wind Energy, etc. )
- 7.1. Market Analysis, Insights and Forecast - by Product Type
- 8. Europe Composite Testing Equipment Industry Analysis, Insights and Forecast, 2020-2032
- 8.1. Market Analysis, Insights and Forecast - by Product Type
- 8.1.1. Ceramic Matrix Composites
- 8.1.2. Continuous Fiber Composites
- 8.1.3. Discontinuous Fiber Composites
- 8.1.4. Polymer Matrix Composites
- 8.1.5. Other Composites
- 8.2. Market Analysis, Insights and Forecast - by Testing Method
- 8.2.1. Destructive
- 8.2.2. Non-destructive
- 8.3. Market Analysis, Insights and Forecast - by Application
- 8.3.1. Aerospace and Defense
- 8.3.2. Automotive
- 8.3.3. Building & Construction
- 8.3.4. Electricals & Electronics
- 8.3.5. Others (Sporting Goods, Wind Energy, etc. )
- 8.1. Market Analysis, Insights and Forecast - by Product Type
- 9. Asia Pacific Composite Testing Equipment Industry Analysis, Insights and Forecast, 2020-2032
- 9.1. Market Analysis, Insights and Forecast - by Product Type
- 9.1.1. Ceramic Matrix Composites
- 9.1.2. Continuous Fiber Composites
- 9.1.3. Discontinuous Fiber Composites
- 9.1.4. Polymer Matrix Composites
- 9.1.5. Other Composites
- 9.2. Market Analysis, Insights and Forecast - by Testing Method
- 9.2.1. Destructive
- 9.2.2. Non-destructive
- 9.3. Market Analysis, Insights and Forecast - by Application
- 9.3.1. Aerospace and Defense
- 9.3.2. Automotive
- 9.3.3. Building & Construction
- 9.3.4. Electricals & Electronics
- 9.3.5. Others (Sporting Goods, Wind Energy, etc. )
- 9.1. Market Analysis, Insights and Forecast - by Product Type
- 10. Latin America Composite Testing Equipment Industry Analysis, Insights and Forecast, 2020-2032
- 10.1. Market Analysis, Insights and Forecast - by Product Type
- 10.1.1. Ceramic Matrix Composites
- 10.1.2. Continuous Fiber Composites
- 10.1.3. Discontinuous Fiber Composites
- 10.1.4. Polymer Matrix Composites
- 10.1.5. Other Composites
- 10.2. Market Analysis, Insights and Forecast - by Testing Method
- 10.2.1. Destructive
- 10.2.2. Non-destructive
- 10.3. Market Analysis, Insights and Forecast - by Application
- 10.3.1. Aerospace and Defense
- 10.3.2. Automotive
- 10.3.3. Building & Construction
- 10.3.4. Electricals & Electronics
- 10.3.5. Others (Sporting Goods, Wind Energy, etc. )
- 10.1. Market Analysis, Insights and Forecast - by Product Type
- 11. Middle East Composite Testing Equipment Industry Analysis, Insights and Forecast, 2020-2032
- 11.1. Market Analysis, Insights and Forecast - by Product Type
- 11.1.1. Ceramic Matrix Composites
- 11.1.2. Continuous Fiber Composites
- 11.1.3. Discontinuous Fiber Composites
- 11.1.4. Polymer Matrix Composites
- 11.1.5. Other Composites
- 11.2. Market Analysis, Insights and Forecast - by Testing Method
- 11.2.1. Destructive
- 11.2.2. Non-destructive
- 11.3. Market Analysis, Insights and Forecast - by Application
- 11.3.1. Aerospace and Defense
- 11.3.2. Automotive
- 11.3.3. Building & Construction
- 11.3.4. Electricals & Electronics
- 11.3.5. Others (Sporting Goods, Wind Energy, etc. )
- 11.1. Market Analysis, Insights and Forecast - by Product Type
- 12. Competitive Analysis
- 12.1. Company Profiles
- 12.1.1 Henkel AG & Co KGaA
- 12.1.1.1. Company Overview
- 12.1.1.2. Products
- 12.1.1.3. Company Financials
- 12.1.1.4. SWOT Analysis
- 12.1.2 Intertek Group PLC
- 12.1.2.1. Company Overview
- 12.1.2.2. Products
- 12.1.2.3. Company Financials
- 12.1.2.4. SWOT Analysis
- 12.1.3 ETIM Composites Testing Laboratory
- 12.1.3.1. Company Overview
- 12.1.3.2. Products
- 12.1.3.3. Company Financials
- 12.1.3.4. SWOT Analysis
- 12.1.4 Composites Testing Laboratory
- 12.1.4.1. Company Overview
- 12.1.4.2. Products
- 12.1.4.3. Company Financials
- 12.1.4.4. SWOT Analysis
- 12.1.5 Mistras Group Inc
- 12.1.5.1. Company Overview
- 12.1.5.2. Products
- 12.1.5.3. Company Financials
- 12.1.5.4. SWOT Analysis
- 12.1.6 Westmoreland Mechanical Testing & Research Inc
- 12.1.6.1. Company Overview
- 12.1.6.2. Products
- 12.1.6.3. Company Financials
- 12.1.6.4. SWOT Analysis
- 12.1.7 Element Materials Technology
- 12.1.7.1. Company Overview
- 12.1.7.2. Products
- 12.1.7.3. Company Financials
- 12.1.7.4. SWOT Analysis
- 12.1.8 Matrix Composites Inc (ITT Inc )
- 12.1.8.1. Company Overview
- 12.1.8.2. Products
- 12.1.8.3. Company Financials
- 12.1.8.4. SWOT Analysis
- 12.1.9 Instron Corporation (Illinois Tool Works Inc )
- 12.1.9.1. Company Overview
- 12.1.9.2. Products
- 12.1.9.3. Company Financials
- 12.1.9.4. SWOT Analysis
- 12.1.1 Henkel AG & Co KGaA
- 12.2. Market Entropy
- 12.2.1 Company's Key Areas Served
- 12.2.2 Recent Developments
- 12.3. Company Market Share Analysis 2025
- 12.3.1 Top 5 Companies Market Share Analysis
- 12.3.2 Top 3 Companies Market Share Analysis
- 12.4. List of Potential Customers
- 13. Research Methodology
List of Figures
- Figure 1: Global Composite Testing Equipment Industry Revenue Breakdown (billion, %) by Region 2025 & 2033
- Figure 2: Global Composite Testing Equipment Industry Volume Breakdown (K Unit, %) by Region 2025 & 2033
- Figure 3: North America Composite Testing Equipment Industry Revenue (billion), by Product Type 2025 & 2033
- Figure 4: North America Composite Testing Equipment Industry Volume (K Unit), by Product Type 2025 & 2033
- Figure 5: North America Composite Testing Equipment Industry Revenue Share (%), by Product Type 2025 & 2033
- Figure 6: North America Composite Testing Equipment Industry Volume Share (%), by Product Type 2025 & 2033
- Figure 7: North America Composite Testing Equipment Industry Revenue (billion), by Testing Method 2025 & 2033
- Figure 8: North America Composite Testing Equipment Industry Volume (K Unit), by Testing Method 2025 & 2033
- Figure 9: North America Composite Testing Equipment Industry Revenue Share (%), by Testing Method 2025 & 2033
- Figure 10: North America Composite Testing Equipment Industry Volume Share (%), by Testing Method 2025 & 2033
- Figure 11: North America Composite Testing Equipment Industry Revenue (billion), by Application 2025 & 2033
- Figure 12: North America Composite Testing Equipment Industry Volume (K Unit), by Application 2025 & 2033
- Figure 13: North America Composite Testing Equipment Industry Revenue Share (%), by Application 2025 & 2033
- Figure 14: North America Composite Testing Equipment Industry Volume Share (%), by Application 2025 & 2033
- Figure 15: North America Composite Testing Equipment Industry Revenue (billion), by Country 2025 & 2033
- Figure 16: North America Composite Testing Equipment Industry Volume (K Unit), by Country 2025 & 2033
- Figure 17: North America Composite Testing Equipment Industry Revenue Share (%), by Country 2025 & 2033
- Figure 18: North America Composite Testing Equipment Industry Volume Share (%), by Country 2025 & 2033
- Figure 19: Europe Composite Testing Equipment Industry Revenue (billion), by Product Type 2025 & 2033
- Figure 20: Europe Composite Testing Equipment Industry Volume (K Unit), by Product Type 2025 & 2033
- Figure 21: Europe Composite Testing Equipment Industry Revenue Share (%), by Product Type 2025 & 2033
- Figure 22: Europe Composite Testing Equipment Industry Volume Share (%), by Product Type 2025 & 2033
- Figure 23: Europe Composite Testing Equipment Industry Revenue (billion), by Testing Method 2025 & 2033
- Figure 24: Europe Composite Testing Equipment Industry Volume (K Unit), by Testing Method 2025 & 2033
- Figure 25: Europe Composite Testing Equipment Industry Revenue Share (%), by Testing Method 2025 & 2033
- Figure 26: Europe Composite Testing Equipment Industry Volume Share (%), by Testing Method 2025 & 2033
- Figure 27: Europe Composite Testing Equipment Industry Revenue (billion), by Application 2025 & 2033
- Figure 28: Europe Composite Testing Equipment Industry Volume (K Unit), by Application 2025 & 2033
- Figure 29: Europe Composite Testing Equipment Industry Revenue Share (%), by Application 2025 & 2033
- Figure 30: Europe Composite Testing Equipment Industry Volume Share (%), by Application 2025 & 2033
- Figure 31: Europe Composite Testing Equipment Industry Revenue (billion), by Country 2025 & 2033
- Figure 32: Europe Composite Testing Equipment Industry Volume (K Unit), by Country 2025 & 2033
- Figure 33: Europe Composite Testing Equipment Industry Revenue Share (%), by Country 2025 & 2033
- Figure 34: Europe Composite Testing Equipment Industry Volume Share (%), by Country 2025 & 2033
- Figure 35: Asia Pacific Composite Testing Equipment Industry Revenue (billion), by Product Type 2025 & 2033
- Figure 36: Asia Pacific Composite Testing Equipment Industry Volume (K Unit), by Product Type 2025 & 2033
- Figure 37: Asia Pacific Composite Testing Equipment Industry Revenue Share (%), by Product Type 2025 & 2033
- Figure 38: Asia Pacific Composite Testing Equipment Industry Volume Share (%), by Product Type 2025 & 2033
- Figure 39: Asia Pacific Composite Testing Equipment Industry Revenue (billion), by Testing Method 2025 & 2033
- Figure 40: Asia Pacific Composite Testing Equipment Industry Volume (K Unit), by Testing Method 2025 & 2033
- Figure 41: Asia Pacific Composite Testing Equipment Industry Revenue Share (%), by Testing Method 2025 & 2033
- Figure 42: Asia Pacific Composite Testing Equipment Industry Volume Share (%), by Testing Method 2025 & 2033
- Figure 43: Asia Pacific Composite Testing Equipment Industry Revenue (billion), by Application 2025 & 2033
- Figure 44: Asia Pacific Composite Testing Equipment Industry Volume (K Unit), by Application 2025 & 2033
- Figure 45: Asia Pacific Composite Testing Equipment Industry Revenue Share (%), by Application 2025 & 2033
- Figure 46: Asia Pacific Composite Testing Equipment Industry Volume Share (%), by Application 2025 & 2033
- Figure 47: Asia Pacific Composite Testing Equipment Industry Revenue (billion), by Country 2025 & 2033
- Figure 48: Asia Pacific Composite Testing Equipment Industry Volume (K Unit), by Country 2025 & 2033
- Figure 49: Asia Pacific Composite Testing Equipment Industry Revenue Share (%), by Country 2025 & 2033
- Figure 50: Asia Pacific Composite Testing Equipment Industry Volume Share (%), by Country 2025 & 2033
- Figure 51: Latin America Composite Testing Equipment Industry Revenue (billion), by Product Type 2025 & 2033
- Figure 52: Latin America Composite Testing Equipment Industry Volume (K Unit), by Product Type 2025 & 2033
- Figure 53: Latin America Composite Testing Equipment Industry Revenue Share (%), by Product Type 2025 & 2033
- Figure 54: Latin America Composite Testing Equipment Industry Volume Share (%), by Product Type 2025 & 2033
- Figure 55: Latin America Composite Testing Equipment Industry Revenue (billion), by Testing Method 2025 & 2033
- Figure 56: Latin America Composite Testing Equipment Industry Volume (K Unit), by Testing Method 2025 & 2033
- Figure 57: Latin America Composite Testing Equipment Industry Revenue Share (%), by Testing Method 2025 & 2033
- Figure 58: Latin America Composite Testing Equipment Industry Volume Share (%), by Testing Method 2025 & 2033
- Figure 59: Latin America Composite Testing Equipment Industry Revenue (billion), by Application 2025 & 2033
- Figure 60: Latin America Composite Testing Equipment Industry Volume (K Unit), by Application 2025 & 2033
- Figure 61: Latin America Composite Testing Equipment Industry Revenue Share (%), by Application 2025 & 2033
- Figure 62: Latin America Composite Testing Equipment Industry Volume Share (%), by Application 2025 & 2033
- Figure 63: Latin America Composite Testing Equipment Industry Revenue (billion), by Country 2025 & 2033
- Figure 64: Latin America Composite Testing Equipment Industry Volume (K Unit), by Country 2025 & 2033
- Figure 65: Latin America Composite Testing Equipment Industry Revenue Share (%), by Country 2025 & 2033
- Figure 66: Latin America Composite Testing Equipment Industry Volume Share (%), by Country 2025 & 2033
- Figure 67: Middle East Composite Testing Equipment Industry Revenue (billion), by Product Type 2025 & 2033
- Figure 68: Middle East Composite Testing Equipment Industry Volume (K Unit), by Product Type 2025 & 2033
- Figure 69: Middle East Composite Testing Equipment Industry Revenue Share (%), by Product Type 2025 & 2033
- Figure 70: Middle East Composite Testing Equipment Industry Volume Share (%), by Product Type 2025 & 2033
- Figure 71: Middle East Composite Testing Equipment Industry Revenue (billion), by Testing Method 2025 & 2033
- Figure 72: Middle East Composite Testing Equipment Industry Volume (K Unit), by Testing Method 2025 & 2033
- Figure 73: Middle East Composite Testing Equipment Industry Revenue Share (%), by Testing Method 2025 & 2033
- Figure 74: Middle East Composite Testing Equipment Industry Volume Share (%), by Testing Method 2025 & 2033
- Figure 75: Middle East Composite Testing Equipment Industry Revenue (billion), by Application 2025 & 2033
- Figure 76: Middle East Composite Testing Equipment Industry Volume (K Unit), by Application 2025 & 2033
- Figure 77: Middle East Composite Testing Equipment Industry Revenue Share (%), by Application 2025 & 2033
- Figure 78: Middle East Composite Testing Equipment Industry Volume Share (%), by Application 2025 & 2033
- Figure 79: Middle East Composite Testing Equipment Industry Revenue (billion), by Country 2025 & 2033
- Figure 80: Middle East Composite Testing Equipment Industry Volume (K Unit), by Country 2025 & 2033
- Figure 81: Middle East Composite Testing Equipment Industry Revenue Share (%), by Country 2025 & 2033
- Figure 82: Middle East Composite Testing Equipment Industry Volume Share (%), by Country 2025 & 2033
List of Tables
- Table 1: Global Composite Testing Equipment Industry Revenue billion Forecast, by Product Type 2020 & 2033
- Table 2: Global Composite Testing Equipment Industry Volume K Unit Forecast, by Product Type 2020 & 2033
- Table 3: Global Composite Testing Equipment Industry Revenue billion Forecast, by Testing Method 2020 & 2033
- Table 4: Global Composite Testing Equipment Industry Volume K Unit Forecast, by Testing Method 2020 & 2033
- Table 5: Global Composite Testing Equipment Industry Revenue billion Forecast, by Application 2020 & 2033
- Table 6: Global Composite Testing Equipment Industry Volume K Unit Forecast, by Application 2020 & 2033
- Table 7: Global Composite Testing Equipment Industry Revenue billion Forecast, by Region 2020 & 2033
- Table 8: Global Composite Testing Equipment Industry Volume K Unit Forecast, by Region 2020 & 2033
- Table 9: Global Composite Testing Equipment Industry Revenue billion Forecast, by Product Type 2020 & 2033
- Table 10: Global Composite Testing Equipment Industry Volume K Unit Forecast, by Product Type 2020 & 2033
- Table 11: Global Composite Testing Equipment Industry Revenue billion Forecast, by Testing Method 2020 & 2033
- Table 12: Global Composite Testing Equipment Industry Volume K Unit Forecast, by Testing Method 2020 & 2033
- Table 13: Global Composite Testing Equipment Industry Revenue billion Forecast, by Application 2020 & 2033
- Table 14: Global Composite Testing Equipment Industry Volume K Unit Forecast, by Application 2020 & 2033
- Table 15: Global Composite Testing Equipment Industry Revenue billion Forecast, by Country 2020 & 2033
- Table 16: Global Composite Testing Equipment Industry Volume K Unit Forecast, by Country 2020 & 2033
- Table 17: Global Composite Testing Equipment Industry Revenue billion Forecast, by Product Type 2020 & 2033
- Table 18: Global Composite Testing Equipment Industry Volume K Unit Forecast, by Product Type 2020 & 2033
- Table 19: Global Composite Testing Equipment Industry Revenue billion Forecast, by Testing Method 2020 & 2033
- Table 20: Global Composite Testing Equipment Industry Volume K Unit Forecast, by Testing Method 2020 & 2033
- Table 21: Global Composite Testing Equipment Industry Revenue billion Forecast, by Application 2020 & 2033
- Table 22: Global Composite Testing Equipment Industry Volume K Unit Forecast, by Application 2020 & 2033
- Table 23: Global Composite Testing Equipment Industry Revenue billion Forecast, by Country 2020 & 2033
- Table 24: Global Composite Testing Equipment Industry Volume K Unit Forecast, by Country 2020 & 2033
- Table 25: Global Composite Testing Equipment Industry Revenue billion Forecast, by Product Type 2020 & 2033
- Table 26: Global Composite Testing Equipment Industry Volume K Unit Forecast, by Product Type 2020 & 2033
- Table 27: Global Composite Testing Equipment Industry Revenue billion Forecast, by Testing Method 2020 & 2033
- Table 28: Global Composite Testing Equipment Industry Volume K Unit Forecast, by Testing Method 2020 & 2033
- Table 29: Global Composite Testing Equipment Industry Revenue billion Forecast, by Application 2020 & 2033
- Table 30: Global Composite Testing Equipment Industry Volume K Unit Forecast, by Application 2020 & 2033
- Table 31: Global Composite Testing Equipment Industry Revenue billion Forecast, by Country 2020 & 2033
- Table 32: Global Composite Testing Equipment Industry Volume K Unit Forecast, by Country 2020 & 2033
- Table 33: Global Composite Testing Equipment Industry Revenue billion Forecast, by Product Type 2020 & 2033
- Table 34: Global Composite Testing Equipment Industry Volume K Unit Forecast, by Product Type 2020 & 2033
- Table 35: Global Composite Testing Equipment Industry Revenue billion Forecast, by Testing Method 2020 & 2033
- Table 36: Global Composite Testing Equipment Industry Volume K Unit Forecast, by Testing Method 2020 & 2033
- Table 37: Global Composite Testing Equipment Industry Revenue billion Forecast, by Application 2020 & 2033
- Table 38: Global Composite Testing Equipment Industry Volume K Unit Forecast, by Application 2020 & 2033
- Table 39: Global Composite Testing Equipment Industry Revenue billion Forecast, by Country 2020 & 2033
- Table 40: Global Composite Testing Equipment Industry Volume K Unit Forecast, by Country 2020 & 2033
- Table 41: Global Composite Testing Equipment Industry Revenue billion Forecast, by Product Type 2020 & 2033
- Table 42: Global Composite Testing Equipment Industry Volume K Unit Forecast, by Product Type 2020 & 2033
- Table 43: Global Composite Testing Equipment Industry Revenue billion Forecast, by Testing Method 2020 & 2033
- Table 44: Global Composite Testing Equipment Industry Volume K Unit Forecast, by Testing Method 2020 & 2033
- Table 45: Global Composite Testing Equipment Industry Revenue billion Forecast, by Application 2020 & 2033
- Table 46: Global Composite Testing Equipment Industry Volume K Unit Forecast, by Application 2020 & 2033
- Table 47: Global Composite Testing Equipment Industry Revenue billion Forecast, by Country 2020 & 2033
- Table 48: Global Composite Testing Equipment Industry Volume K Unit Forecast, by Country 2020 & 2033
Frequently Asked Questions
1. What is the projected Compound Annual Growth Rate (CAGR) of the Composite Testing Equipment Industry?
The projected CAGR is approximately 7.16%.
2. Which companies are prominent players in the Composite Testing Equipment Industry?
Key companies in the market include Henkel AG & Co KGaA, Intertek Group PLC, ETIM Composites Testing Laboratory, Composites Testing Laboratory, Mistras Group Inc, Westmoreland Mechanical Testing & Research Inc , Element Materials Technology, Matrix Composites Inc (ITT Inc ), Instron Corporation (Illinois Tool Works Inc ).
3. What are the main segments of the Composite Testing Equipment Industry?
The market segments include Product Type, Testing Method, Application.
4. Can you provide details about the market size?
The market size is estimated to be USD 2.58 billion as of 2022.
5. What are some drivers contributing to market growth?
; Large Investments on Composites Testing Facilities in Asia-Pacific; Increasing Demand for Composite Testing From Automotive and Aerospace & Defense; Growing Demand for Testing of Hydraulic Frames in Aerospace & Defense Application.
6. What are the notable trends driving market growth?
Building and Construction Segment Expected to Show Significant Growth in Application.
7. Are there any restraints impacting market growth?
; Lack of Trained Operators and Expertise in Developing Regions; Issues Related to Recyclability of Composites.
8. Can you provide examples of recent developments in the market?
N/A
9. What pricing options are available for accessing the report?
Pricing options include single-user, multi-user, and enterprise licenses priced at USD 4750, USD 5250, and USD 8750 respectively.
10. Is the market size provided in terms of value or volume?
The market size is provided in terms of value, measured in billion and volume, measured in K Unit.
11. Are there any specific market keywords associated with the report?
Yes, the market keyword associated with the report is "Composite Testing Equipment Industry," which aids in identifying and referencing the specific market segment covered.
12. How do I determine which pricing option suits my needs best?
The pricing options vary based on user requirements and access needs. Individual users may opt for single-user licenses, while businesses requiring broader access may choose multi-user or enterprise licenses for cost-effective access to the report.
13. Are there any additional resources or data provided in the Composite Testing Equipment Industry report?
While the report offers comprehensive insights, it's advisable to review the specific contents or supplementary materials provided to ascertain if additional resources or data are available.
14. How can I stay updated on further developments or reports in the Composite Testing Equipment Industry?
To stay informed about further developments, trends, and reports in the Composite Testing Equipment Industry, consider subscribing to industry newsletters, following relevant companies and organizations, or regularly checking reputable industry news sources and publications.
Methodology
Step 1 - Identification of Relevant Samples Size from Population Database


Step 2 - Approaches for Defining Global Market Size (Value, Volume* & Price*)

Note*: In applicable scenarios
Step 3 - Data Sources
Primary Research
- Web Analytics
- Survey Reports
- Research Institute
- Latest Research Reports
- Opinion Leaders
Secondary Research
- Annual Reports
- White Paper
- Latest Press Release
- Industry Association
- Paid Database
- Investor Presentations

Step 4 - Data Triangulation
Involves using different sources of information in order to increase the validity of a study
These sources are likely to be stakeholders in a program - participants, other researchers, program staff, other community members, and so on.
Then we put all data in single framework & apply various statistical tools to find out the dynamic on the market.
During the analysis stage, feedback from the stakeholder groups would be compared to determine areas of agreement as well as areas of divergence