

Key Insights
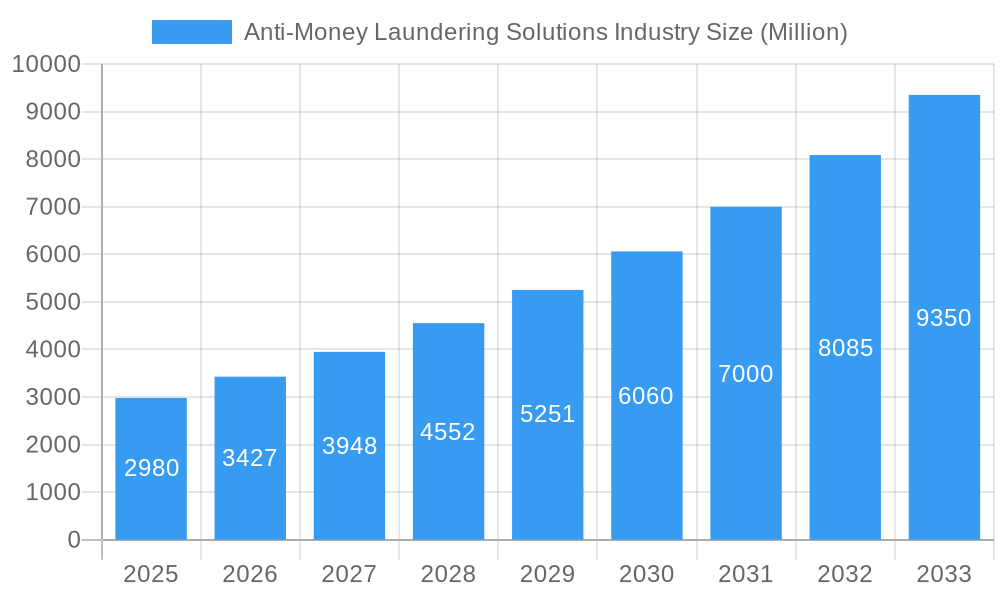
The Anti-Money Laundering (AML) solutions market, valued at $2.98 billion in 2025, is experiencing robust growth, projected to expand at a Compound Annual Growth Rate (CAGR) of 15.06% from 2025 to 2033. This surge is driven by increasingly stringent regulatory compliance requirements globally, the escalating sophistication of financial crimes, and the growing adoption of digital financial technologies. The rise in cross-border transactions and the increasing use of cryptocurrencies further fuel market expansion. Key market segments include KYC (Know Your Customer) systems, compliance reporting, transaction monitoring, and auditing & reporting solutions, delivered via software, services, on-cloud, and on-premise deployment models. North America currently holds a significant market share, followed by Europe and Asia Pacific, although the latter region is expected to witness faster growth driven by increasing digitalization and rising adoption of AML solutions by financial institutions. The competitive landscape is characterized by a mix of established players like NICE Actimize, SAS Institute, and Fiserv, alongside specialized technology providers and system integrators. Continuous innovation in areas like artificial intelligence (AI) and machine learning (ML) is transforming AML solutions, enabling better fraud detection and risk management.

Anti-Money Laundering Solutions Industry Market Size (In Billion)
The competitive intensity in the AML solutions market is high, prompting vendors to continually enhance their offerings with advanced analytics capabilities and integrated solutions. This focus on advanced technology is critical to address evolving money laundering techniques. While regulatory pressure is a significant driver, the market also faces challenges such as the high cost of implementation and maintenance of AML systems, data privacy concerns, and the need for ongoing training and updates to keep pace with evolving regulations and threats. Despite these challenges, the long-term outlook for the AML solutions market remains positive, driven by sustained regulatory enforcement and the continuous evolution of financial crime. The market is poised for significant growth as businesses prioritize proactive risk mitigation and strive to maintain a strong compliance posture.
Anti-Money Laundering Solutions Industry Company Market Share
Anti-Money Laundering (AML) Solutions Market Report: 2019-2033
This comprehensive report provides a detailed analysis of the Anti-Money Laundering (AML) solutions market, offering invaluable insights for industry stakeholders, investors, and strategic decision-makers. The report covers the period from 2019 to 2033, with a focus on the 2025-2033 forecast period, and includes a detailed examination of market dynamics, leading players, technological advancements, and emerging opportunities. The global AML solutions market is projected to reach $xx Million by 2033, showcasing significant growth potential.
Anti-Money Laundering Solutions Industry Market Dynamics & Concentration
The Anti-Money Laundering (AML) solutions market is experiencing robust growth driven by increasingly stringent regulatory compliance requirements and a rising need to combat financial crimes globally. Market concentration is moderate, with several major players holding significant shares, but a sizable number of niche players also contribute significantly. The market share of the top 5 players is estimated to be approximately 40% in 2025.
- Innovation Drivers: Advances in artificial intelligence (AI), machine learning (ML), and big data analytics are revolutionizing AML solutions, enabling faster, more accurate transaction monitoring and risk assessment.
- Regulatory Frameworks: The ever-evolving regulatory landscape, including KYC/AML regulations (like the Basel framework and GDPR), acts as a primary growth driver, compelling financial institutions to adopt robust AML solutions.
- Product Substitutes: Limited direct substitutes exist for dedicated AML solutions; however, general-purpose data analytics platforms may offer some overlapping functionalities, although typically with less specialized AML expertise.
- End-User Trends: Increasing adoption of cloud-based solutions is observed, driven by scalability, cost-effectiveness, and accessibility. Furthermore, a growing preference for integrated solutions offering a comprehensive suite of AML capabilities is evident.
- M&A Activities: The AML solutions market has witnessed a significant number of mergers and acquisitions (M&As), estimated at xx deals in the past five years, indicating consolidation and expansion of market leadership. For instance, the acquisition of Siron by IMTF in January 2023 highlights this trend.
Anti-Money Laundering Solutions Industry Industry Trends & Analysis
The AML solutions market is projected to experience a Compound Annual Growth Rate (CAGR) of xx% during the forecast period (2025-2033). This growth is fueled by several key factors:
- Increasing cross-border financial transactions: The rise in global trade and digital transactions necessitates more advanced AML solutions to prevent and detect illicit activities.
- Technological advancements: AI, ML, and blockchain technologies are enhancing AML capabilities, enabling more efficient and accurate risk assessments.
- Rising cybercrime and financial fraud: The escalating threat of cybercrime and financial fraud is driving demand for robust AML solutions to protect financial institutions and consumers.
- Enhanced regulatory scrutiny: Governments worldwide are strengthening regulations and imposing stricter penalties for non-compliance, pushing organizations towards adopting advanced AML solutions.
- Market Penetration: Market penetration is expected to increase significantly, particularly in emerging economies where regulatory frameworks are strengthening and digital financial inclusion is growing. The global market penetration is estimated at xx% in 2025.
Leading Markets & Segments in Anti-Money Laundering Solutions Industry
The North American region currently dominates the AML solutions market, primarily driven by strong regulatory frameworks and a high concentration of financial institutions. However, the Asia-Pacific region is projected to witness the fastest growth due to rapid digitalization and increasing financial transactions.
- By Solutions: Transaction monitoring is the largest segment, accounting for approximately 35% of the market in 2025, followed by KYC systems and compliance reporting.
- By Type: Software solutions constitute the largest segment, owing to their scalability, flexibility, and cost-effectiveness.
- By Deployment Model: On-cloud deployment models are gaining significant traction, exceeding 50% market share in 2025, due to their scalability and reduced infrastructure costs.
Key Drivers:
- North America: Stringent regulations, high adoption of advanced technologies, and a mature financial sector.
- Asia-Pacific: Rapid economic growth, expanding digital financial services, and increasing government initiatives to combat financial crime.
Anti-Money Laundering Solutions Industry Product Developments
Recent product developments emphasize AI-powered solutions offering real-time transaction monitoring, advanced risk scoring, and automated KYC/AML processes. These solutions aim to improve efficiency, reduce false positives, and enhance the overall effectiveness of AML programs. The focus is on integrating multiple data sources, providing a holistic view of risk, and streamlining compliance workflows. The integration of blockchain technology for enhancing transparency and traceability is also gaining traction.
Key Drivers of Anti-Money Laundering Solutions Industry Growth
The growth of the AML solutions market is primarily driven by a confluence of factors:
- Stricter regulatory compliance: Governments globally are imposing increasingly stringent regulations, making AML compliance a critical priority for financial institutions.
- Technological advancements: AI, ML, and big data analytics are revolutionizing AML capabilities, enabling more efficient and accurate detection of suspicious activities.
- Rising cybercrime: The rapid increase in cybercrime and financial fraud is prompting financial institutions to adopt advanced AML solutions to protect their assets and reputation.
Challenges in the Anti-Money Laundering Solutions Industry Market
The AML solutions market faces several challenges, including:
- High implementation costs: Implementing advanced AML solutions can be expensive, particularly for smaller financial institutions.
- Data privacy concerns: Collecting and analyzing vast amounts of customer data raises significant data privacy and security concerns.
- Keeping pace with evolving regulations: The ever-changing regulatory landscape requires continuous adaptation and updates to AML solutions.
- Integration complexities: Integrating new AML solutions with existing legacy systems can be a complex and time-consuming process.
Emerging Opportunities in Anti-Money Laundering Solutions Industry
Significant opportunities exist for AML solution providers:
- Expansion into emerging markets: Many developing economies lack comprehensive AML infrastructure, creating significant market potential.
- Developing AI-powered solutions: Further advancements in AI and ML can enhance the accuracy and efficiency of AML systems.
- Strategic partnerships and collaborations: Collaboration among technology providers, financial institutions, and regulatory bodies can accelerate innovation and market adoption.
Leading Players in the Anti-Money Laundering Solutions Industry Sector
- NICE Actimize (Nice Ltd)
- SAS Institute Inc
- Fiserv Inc
- Profile Systems & Software SA
- Temenos
- Refinitiv Ltd
- Experian Information Solutions Inc (Experian Ltd)
- Tata Consultancy Services Limited
- Fair Isaac Corporation (FICO)
- Intellect Design Arena
- Oracle Corporation
- Symphony Innovation LLC
- Fidelity National Information Services Inc (FIS)
- ACI Worldwide Inc
- Wolters Kluwer NV
- Ltimindtree Limited
Key Milestones in Anti-Money Laundering Solutions Industry Industry
- January 2023: IMTF acquired Siron AML solutions from FICO, significantly expanding its market presence.
- February 2023: Profile Software successfully implemented its RiskAvert solution at the Cooperative Bank of Epirus, demonstrating the effectiveness of its AML capabilities within the EU regulatory framework.
Strategic Outlook for Anti-Money Laundering Solutions Industry Market
The AML solutions market is poised for continued growth, driven by evolving regulations, technological advancements, and the increasing need to combat financial crime. Strategic opportunities lie in developing innovative AI-powered solutions, expanding into emerging markets, and fostering strategic partnerships to enhance market penetration and accelerate adoption. The market is expected to witness further consolidation through M&A activities, leading to a more concentrated landscape in the coming years.
Anti-Money Laundering Solutions Industry Segmentation
-
1. Solutions
- 1.1. Know Your Customer (KYC) Systems
- 1.2. Compliance Reporting
- 1.3. Transaction Monitoring
- 1.4. Auditing and Reporting
- 1.5. Other Solutions
-
2. Type
- 2.1. Software
- 2.2. Services
-
3. Deployment Model
- 3.1. On-cloud
- 3.2. On-premise
Anti-Money Laundering Solutions Industry Segmentation By Geography
-
1. North America
- 1.1. United States
- 1.2. Canada
-
2. Europe
- 2.1. United Kingdom
- 2.2. Germany
- 2.3. France
- 2.4. Spain
- 2.5. Rest of Europe
-
3. Asia Pacific
- 3.1. China
- 3.2. Japan
- 3.3. India
- 3.4. Southeast Asia
- 3.5. Rest of Asia Pacific
- 4. Latin America
- 5. Middle East and Africa

Anti-Money Laundering Solutions Industry Regional Market Share
Geographic Coverage of Anti-Money Laundering Solutions Industry
Anti-Money Laundering Solutions Industry REPORT HIGHLIGHTS
| Aspects | Details |
|---|---|
| Study Period | 2020-2034 |
| Base Year | 2025 |
| Estimated Year | 2026 |
| Forecast Period | 2026-2034 |
| Historical Period | 2020-2025 |
| Growth Rate | CAGR of 15.06% from 2020-2034 |
| Segmentation |
|
Table of Contents
- 1. Introduction
- 1.1. Research Scope
- 1.2. Market Segmentation
- 1.3. Research Methodology
- 1.4. Definitions and Assumptions
- 2. Executive Summary
- 2.1. Introduction
- 3. Market Dynamics
- 3.1. Introduction
- 3.2. Market Drivers
- 3.2.1. Increased Adoption of Digital/Mobile Payment Solutions; Stringent Government Regulations for Compliance Management
- 3.3. Market Restrains
- 3.3.1. Lack of Skilled Professionals
- 3.4. Market Trends
- 3.4.1. Know Your Customer (KYC) Systems to Witness Major Growth
- 4. Market Factor Analysis
- 4.1. Porters Five Forces
- 4.2. Supply/Value Chain
- 4.3. PESTEL analysis
- 4.4. Market Entropy
- 4.5. Patent/Trademark Analysis
- 5. Global Anti-Money Laundering Solutions Industry Analysis, Insights and Forecast, 2020-2032
- 5.1. Market Analysis, Insights and Forecast - by Solutions
- 5.1.1. Know Your Customer (KYC) Systems
- 5.1.2. Compliance Reporting
- 5.1.3. Transaction Monitoring
- 5.1.4. Auditing and Reporting
- 5.1.5. Other Solutions
- 5.2. Market Analysis, Insights and Forecast - by Type
- 5.2.1. Software
- 5.2.2. Services
- 5.3. Market Analysis, Insights and Forecast - by Deployment Model
- 5.3.1. On-cloud
- 5.3.2. On-premise
- 5.4. Market Analysis, Insights and Forecast - by Region
- 5.4.1. North America
- 5.4.2. Europe
- 5.4.3. Asia Pacific
- 5.4.4. Latin America
- 5.4.5. Middle East and Africa
- 5.1. Market Analysis, Insights and Forecast - by Solutions
- 6. North America Anti-Money Laundering Solutions Industry Analysis, Insights and Forecast, 2020-2032
- 6.1. Market Analysis, Insights and Forecast - by Solutions
- 6.1.1. Know Your Customer (KYC) Systems
- 6.1.2. Compliance Reporting
- 6.1.3. Transaction Monitoring
- 6.1.4. Auditing and Reporting
- 6.1.5. Other Solutions
- 6.2. Market Analysis, Insights and Forecast - by Type
- 6.2.1. Software
- 6.2.2. Services
- 6.3. Market Analysis, Insights and Forecast - by Deployment Model
- 6.3.1. On-cloud
- 6.3.2. On-premise
- 6.1. Market Analysis, Insights and Forecast - by Solutions
- 7. Europe Anti-Money Laundering Solutions Industry Analysis, Insights and Forecast, 2020-2032
- 7.1. Market Analysis, Insights and Forecast - by Solutions
- 7.1.1. Know Your Customer (KYC) Systems
- 7.1.2. Compliance Reporting
- 7.1.3. Transaction Monitoring
- 7.1.4. Auditing and Reporting
- 7.1.5. Other Solutions
- 7.2. Market Analysis, Insights and Forecast - by Type
- 7.2.1. Software
- 7.2.2. Services
- 7.3. Market Analysis, Insights and Forecast - by Deployment Model
- 7.3.1. On-cloud
- 7.3.2. On-premise
- 7.1. Market Analysis, Insights and Forecast - by Solutions
- 8. Asia Pacific Anti-Money Laundering Solutions Industry Analysis, Insights and Forecast, 2020-2032
- 8.1. Market Analysis, Insights and Forecast - by Solutions
- 8.1.1. Know Your Customer (KYC) Systems
- 8.1.2. Compliance Reporting
- 8.1.3. Transaction Monitoring
- 8.1.4. Auditing and Reporting
- 8.1.5. Other Solutions
- 8.2. Market Analysis, Insights and Forecast - by Type
- 8.2.1. Software
- 8.2.2. Services
- 8.3. Market Analysis, Insights and Forecast - by Deployment Model
- 8.3.1. On-cloud
- 8.3.2. On-premise
- 8.1. Market Analysis, Insights and Forecast - by Solutions
- 9. Latin America Anti-Money Laundering Solutions Industry Analysis, Insights and Forecast, 2020-2032
- 9.1. Market Analysis, Insights and Forecast - by Solutions
- 9.1.1. Know Your Customer (KYC) Systems
- 9.1.2. Compliance Reporting
- 9.1.3. Transaction Monitoring
- 9.1.4. Auditing and Reporting
- 9.1.5. Other Solutions
- 9.2. Market Analysis, Insights and Forecast - by Type
- 9.2.1. Software
- 9.2.2. Services
- 9.3. Market Analysis, Insights and Forecast - by Deployment Model
- 9.3.1. On-cloud
- 9.3.2. On-premise
- 9.1. Market Analysis, Insights and Forecast - by Solutions
- 10. Middle East and Africa Anti-Money Laundering Solutions Industry Analysis, Insights and Forecast, 2020-2032
- 10.1. Market Analysis, Insights and Forecast - by Solutions
- 10.1.1. Know Your Customer (KYC) Systems
- 10.1.2. Compliance Reporting
- 10.1.3. Transaction Monitoring
- 10.1.4. Auditing and Reporting
- 10.1.5. Other Solutions
- 10.2. Market Analysis, Insights and Forecast - by Type
- 10.2.1. Software
- 10.2.2. Services
- 10.3. Market Analysis, Insights and Forecast - by Deployment Model
- 10.3.1. On-cloud
- 10.3.2. On-premise
- 10.1. Market Analysis, Insights and Forecast - by Solutions
- 11. Competitive Analysis
- 11.1. Global Market Share Analysis 2025
- 11.2. Company Profiles
- 11.2.1 NICE Actimize (Nice Ltd)
- 11.2.1.1. Overview
- 11.2.1.2. Products
- 11.2.1.3. SWOT Analysis
- 11.2.1.4. Recent Developments
- 11.2.1.5. Financials (Based on Availability)
- 11.2.2 SAS Institute Inc
- 11.2.2.1. Overview
- 11.2.2.2. Products
- 11.2.2.3. SWOT Analysis
- 11.2.2.4. Recent Developments
- 11.2.2.5. Financials (Based on Availability)
- 11.2.3 Fiserv Inc
- 11.2.3.1. Overview
- 11.2.3.2. Products
- 11.2.3.3. SWOT Analysis
- 11.2.3.4. Recent Developments
- 11.2.3.5. Financials (Based on Availability)
- 11.2.4 Profile Systems & Software SA
- 11.2.4.1. Overview
- 11.2.4.2. Products
- 11.2.4.3. SWOT Analysis
- 11.2.4.4. Recent Developments
- 11.2.4.5. Financials (Based on Availability)
- 11.2.5 Temenos
- 11.2.5.1. Overview
- 11.2.5.2. Products
- 11.2.5.3. SWOT Analysis
- 11.2.5.4. Recent Developments
- 11.2.5.5. Financials (Based on Availability)
- 11.2.6 Refinitiv Ltd
- 11.2.6.1. Overview
- 11.2.6.2. Products
- 11.2.6.3. SWOT Analysis
- 11.2.6.4. Recent Developments
- 11.2.6.5. Financials (Based on Availability)
- 11.2.7 Experian Information Solutions Inc (Experian Ltd)
- 11.2.7.1. Overview
- 11.2.7.2. Products
- 11.2.7.3. SWOT Analysis
- 11.2.7.4. Recent Developments
- 11.2.7.5. Financials (Based on Availability)
- 11.2.8 Tata Consultancy Services Limited
- 11.2.8.1. Overview
- 11.2.8.2. Products
- 11.2.8.3. SWOT Analysis
- 11.2.8.4. Recent Developments
- 11.2.8.5. Financials (Based on Availability)
- 11.2.9 Fair Isaac Corporation (FICO)
- 11.2.9.1. Overview
- 11.2.9.2. Products
- 11.2.9.3. SWOT Analysis
- 11.2.9.4. Recent Developments
- 11.2.9.5. Financials (Based on Availability)
- 11.2.10 Intellect Design Arena*List Not Exhaustive
- 11.2.10.1. Overview
- 11.2.10.2. Products
- 11.2.10.3. SWOT Analysis
- 11.2.10.4. Recent Developments
- 11.2.10.5. Financials (Based on Availability)
- 11.2.11 Oracle Corporation
- 11.2.11.1. Overview
- 11.2.11.2. Products
- 11.2.11.3. SWOT Analysis
- 11.2.11.4. Recent Developments
- 11.2.11.5. Financials (Based on Availability)
- 11.2.12 Symphony Innovation LLC
- 11.2.12.1. Overview
- 11.2.12.2. Products
- 11.2.12.3. SWOT Analysis
- 11.2.12.4. Recent Developments
- 11.2.12.5. Financials (Based on Availability)
- 11.2.13 Fidelity National Information Services Inc (FIS)
- 11.2.13.1. Overview
- 11.2.13.2. Products
- 11.2.13.3. SWOT Analysis
- 11.2.13.4. Recent Developments
- 11.2.13.5. Financials (Based on Availability)
- 11.2.14 ACI Worldwide Inc
- 11.2.14.1. Overview
- 11.2.14.2. Products
- 11.2.14.3. SWOT Analysis
- 11.2.14.4. Recent Developments
- 11.2.14.5. Financials (Based on Availability)
- 11.2.15 Wolters Kluwer NV
- 11.2.15.1. Overview
- 11.2.15.2. Products
- 11.2.15.3. SWOT Analysis
- 11.2.15.4. Recent Developments
- 11.2.15.5. Financials (Based on Availability)
- 11.2.16 Ltimindtree Limited
- 11.2.16.1. Overview
- 11.2.16.2. Products
- 11.2.16.3. SWOT Analysis
- 11.2.16.4. Recent Developments
- 11.2.16.5. Financials (Based on Availability)
- 11.2.1 NICE Actimize (Nice Ltd)
List of Figures
- Figure 1: Global Anti-Money Laundering Solutions Industry Revenue Breakdown (Million, %) by Region 2025 & 2033
- Figure 2: North America Anti-Money Laundering Solutions Industry Revenue (Million), by Solutions 2025 & 2033
- Figure 3: North America Anti-Money Laundering Solutions Industry Revenue Share (%), by Solutions 2025 & 2033
- Figure 4: North America Anti-Money Laundering Solutions Industry Revenue (Million), by Type 2025 & 2033
- Figure 5: North America Anti-Money Laundering Solutions Industry Revenue Share (%), by Type 2025 & 2033
- Figure 6: North America Anti-Money Laundering Solutions Industry Revenue (Million), by Deployment Model 2025 & 2033
- Figure 7: North America Anti-Money Laundering Solutions Industry Revenue Share (%), by Deployment Model 2025 & 2033
- Figure 8: North America Anti-Money Laundering Solutions Industry Revenue (Million), by Country 2025 & 2033
- Figure 9: North America Anti-Money Laundering Solutions Industry Revenue Share (%), by Country 2025 & 2033
- Figure 10: Europe Anti-Money Laundering Solutions Industry Revenue (Million), by Solutions 2025 & 2033
- Figure 11: Europe Anti-Money Laundering Solutions Industry Revenue Share (%), by Solutions 2025 & 2033
- Figure 12: Europe Anti-Money Laundering Solutions Industry Revenue (Million), by Type 2025 & 2033
- Figure 13: Europe Anti-Money Laundering Solutions Industry Revenue Share (%), by Type 2025 & 2033
- Figure 14: Europe Anti-Money Laundering Solutions Industry Revenue (Million), by Deployment Model 2025 & 2033
- Figure 15: Europe Anti-Money Laundering Solutions Industry Revenue Share (%), by Deployment Model 2025 & 2033
- Figure 16: Europe Anti-Money Laundering Solutions Industry Revenue (Million), by Country 2025 & 2033
- Figure 17: Europe Anti-Money Laundering Solutions Industry Revenue Share (%), by Country 2025 & 2033
- Figure 18: Asia Pacific Anti-Money Laundering Solutions Industry Revenue (Million), by Solutions 2025 & 2033
- Figure 19: Asia Pacific Anti-Money Laundering Solutions Industry Revenue Share (%), by Solutions 2025 & 2033
- Figure 20: Asia Pacific Anti-Money Laundering Solutions Industry Revenue (Million), by Type 2025 & 2033
- Figure 21: Asia Pacific Anti-Money Laundering Solutions Industry Revenue Share (%), by Type 2025 & 2033
- Figure 22: Asia Pacific Anti-Money Laundering Solutions Industry Revenue (Million), by Deployment Model 2025 & 2033
- Figure 23: Asia Pacific Anti-Money Laundering Solutions Industry Revenue Share (%), by Deployment Model 2025 & 2033
- Figure 24: Asia Pacific Anti-Money Laundering Solutions Industry Revenue (Million), by Country 2025 & 2033
- Figure 25: Asia Pacific Anti-Money Laundering Solutions Industry Revenue Share (%), by Country 2025 & 2033
- Figure 26: Latin America Anti-Money Laundering Solutions Industry Revenue (Million), by Solutions 2025 & 2033
- Figure 27: Latin America Anti-Money Laundering Solutions Industry Revenue Share (%), by Solutions 2025 & 2033
- Figure 28: Latin America Anti-Money Laundering Solutions Industry Revenue (Million), by Type 2025 & 2033
- Figure 29: Latin America Anti-Money Laundering Solutions Industry Revenue Share (%), by Type 2025 & 2033
- Figure 30: Latin America Anti-Money Laundering Solutions Industry Revenue (Million), by Deployment Model 2025 & 2033
- Figure 31: Latin America Anti-Money Laundering Solutions Industry Revenue Share (%), by Deployment Model 2025 & 2033
- Figure 32: Latin America Anti-Money Laundering Solutions Industry Revenue (Million), by Country 2025 & 2033
- Figure 33: Latin America Anti-Money Laundering Solutions Industry Revenue Share (%), by Country 2025 & 2033
- Figure 34: Middle East and Africa Anti-Money Laundering Solutions Industry Revenue (Million), by Solutions 2025 & 2033
- Figure 35: Middle East and Africa Anti-Money Laundering Solutions Industry Revenue Share (%), by Solutions 2025 & 2033
- Figure 36: Middle East and Africa Anti-Money Laundering Solutions Industry Revenue (Million), by Type 2025 & 2033
- Figure 37: Middle East and Africa Anti-Money Laundering Solutions Industry Revenue Share (%), by Type 2025 & 2033
- Figure 38: Middle East and Africa Anti-Money Laundering Solutions Industry Revenue (Million), by Deployment Model 2025 & 2033
- Figure 39: Middle East and Africa Anti-Money Laundering Solutions Industry Revenue Share (%), by Deployment Model 2025 & 2033
- Figure 40: Middle East and Africa Anti-Money Laundering Solutions Industry Revenue (Million), by Country 2025 & 2033
- Figure 41: Middle East and Africa Anti-Money Laundering Solutions Industry Revenue Share (%), by Country 2025 & 2033
List of Tables
- Table 1: Global Anti-Money Laundering Solutions Industry Revenue Million Forecast, by Solutions 2020 & 2033
- Table 2: Global Anti-Money Laundering Solutions Industry Revenue Million Forecast, by Type 2020 & 2033
- Table 3: Global Anti-Money Laundering Solutions Industry Revenue Million Forecast, by Deployment Model 2020 & 2033
- Table 4: Global Anti-Money Laundering Solutions Industry Revenue Million Forecast, by Region 2020 & 2033
- Table 5: Global Anti-Money Laundering Solutions Industry Revenue Million Forecast, by Solutions 2020 & 2033
- Table 6: Global Anti-Money Laundering Solutions Industry Revenue Million Forecast, by Type 2020 & 2033
- Table 7: Global Anti-Money Laundering Solutions Industry Revenue Million Forecast, by Deployment Model 2020 & 2033
- Table 8: Global Anti-Money Laundering Solutions Industry Revenue Million Forecast, by Country 2020 & 2033
- Table 9: United States Anti-Money Laundering Solutions Industry Revenue (Million) Forecast, by Application 2020 & 2033
- Table 10: Canada Anti-Money Laundering Solutions Industry Revenue (Million) Forecast, by Application 2020 & 2033
- Table 11: Global Anti-Money Laundering Solutions Industry Revenue Million Forecast, by Solutions 2020 & 2033
- Table 12: Global Anti-Money Laundering Solutions Industry Revenue Million Forecast, by Type 2020 & 2033
- Table 13: Global Anti-Money Laundering Solutions Industry Revenue Million Forecast, by Deployment Model 2020 & 2033
- Table 14: Global Anti-Money Laundering Solutions Industry Revenue Million Forecast, by Country 2020 & 2033
- Table 15: United Kingdom Anti-Money Laundering Solutions Industry Revenue (Million) Forecast, by Application 2020 & 2033
- Table 16: Germany Anti-Money Laundering Solutions Industry Revenue (Million) Forecast, by Application 2020 & 2033
- Table 17: France Anti-Money Laundering Solutions Industry Revenue (Million) Forecast, by Application 2020 & 2033
- Table 18: Spain Anti-Money Laundering Solutions Industry Revenue (Million) Forecast, by Application 2020 & 2033
- Table 19: Rest of Europe Anti-Money Laundering Solutions Industry Revenue (Million) Forecast, by Application 2020 & 2033
- Table 20: Global Anti-Money Laundering Solutions Industry Revenue Million Forecast, by Solutions 2020 & 2033
- Table 21: Global Anti-Money Laundering Solutions Industry Revenue Million Forecast, by Type 2020 & 2033
- Table 22: Global Anti-Money Laundering Solutions Industry Revenue Million Forecast, by Deployment Model 2020 & 2033
- Table 23: Global Anti-Money Laundering Solutions Industry Revenue Million Forecast, by Country 2020 & 2033
- Table 24: China Anti-Money Laundering Solutions Industry Revenue (Million) Forecast, by Application 2020 & 2033
- Table 25: Japan Anti-Money Laundering Solutions Industry Revenue (Million) Forecast, by Application 2020 & 2033
- Table 26: India Anti-Money Laundering Solutions Industry Revenue (Million) Forecast, by Application 2020 & 2033
- Table 27: Southeast Asia Anti-Money Laundering Solutions Industry Revenue (Million) Forecast, by Application 2020 & 2033
- Table 28: Rest of Asia Pacific Anti-Money Laundering Solutions Industry Revenue (Million) Forecast, by Application 2020 & 2033
- Table 29: Global Anti-Money Laundering Solutions Industry Revenue Million Forecast, by Solutions 2020 & 2033
- Table 30: Global Anti-Money Laundering Solutions Industry Revenue Million Forecast, by Type 2020 & 2033
- Table 31: Global Anti-Money Laundering Solutions Industry Revenue Million Forecast, by Deployment Model 2020 & 2033
- Table 32: Global Anti-Money Laundering Solutions Industry Revenue Million Forecast, by Country 2020 & 2033
- Table 33: Global Anti-Money Laundering Solutions Industry Revenue Million Forecast, by Solutions 2020 & 2033
- Table 34: Global Anti-Money Laundering Solutions Industry Revenue Million Forecast, by Type 2020 & 2033
- Table 35: Global Anti-Money Laundering Solutions Industry Revenue Million Forecast, by Deployment Model 2020 & 2033
- Table 36: Global Anti-Money Laundering Solutions Industry Revenue Million Forecast, by Country 2020 & 2033
Frequently Asked Questions
1. What is the projected Compound Annual Growth Rate (CAGR) of the Anti-Money Laundering Solutions Industry?
The projected CAGR is approximately 15.06%.
2. Which companies are prominent players in the Anti-Money Laundering Solutions Industry?
Key companies in the market include NICE Actimize (Nice Ltd), SAS Institute Inc, Fiserv Inc, Profile Systems & Software SA, Temenos, Refinitiv Ltd, Experian Information Solutions Inc (Experian Ltd), Tata Consultancy Services Limited, Fair Isaac Corporation (FICO), Intellect Design Arena*List Not Exhaustive, Oracle Corporation, Symphony Innovation LLC, Fidelity National Information Services Inc (FIS), ACI Worldwide Inc, Wolters Kluwer NV, Ltimindtree Limited.
3. What are the main segments of the Anti-Money Laundering Solutions Industry?
The market segments include Solutions, Type, Deployment Model.
4. Can you provide details about the market size?
The market size is estimated to be USD 2.98 Million as of 2022.
5. What are some drivers contributing to market growth?
Increased Adoption of Digital/Mobile Payment Solutions; Stringent Government Regulations for Compliance Management.
6. What are the notable trends driving market growth?
Know Your Customer (KYC) Systems to Witness Major Growth.
7. Are there any restraints impacting market growth?
Lack of Skilled Professionals.
8. Can you provide examples of recent developments in the market?
January 2023 - IMTF, one of the leaders in regulatory technology and process automation for financial institutions, acquired the Siron anti-money laundering and compliance solutions developed by US-based FICO Corporation. With this acquisition, IMTF assumed the global operations of all Siron anti-financial crime solutions.
9. What pricing options are available for accessing the report?
Pricing options include single-user, multi-user, and enterprise licenses priced at USD 4750, USD 5250, and USD 8750 respectively.
10. Is the market size provided in terms of value or volume?
The market size is provided in terms of value, measured in Million.
11. Are there any specific market keywords associated with the report?
Yes, the market keyword associated with the report is "Anti-Money Laundering Solutions Industry," which aids in identifying and referencing the specific market segment covered.
12. How do I determine which pricing option suits my needs best?
The pricing options vary based on user requirements and access needs. Individual users may opt for single-user licenses, while businesses requiring broader access may choose multi-user or enterprise licenses for cost-effective access to the report.
13. Are there any additional resources or data provided in the Anti-Money Laundering Solutions Industry report?
While the report offers comprehensive insights, it's advisable to review the specific contents or supplementary materials provided to ascertain if additional resources or data are available.
14. How can I stay updated on further developments or reports in the Anti-Money Laundering Solutions Industry?
To stay informed about further developments, trends, and reports in the Anti-Money Laundering Solutions Industry, consider subscribing to industry newsletters, following relevant companies and organizations, or regularly checking reputable industry news sources and publications.
Methodology
Step 1 - Identification of Relevant Samples Size from Population Database


Step 2 - Approaches for Defining Global Market Size (Value, Volume* & Price*)

Note*: In applicable scenarios
Step 3 - Data Sources
Primary Research
- Web Analytics
- Survey Reports
- Research Institute
- Latest Research Reports
- Opinion Leaders
Secondary Research
- Annual Reports
- White Paper
- Latest Press Release
- Industry Association
- Paid Database
- Investor Presentations

Step 4 - Data Triangulation
Involves using different sources of information in order to increase the validity of a study
These sources are likely to be stakeholders in a program - participants, other researchers, program staff, other community members, and so on.
Then we put all data in single framework & apply various statistical tools to find out the dynamic on the market.
During the analysis stage, feedback from the stakeholder groups would be compared to determine areas of agreement as well as areas of divergence