

Key Insights
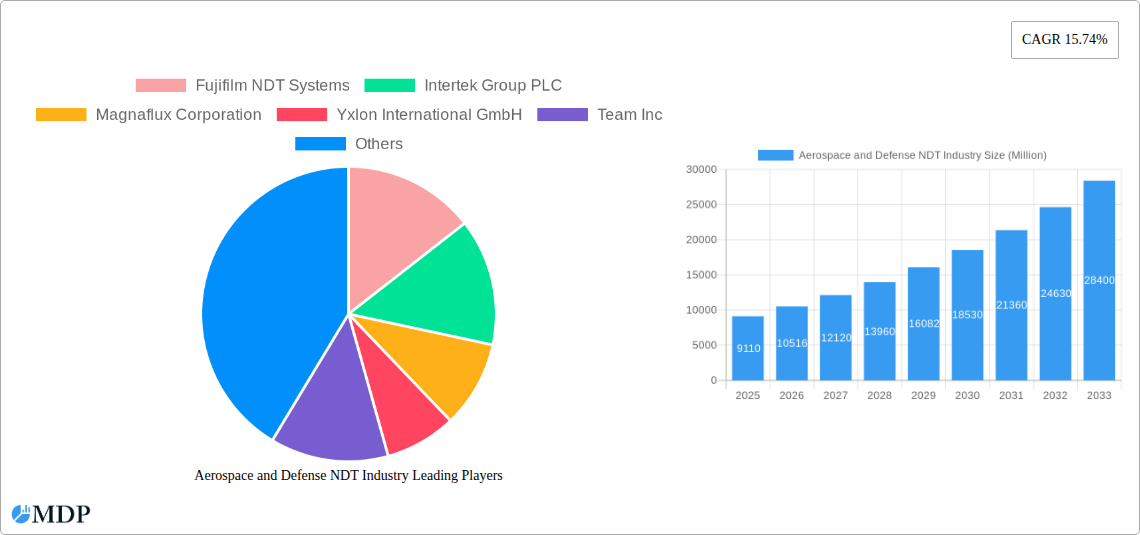
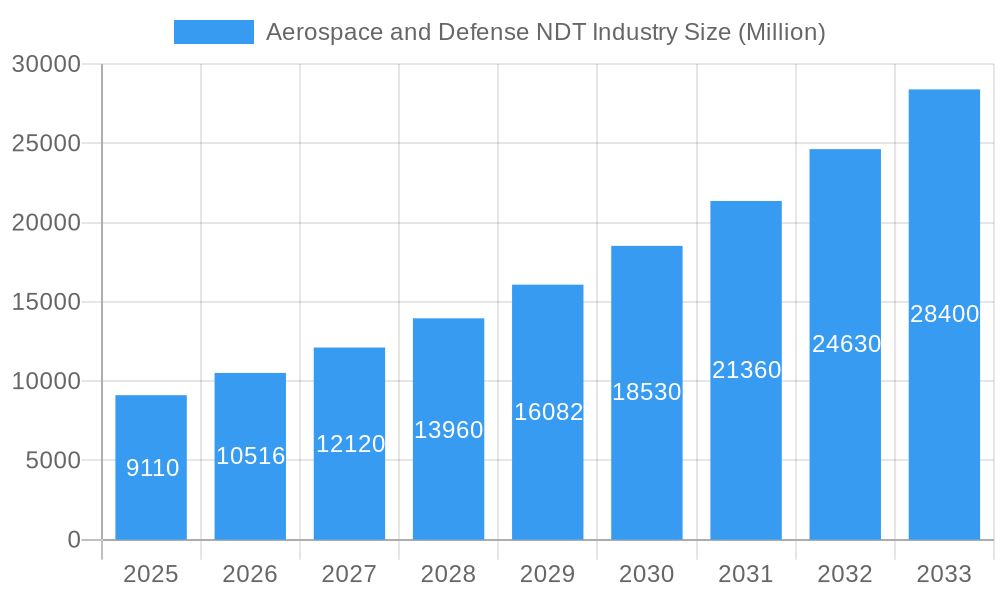
The Aerospace and Defense Non-Destructive Testing (NDT) market is experiencing robust growth, projected to reach a market size of $9.11 billion in 2025 and maintain a Compound Annual Growth Rate (CAGR) of 15.74% from 2025 to 2033. This expansion is driven by several key factors. Firstly, the increasing demand for enhanced aircraft safety and reliability necessitates rigorous inspection and maintenance procedures, fueling the adoption of advanced NDT technologies. Secondly, stringent regulatory compliance mandates, especially within the aerospace and defense sectors, necessitate comprehensive NDT practices throughout the lifecycle of aircraft and defense systems. Furthermore, technological advancements in NDT techniques, such as the integration of automation and artificial intelligence, are improving inspection efficiency, accuracy, and speed. The rising adoption of Radiography Testing, Ultrasonic Testing, and other advanced methods contributes significantly to market growth. Competition among established players like Fujifilm, Intertek, and Magnaflux, alongside emerging companies, fosters innovation and drives down costs, making NDT more accessible across the industry.
Aerospace and Defense NDT Industry Market Size (In Billion)
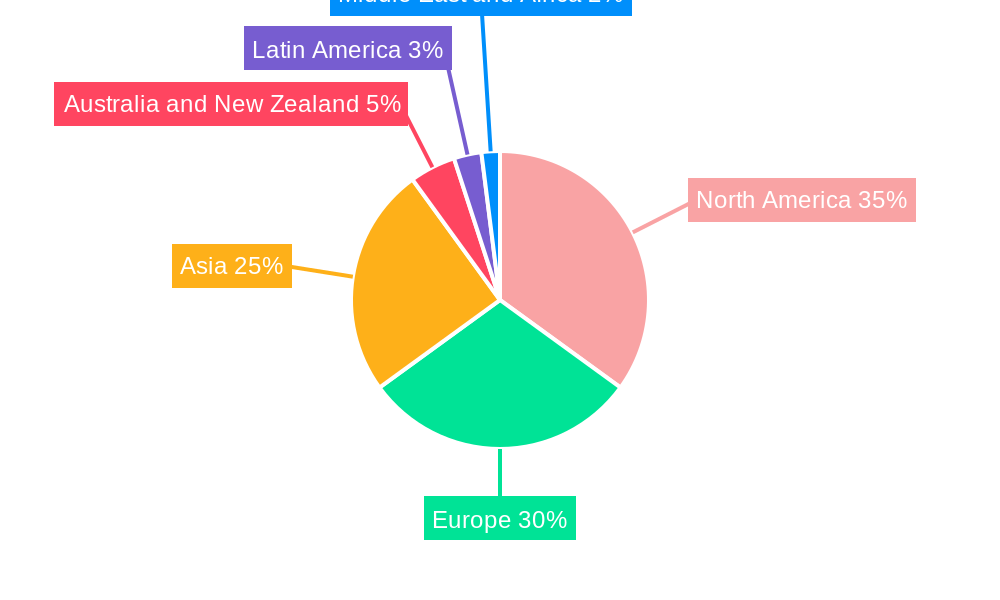
The market segmentation reveals a balanced distribution across service and equipment categories. Within the technology segment, Radiography, Ultrasonic, and Magnetic Particle Testing dominate, reflecting their established reliability and versatility. Geographic distribution shows a strong presence in North America and Europe, driven by established aerospace and defense industries. However, rapidly developing economies in Asia are poised for significant growth, driven by increasing domestic manufacturing and investments in their defense sectors. While data for specific regions is unavailable, it is reasonable to assume a proportional distribution based on existing industry knowledge, with North America and Europe holding larger shares initially, followed by Asia, and then other regions. This market's continued growth trajectory is anticipated to be influenced by factors such as government investment in defense modernization, technological progress in NDT techniques, and the increasing focus on predictive maintenance strategies.
Aerospace and Defense NDT Industry Company Market Share
Aerospace and Defense NDT Industry Market Report: 2019-2033
This comprehensive report provides an in-depth analysis of the Aerospace and Defense Non-Destructive Testing (NDT) industry, offering invaluable insights for stakeholders seeking to navigate this dynamic market. With a study period spanning 2019-2033, a base year of 2025, and a forecast period of 2025-2033, this report leverages extensive data analysis to provide actionable intelligence. The market size is projected at $xx Million in 2025 and expected to reach $xx Million by 2033. This report is essential for executives, investors, and industry professionals seeking to understand market trends, competitive dynamics, and future growth opportunities.
Aerospace and Defense NDT Industry Market Dynamics & Concentration
The Aerospace and Defense NDT market, valued at $xx Million in 2025, exhibits a moderately concentrated landscape. Key players like Fujifilm NDT Systems, Intertek Group PLC, and Magnaflux Corporation hold significant market share, estimated to be collectively around xx%. However, several smaller, specialized firms contribute to the market's dynamism. Innovation is a primary driver, spurred by the need for enhanced inspection techniques to meet stringent safety and quality standards within the aerospace and defense sectors. Stringent regulatory frameworks, particularly concerning safety and compliance, heavily influence market operations. The market also witnesses competition from alternative inspection methods and advancements in materials science, which could act as product substitutes. End-user trends emphasize the demand for faster, more accurate, and automated inspection processes. Furthermore, M&A activity remains a significant factor shaping the market, with approximately xx M&A deals recorded in the historical period (2019-2024), reflecting the industry’s consolidation and expansion strategies.
- Market Concentration: Moderately concentrated, with top players holding approximately xx% market share.
- Innovation Drivers: Demand for improved accuracy, speed, and automation in NDT processes.
- Regulatory Frameworks: Stringent safety and compliance regulations drive technological advancements.
- Product Substitutes: Emerging technologies and materials science advancements pose potential competition.
- End-User Trends: Growing preference for faster, more efficient, and automated NDT solutions.
- M&A Activity: Approximately xx M&A deals in 2019-2024, indicating industry consolidation.
Aerospace and Defense NDT Industry Trends & Analysis
The Aerospace and Defense NDT market is characterized by a robust CAGR of xx% during the forecast period (2025-2033), driven by several factors. Increased aircraft production and defense spending globally fuel demand for reliable and sophisticated NDT solutions. The market penetration of advanced NDT technologies like automated ultrasonic testing and phased array technology is expanding rapidly, transforming traditional methods. Consumer preferences lean toward integrated NDT solutions offering data analytics and improved workflow integration. This trend pushes technological disruption in the form of AI-powered image analysis and robotic inspection systems. Competitive dynamics are characterized by both fierce rivalry among established players and the emergence of innovative startups. These developments collectively contribute to the market's dynamic growth trajectory.
Leading Markets & Segments in Aerospace and Defense NDT Industry
North America currently holds the dominant position in the Aerospace and Defense NDT market, accounting for xx% of the global market share in 2025. This dominance is attributed to a robust aerospace manufacturing sector, significant defense investments, and stringent regulatory compliance requirements. Within the segments, the Equipment segment commands the largest share, due to high capital expenditure requirements for advanced NDT equipment. In terms of technologies, Radiography Testing and Ultrasonic Testing together account for over xx% of the market, reflecting their established importance in aerospace and defense applications.
- Key Drivers for North America's Dominance:
- Strong aerospace and defense manufacturing base.
- Significant government investment in defense and aerospace.
- Stringent regulatory compliance standards.
- Segment Dominance: The Equipment segment holds the largest market share.
- Technological Leadership: Radiography and Ultrasonic testing technologies are dominant.
Aerospace and Defense NDT Industry Product Developments
Recent product innovations are focused on enhancing automation, speed, and data analysis capabilities. Companies are integrating advanced technologies such as AI and machine learning into their NDT equipment and software to improve accuracy and efficiency. This focus on intelligent NDT systems caters to the growing demand for real-time data analysis and streamlined workflows, providing significant competitive advantages in terms of reduced inspection times and enhanced reliability. The market increasingly favors integrated solutions that provide a comprehensive suite of capabilities, from inspection planning to reporting.
Key Drivers of Aerospace and Defense NDT Industry Growth
The growth of the Aerospace and Defense NDT industry is significantly fueled by increasing defense budgets globally, a steady rise in the production and maintenance of commercial and military aircraft, and a stricter focus on regulatory compliance regarding safety standards. Advanced technological advancements in NDT solutions, like improved sensors and data analytics capabilities, are further propelling market growth. Government initiatives promoting advanced manufacturing and digitalization also contribute positively.
Challenges in the Aerospace and Defense NDT Industry Market
The market faces challenges including high initial investment costs for advanced NDT equipment, the complexity of integrating new technologies into existing workflows, and the need to continuously adapt to evolving regulatory requirements. Supply chain disruptions and competition from low-cost providers in emerging economies also pose significant challenges. These factors could hinder market growth by limiting accessibility for smaller companies and increasing operational costs for existing players. The overall impact is estimated to decrease market growth by approximately xx% annually.
Emerging Opportunities in Aerospace and Defense NDT Industry
The Aerospace and Defense NDT industry presents significant long-term growth opportunities. The increasing adoption of advanced technologies such as AI and machine learning for data analysis, the development of more portable and user-friendly NDT systems, and the growing demand for predictive maintenance solutions present vast potential. Strategic partnerships between NDT equipment manufacturers and aerospace and defense companies are also set to drive market expansion and propel industry progress.
Leading Players in the Aerospace and Defense NDT Industry Sector
Key Milestones in Aerospace and Defense NDT Industry Industry
- February 2024: Rad Source NDT launched the NDT 1000 X-ray Inspection System, capable of handling materials up to 0.5 inches thick. This launch expanded the capabilities in the X-ray inspection segment.
- March 2024: Eddyfi Technologies unveiled TubePro 6, advanced pre-inspection and reporting software, enhancing efficiency in heat exchanger inspections. This signifies a significant leap in software-driven NDT solutions.
Strategic Outlook for Aerospace and Defense NDT Industry Market
The future of the Aerospace and Defense NDT market is bright, driven by sustained growth in the aerospace and defense sectors. Strategic partnerships, technological advancements, and the increasing adoption of digital solutions will create significant opportunities for growth. Focus on developing advanced NDT solutions optimized for specific applications, such as composite materials inspection and additive manufacturing, will be crucial. Expanding into new markets and exploring emerging technologies will be key strategies for success.
Aerospace and Defense NDT Industry Segmentation
-
1. Type
- 1.1. Service
- 1.2. Equipment
-
2. Technology
- 2.1. Radiography Testing
- 2.2. Ultrasonic Testing
- 2.3. Magnetic
- 2.4. Liquid Penetrant Testing
- 2.5. Visual Inspection
- 2.6. Eddy Current
Aerospace and Defense NDT Industry Segmentation By Geography
- 1. North America
- 2. Europe
- 3. Asia
- 4. Australia and New Zealand
- 5. Latin America
- 6. Middle East and Africa
Aerospace and Defense NDT Industry Regional Market Share
Geographic Coverage of Aerospace and Defense NDT Industry
Aerospace and Defense NDT Industry REPORT HIGHLIGHTS
| Aspects | Details |
|---|---|
| Study Period | 2020-2034 |
| Base Year | 2025 |
| Estimated Year | 2026 |
| Forecast Period | 2026-2034 |
| Historical Period | 2020-2025 |
| Growth Rate | CAGR of 15.74% from 2020-2034 |
| Segmentation |
|
Table of Contents
- 1. Introduction
- 1.1. Research Scope
- 1.2. Market Segmentation
- 1.3. Research Objective
- 1.4. Definitions and Assumptions
- 2. Executive Summary
- 2.1. Market Snapshot
- 3. Market Dynamics
- 3.1. Market Drivers
- 3.2. Market Restrains
- 3.3. Market Trends
- 3.4. Market Opportunities
- 4. Market Factor Analysis
- 4.1. Porters Five Forces
- 4.1.1. Bargaining Power of Suppliers
- 4.1.2. Bargaining Power of Buyers
- 4.1.3. Threat of New Entrants
- 4.1.4. Threat of Substitutes
- 4.1.5. Competitive Rivalry
- 4.2. PESTEL analysis
- 4.3. BCG Analysis
- 4.3.1. Stars (High Growth, High Market Share)
- 4.3.2. Cash Cows (Low Growth, High Market Share)
- 4.3.3. Question Mark (High Growth, Low Market Share)
- 4.3.4. Dogs (Low Growth, Low Market Share)
- 4.4. Ansoff Matrix Analysis
- 4.5. Supply Chain Analysis
- 4.6. Regulatory Landscape
- 4.7. Current Market Potential and Opportunity Assessment (TAM–SAM–SOM Framework)
- 4.8. MDP Analyst Note
- 4.1. Porters Five Forces
- 5. Market Analysis, Insights and Forecast 2021-2033
- 5.1. Market Analysis, Insights and Forecast - by Type
- 5.1.1. Service
- 5.1.2. Equipment
- 5.2. Market Analysis, Insights and Forecast - by Technology
- 5.2.1. Radiography Testing
- 5.2.2. Ultrasonic Testing
- 5.2.3. Magnetic
- 5.2.4. Liquid Penetrant Testing
- 5.2.5. Visual Inspection
- 5.2.6. Eddy Current
- 5.3. Market Analysis, Insights and Forecast - by Region
- 5.3.1. North America
- 5.3.2. Europe
- 5.3.3. Asia
- 5.3.4. Australia and New Zealand
- 5.3.5. Latin America
- 5.3.6. Middle East and Africa
- 5.1. Market Analysis, Insights and Forecast - by Type
- 6. Global Aerospace and Defense NDT Industry Analysis, Insights and Forecast, 2021-2033
- 6.1. Market Analysis, Insights and Forecast - by Type
- 6.1.1. Service
- 6.1.2. Equipment
- 6.2. Market Analysis, Insights and Forecast - by Technology
- 6.2.1. Radiography Testing
- 6.2.2. Ultrasonic Testing
- 6.2.3. Magnetic
- 6.2.4. Liquid Penetrant Testing
- 6.2.5. Visual Inspection
- 6.2.6. Eddy Current
- 6.1. Market Analysis, Insights and Forecast - by Type
- 7. North America Aerospace and Defense NDT Industry Analysis, Insights and Forecast, 2020-2032
- 7.1. Market Analysis, Insights and Forecast - by Type
- 7.1.1. Service
- 7.1.2. Equipment
- 7.2. Market Analysis, Insights and Forecast - by Technology
- 7.2.1. Radiography Testing
- 7.2.2. Ultrasonic Testing
- 7.2.3. Magnetic
- 7.2.4. Liquid Penetrant Testing
- 7.2.5. Visual Inspection
- 7.2.6. Eddy Current
- 7.1. Market Analysis, Insights and Forecast - by Type
- 8. Europe Aerospace and Defense NDT Industry Analysis, Insights and Forecast, 2020-2032
- 8.1. Market Analysis, Insights and Forecast - by Type
- 8.1.1. Service
- 8.1.2. Equipment
- 8.2. Market Analysis, Insights and Forecast - by Technology
- 8.2.1. Radiography Testing
- 8.2.2. Ultrasonic Testing
- 8.2.3. Magnetic
- 8.2.4. Liquid Penetrant Testing
- 8.2.5. Visual Inspection
- 8.2.6. Eddy Current
- 8.1. Market Analysis, Insights and Forecast - by Type
- 9. Asia Aerospace and Defense NDT Industry Analysis, Insights and Forecast, 2020-2032
- 9.1. Market Analysis, Insights and Forecast - by Type
- 9.1.1. Service
- 9.1.2. Equipment
- 9.2. Market Analysis, Insights and Forecast - by Technology
- 9.2.1. Radiography Testing
- 9.2.2. Ultrasonic Testing
- 9.2.3. Magnetic
- 9.2.4. Liquid Penetrant Testing
- 9.2.5. Visual Inspection
- 9.2.6. Eddy Current
- 9.1. Market Analysis, Insights and Forecast - by Type
- 10. Australia and New Zealand Aerospace and Defense NDT Industry Analysis, Insights and Forecast, 2020-2032
- 10.1. Market Analysis, Insights and Forecast - by Type
- 10.1.1. Service
- 10.1.2. Equipment
- 10.2. Market Analysis, Insights and Forecast - by Technology
- 10.2.1. Radiography Testing
- 10.2.2. Ultrasonic Testing
- 10.2.3. Magnetic
- 10.2.4. Liquid Penetrant Testing
- 10.2.5. Visual Inspection
- 10.2.6. Eddy Current
- 10.1. Market Analysis, Insights and Forecast - by Type
- 11. Latin America Aerospace and Defense NDT Industry Analysis, Insights and Forecast, 2020-2032
- 11.1. Market Analysis, Insights and Forecast - by Type
- 11.1.1. Service
- 11.1.2. Equipment
- 11.2. Market Analysis, Insights and Forecast - by Technology
- 11.2.1. Radiography Testing
- 11.2.2. Ultrasonic Testing
- 11.2.3. Magnetic
- 11.2.4. Liquid Penetrant Testing
- 11.2.5. Visual Inspection
- 11.2.6. Eddy Current
- 11.1. Market Analysis, Insights and Forecast - by Type
- 12. Middle East and Africa Aerospace and Defense NDT Industry Analysis, Insights and Forecast, 2020-2032
- 12.1. Market Analysis, Insights and Forecast - by Type
- 12.1.1. Service
- 12.1.2. Equipment
- 12.2. Market Analysis, Insights and Forecast - by Technology
- 12.2.1. Radiography Testing
- 12.2.2. Ultrasonic Testing
- 12.2.3. Magnetic
- 12.2.4. Liquid Penetrant Testing
- 12.2.5. Visual Inspection
- 12.2.6. Eddy Current
- 12.1. Market Analysis, Insights and Forecast - by Type
- 13. Competitive Analysis
- 13.1. Company Profiles
- 13.1.1 Fujifilm NDT Systems
- 13.1.1.1. Company Overview
- 13.1.1.2. Products
- 13.1.1.3. Company Financials
- 13.1.1.4. SWOT Analysis
- 13.1.2 Intertek Group PLC
- 13.1.2.1. Company Overview
- 13.1.2.2. Products
- 13.1.2.3. Company Financials
- 13.1.2.4. SWOT Analysis
- 13.1.3 Magnaflux Corporation
- 13.1.3.1. Company Overview
- 13.1.3.2. Products
- 13.1.3.3. Company Financials
- 13.1.3.4. SWOT Analysis
- 13.1.4 Yxlon International GmbH
- 13.1.4.1. Company Overview
- 13.1.4.2. Products
- 13.1.4.3. Company Financials
- 13.1.4.4. SWOT Analysis
- 13.1.5 Team Inc
- 13.1.5.1. Company Overview
- 13.1.5.2. Products
- 13.1.5.3. Company Financials
- 13.1.5.4. SWOT Analysis
- 13.1.6 SGS Group
- 13.1.6.1. Company Overview
- 13.1.6.2. Products
- 13.1.6.3. Company Financials
- 13.1.6.4. SWOT Analysis
- 13.1.7 TUV Rheinland Ag
- 13.1.7.1. Company Overview
- 13.1.7.2. Products
- 13.1.7.3. Company Financials
- 13.1.7.4. SWOT Analysis
- 13.1.8 NikonMetrology Inc
- 13.1.8.1. Company Overview
- 13.1.8.2. Products
- 13.1.8.3. Company Financials
- 13.1.8.4. SWOT Analysis
- 13.1.9 Mistras Group
- 13.1.9.1. Company Overview
- 13.1.9.2. Products
- 13.1.9.3. Company Financials
- 13.1.9.4. SWOT Analysis
- 13.1.10 Olympus Corporation
- 13.1.10.1. Company Overview
- 13.1.10.2. Products
- 13.1.10.3. Company Financials
- 13.1.10.4. SWOT Analysis
- 13.1.11 GE Measurement and Control
- 13.1.11.1. Company Overview
- 13.1.11.2. Products
- 13.1.11.3. Company Financials
- 13.1.11.4. SWOT Analysis
- 13.1.12 Applus Services S A
- 13.1.12.1. Company Overview
- 13.1.12.2. Products
- 13.1.12.3. Company Financials
- 13.1.12.4. SWOT Analysis
- 13.1.13 FLIR Systems Inc *List Not Exhaustive
- 13.1.13.1. Company Overview
- 13.1.13.2. Products
- 13.1.13.3. Company Financials
- 13.1.13.4. SWOT Analysis
- 13.1.14 Gould-Bass Co
- 13.1.14.1. Company Overview
- 13.1.14.2. Products
- 13.1.14.3. Company Financials
- 13.1.14.4. SWOT Analysis
- 13.1.1 Fujifilm NDT Systems
- 13.2. Market Entropy
- 13.2.1 Company's Key Areas Served
- 13.2.2 Recent Developments
- 13.3. Company Market Share Analysis 2025
- 13.3.1 Top 5 Companies Market Share Analysis
- 13.3.2 Top 3 Companies Market Share Analysis
- 13.4. List of Potential Customers
- 14. Research Methodology
List of Figures
- Figure 1: Global Aerospace and Defense NDT Industry Revenue Breakdown (Million, %) by Region 2025 & 2033
- Figure 2: North America Aerospace and Defense NDT Industry Revenue (Million), by Type 2025 & 2033
- Figure 3: North America Aerospace and Defense NDT Industry Revenue Share (%), by Type 2025 & 2033
- Figure 4: North America Aerospace and Defense NDT Industry Revenue (Million), by Technology 2025 & 2033
- Figure 5: North America Aerospace and Defense NDT Industry Revenue Share (%), by Technology 2025 & 2033
- Figure 6: North America Aerospace and Defense NDT Industry Revenue (Million), by Country 2025 & 2033
- Figure 7: North America Aerospace and Defense NDT Industry Revenue Share (%), by Country 2025 & 2033
- Figure 8: Europe Aerospace and Defense NDT Industry Revenue (Million), by Type 2025 & 2033
- Figure 9: Europe Aerospace and Defense NDT Industry Revenue Share (%), by Type 2025 & 2033
- Figure 10: Europe Aerospace and Defense NDT Industry Revenue (Million), by Technology 2025 & 2033
- Figure 11: Europe Aerospace and Defense NDT Industry Revenue Share (%), by Technology 2025 & 2033
- Figure 12: Europe Aerospace and Defense NDT Industry Revenue (Million), by Country 2025 & 2033
- Figure 13: Europe Aerospace and Defense NDT Industry Revenue Share (%), by Country 2025 & 2033
- Figure 14: Asia Aerospace and Defense NDT Industry Revenue (Million), by Type 2025 & 2033
- Figure 15: Asia Aerospace and Defense NDT Industry Revenue Share (%), by Type 2025 & 2033
- Figure 16: Asia Aerospace and Defense NDT Industry Revenue (Million), by Technology 2025 & 2033
- Figure 17: Asia Aerospace and Defense NDT Industry Revenue Share (%), by Technology 2025 & 2033
- Figure 18: Asia Aerospace and Defense NDT Industry Revenue (Million), by Country 2025 & 2033
- Figure 19: Asia Aerospace and Defense NDT Industry Revenue Share (%), by Country 2025 & 2033
- Figure 20: Australia and New Zealand Aerospace and Defense NDT Industry Revenue (Million), by Type 2025 & 2033
- Figure 21: Australia and New Zealand Aerospace and Defense NDT Industry Revenue Share (%), by Type 2025 & 2033
- Figure 22: Australia and New Zealand Aerospace and Defense NDT Industry Revenue (Million), by Technology 2025 & 2033
- Figure 23: Australia and New Zealand Aerospace and Defense NDT Industry Revenue Share (%), by Technology 2025 & 2033
- Figure 24: Australia and New Zealand Aerospace and Defense NDT Industry Revenue (Million), by Country 2025 & 2033
- Figure 25: Australia and New Zealand Aerospace and Defense NDT Industry Revenue Share (%), by Country 2025 & 2033
- Figure 26: Latin America Aerospace and Defense NDT Industry Revenue (Million), by Type 2025 & 2033
- Figure 27: Latin America Aerospace and Defense NDT Industry Revenue Share (%), by Type 2025 & 2033
- Figure 28: Latin America Aerospace and Defense NDT Industry Revenue (Million), by Technology 2025 & 2033
- Figure 29: Latin America Aerospace and Defense NDT Industry Revenue Share (%), by Technology 2025 & 2033
- Figure 30: Latin America Aerospace and Defense NDT Industry Revenue (Million), by Country 2025 & 2033
- Figure 31: Latin America Aerospace and Defense NDT Industry Revenue Share (%), by Country 2025 & 2033
- Figure 32: Middle East and Africa Aerospace and Defense NDT Industry Revenue (Million), by Type 2025 & 2033
- Figure 33: Middle East and Africa Aerospace and Defense NDT Industry Revenue Share (%), by Type 2025 & 2033
- Figure 34: Middle East and Africa Aerospace and Defense NDT Industry Revenue (Million), by Technology 2025 & 2033
- Figure 35: Middle East and Africa Aerospace and Defense NDT Industry Revenue Share (%), by Technology 2025 & 2033
- Figure 36: Middle East and Africa Aerospace and Defense NDT Industry Revenue (Million), by Country 2025 & 2033
- Figure 37: Middle East and Africa Aerospace and Defense NDT Industry Revenue Share (%), by Country 2025 & 2033
List of Tables
- Table 1: Global Aerospace and Defense NDT Industry Revenue Million Forecast, by Type 2020 & 2033
- Table 2: Global Aerospace and Defense NDT Industry Revenue Million Forecast, by Technology 2020 & 2033
- Table 3: Global Aerospace and Defense NDT Industry Revenue Million Forecast, by Region 2020 & 2033
- Table 4: Global Aerospace and Defense NDT Industry Revenue Million Forecast, by Type 2020 & 2033
- Table 5: Global Aerospace and Defense NDT Industry Revenue Million Forecast, by Technology 2020 & 2033
- Table 6: Global Aerospace and Defense NDT Industry Revenue Million Forecast, by Country 2020 & 2033
- Table 7: Global Aerospace and Defense NDT Industry Revenue Million Forecast, by Type 2020 & 2033
- Table 8: Global Aerospace and Defense NDT Industry Revenue Million Forecast, by Technology 2020 & 2033
- Table 9: Global Aerospace and Defense NDT Industry Revenue Million Forecast, by Country 2020 & 2033
- Table 10: Global Aerospace and Defense NDT Industry Revenue Million Forecast, by Type 2020 & 2033
- Table 11: Global Aerospace and Defense NDT Industry Revenue Million Forecast, by Technology 2020 & 2033
- Table 12: Global Aerospace and Defense NDT Industry Revenue Million Forecast, by Country 2020 & 2033
- Table 13: Global Aerospace and Defense NDT Industry Revenue Million Forecast, by Type 2020 & 2033
- Table 14: Global Aerospace and Defense NDT Industry Revenue Million Forecast, by Technology 2020 & 2033
- Table 15: Global Aerospace and Defense NDT Industry Revenue Million Forecast, by Country 2020 & 2033
- Table 16: Global Aerospace and Defense NDT Industry Revenue Million Forecast, by Type 2020 & 2033
- Table 17: Global Aerospace and Defense NDT Industry Revenue Million Forecast, by Technology 2020 & 2033
- Table 18: Global Aerospace and Defense NDT Industry Revenue Million Forecast, by Country 2020 & 2033
- Table 19: Global Aerospace and Defense NDT Industry Revenue Million Forecast, by Type 2020 & 2033
- Table 20: Global Aerospace and Defense NDT Industry Revenue Million Forecast, by Technology 2020 & 2033
- Table 21: Global Aerospace and Defense NDT Industry Revenue Million Forecast, by Country 2020 & 2033
Frequently Asked Questions
1. What is the projected Compound Annual Growth Rate (CAGR) of the Aerospace and Defense NDT Industry?
The projected CAGR is approximately 15.74%.
2. Which companies are prominent players in the Aerospace and Defense NDT Industry?
Key companies in the market include Fujifilm NDT Systems, Intertek Group PLC, Magnaflux Corporation, Yxlon International GmbH, Team Inc, SGS Group, TUV Rheinland Ag, NikonMetrology Inc, Mistras Group, Olympus Corporation, GE Measurement and Control, Applus Services S A, FLIR Systems Inc *List Not Exhaustive, Gould-Bass Co.
3. What are the main segments of the Aerospace and Defense NDT Industry?
The market segments include Type, Technology.
4. Can you provide details about the market size?
The market size is estimated to be USD 9.11 Million as of 2022.
5. What are some drivers contributing to market growth?
Increasing Investments in Aerospace & Defense; Increasing Complexity of Machine and Infrastructure.
6. What are the notable trends driving market growth?
Radiography Testing Technology to Account for the Largest Share.
7. Are there any restraints impacting market growth?
Lack Of Technical Workforce; Relative Lack of Awareness.
8. Can you provide examples of recent developments in the market?
March 2024 – Eddyfi Technologies, a player in the global non-destructive testing (NDT) solutions market, unveils TubePro 6, its advanced pre-inspection and reporting software. TubePro 6 is equipping organizations with advanced tools. These features promise unmatched insights and operational efficiency, particularly in heat exchanger inspections.
9. What pricing options are available for accessing the report?
Pricing options include single-user, multi-user, and enterprise licenses priced at USD 4750, USD 5250, and USD 8750 respectively.
10. Is the market size provided in terms of value or volume?
The market size is provided in terms of value, measured in Million.
11. Are there any specific market keywords associated with the report?
Yes, the market keyword associated with the report is "Aerospace and Defense NDT Industry," which aids in identifying and referencing the specific market segment covered.
12. How do I determine which pricing option suits my needs best?
The pricing options vary based on user requirements and access needs. Individual users may opt for single-user licenses, while businesses requiring broader access may choose multi-user or enterprise licenses for cost-effective access to the report.
13. Are there any additional resources or data provided in the Aerospace and Defense NDT Industry report?
While the report offers comprehensive insights, it's advisable to review the specific contents or supplementary materials provided to ascertain if additional resources or data are available.
14. How can I stay updated on further developments or reports in the Aerospace and Defense NDT Industry?
To stay informed about further developments, trends, and reports in the Aerospace and Defense NDT Industry, consider subscribing to industry newsletters, following relevant companies and organizations, or regularly checking reputable industry news sources and publications.
Methodology
Step 1 - Identification of Relevant Samples Size from Population Database


Step 2 - Approaches for Defining Global Market Size (Value, Volume* & Price*)

Note*: In applicable scenarios
Step 3 - Data Sources
Primary Research
- Web Analytics
- Survey Reports
- Research Institute
- Latest Research Reports
- Opinion Leaders
Secondary Research
- Annual Reports
- White Paper
- Latest Press Release
- Industry Association
- Paid Database
- Investor Presentations

Step 4 - Data Triangulation
Involves using different sources of information in order to increase the validity of a study
These sources are likely to be stakeholders in a program - participants, other researchers, program staff, other community members, and so on.
Then we put all data in single framework & apply various statistical tools to find out the dynamic on the market.
During the analysis stage, feedback from the stakeholder groups would be compared to determine areas of agreement as well as areas of divergence