

Key Insights
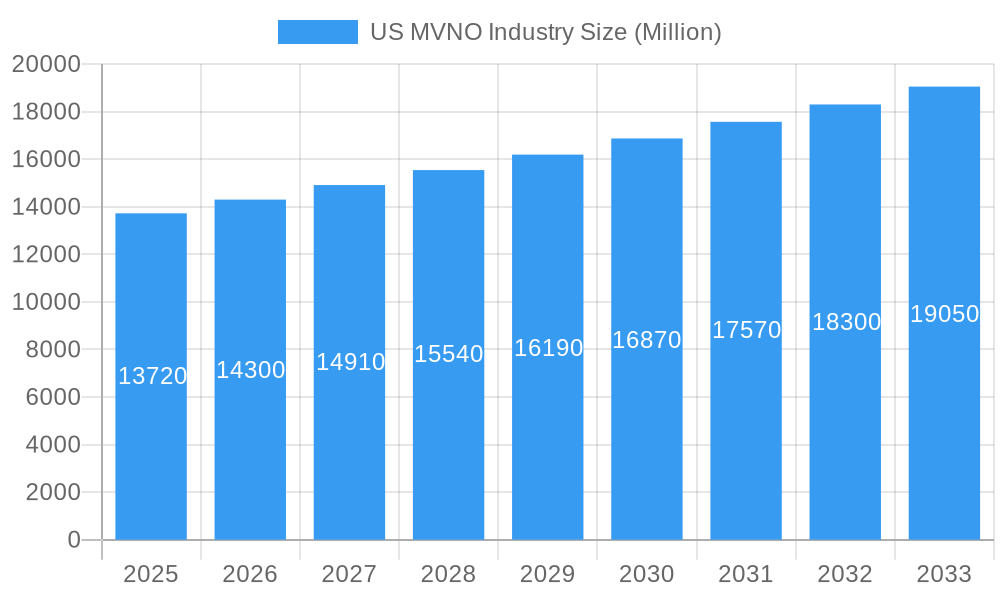
The US Mobile Virtual Network Operator (MVNO) market, valued at $13.72 billion in 2025, is projected to experience robust growth, driven by increasing demand for flexible and affordable mobile plans. A Compound Annual Growth Rate (CAGR) of 4.31% from 2025 to 2033 indicates a significant expansion in market size. This growth is fueled by several key factors. The rise of budget-conscious consumers seeking cost-effective alternatives to traditional carriers is a major driver. Furthermore, the increasing popularity of prepaid plans and the growing business segment seeking customized mobile solutions are contributing significantly to market expansion. The market is segmented by operating model (reseller, service operator, full MVNO, and others) and subscriber type (business and consumer), providing diverse revenue streams. Major players like Consumer Cellular, Cricket Wireless, Republic Wireless, and others, compete fiercely, innovating with unique offerings to attract and retain customers. Geographic variations exist across the US, with regions like the Northeast and West potentially showing higher adoption rates due to factors like population density and technological advancement. However, regulatory hurdles and competition from established carriers present challenges to sustained growth.
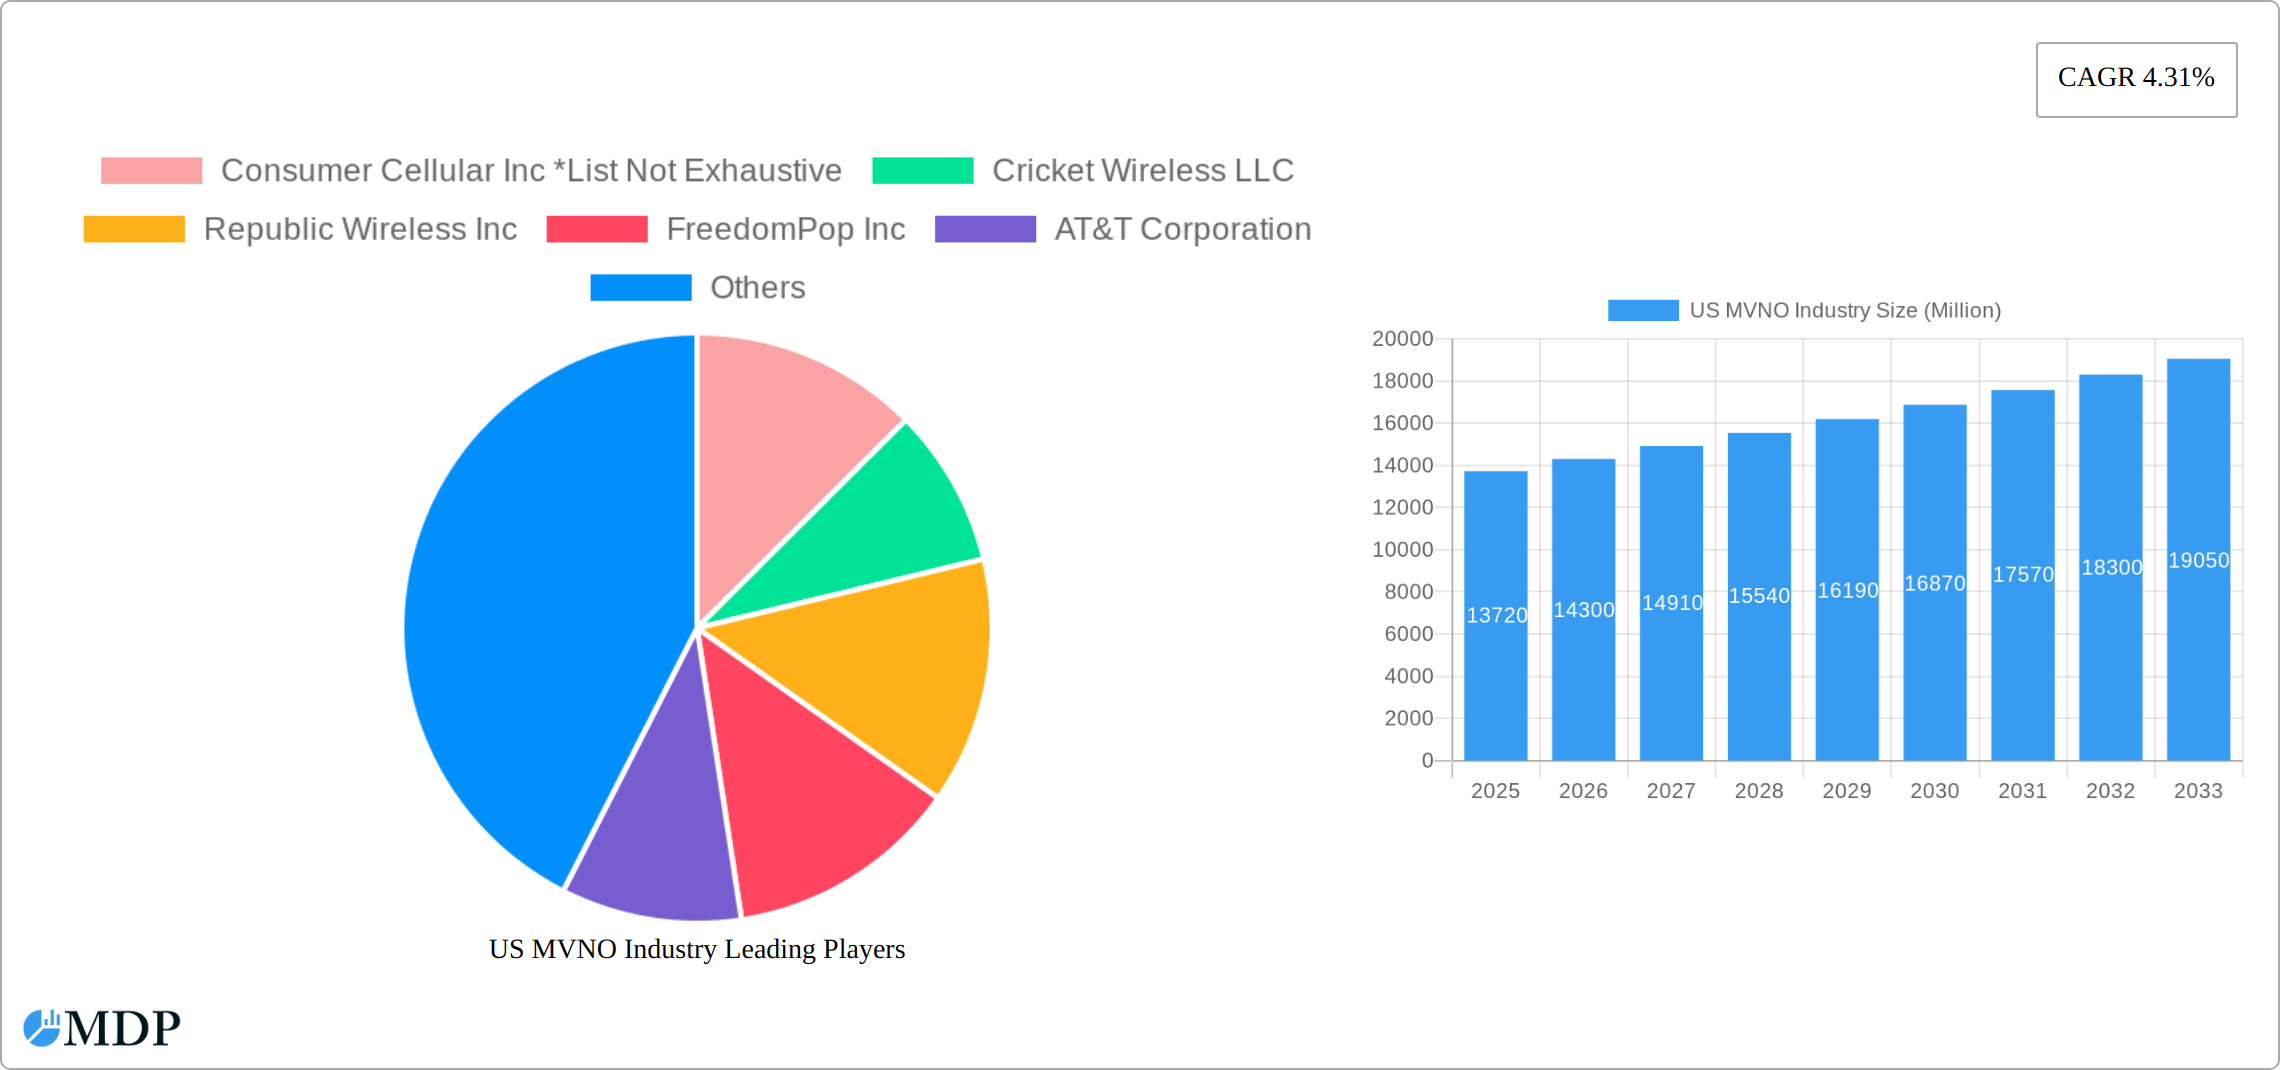
US MVNO Industry Market Size (In Billion)
The competitive landscape is dynamic, with established players like AT&T, Verizon, and T-Mobile offering MVNO services alongside independent operators. The success of MVNOs hinges on strategic partnerships, effective marketing, and the ability to provide superior customer service and tailored plans. Growth in the business segment is expected to be particularly strong, driven by the need for efficient and cost-effective communication solutions for businesses of all sizes. The continued development of 5G technology and the increasing adoption of IoT devices are also expected to positively influence market growth in the coming years. The market's long-term outlook remains positive, with significant growth opportunities for both established players and emerging market entrants. However, continuous adaptation to technological advancements and evolving consumer preferences will be critical for maintaining a competitive edge.
US MVNO Industry Company Market Share
US MVNO Industry Market Report: 2019-2033 Forecast
This comprehensive report provides an in-depth analysis of the US Mobile Virtual Network Operator (MVNO) industry, offering invaluable insights for stakeholders, investors, and industry professionals. With a study period spanning 2019-2033, a base year of 2025, and a forecast period of 2025-2033, this report utilizes rigorous data analysis to project market trends and growth opportunities. The US MVNO market, valued at $XX Million in 2024, is poised for significant expansion, reaching $XX Million by 2033, exhibiting a CAGR of XX%.
US MVNO Industry Market Dynamics & Concentration
The US MVNO market is a vibrant and evolving landscape, characterized by a dynamic interplay of factors that influence its concentration and overall growth trajectory. While market share is currently consolidated among a few prominent players – notably AT&T Corporation, Verizon Communications Inc, and T-Mobile USA INC, who command substantial market presence – a thriving ecosystem of smaller MVNOs continues to innovate and secure their own valuable niches. Companies such as Cricket Wireless LLC, Republic Wireless Inc, and Consumer Cellular Inc excel by delivering specialized services, catering to specific demographics, and employing highly targeted marketing strategies.
The market demonstrates a moderate level of concentration, with an estimated Herfindahl-Hirschman Index (HHI) hovering around XX. Key innovation drivers fueling this dynamic environment include the widespread adoption and advancement of 5G technology, a burgeoning consumer demand for flexible and customizable mobile plans, and the exponential growth of the Internet of Things (IoT) ecosystem. Regulatory frameworks, particularly those established by the FCC concerning spectrum allocation and robust consumer protection measures, significantly shape the competitive contours of the market. While product substitutes like Wi-Fi calling and VoIP services offer some degree of competitive pressure, the underlying trend of end-user preference for cost-effective, data-centric mobile plans continues to be a primary engine for MVNO service demand. Merger and acquisition (M&A) activity has remained relatively measured in recent years, with approximately XX notable deals recorded between 2019 and 2024, predominantly involving smaller entities seeking to consolidate their market positions and enhance their competitive standing.
US MVNO Industry Industry Trends & Analysis
The US MVNO industry is currently experiencing a period of robust and sustained growth. This expansion is underpinned by a confluence of significant drivers, including the ever-increasing penetration of smartphones across the nation and a consistent surge in demand for affordable, high-quality mobile services. Technological advancements, most notably the ongoing rollout and enhancement of 5G networks, are opening up unprecedented avenues for MVNOs to develop and deploy innovative, data-intensive plans and cutting-edge services. Consumer preferences are demonstrably shifting towards greater flexibility, with a strong inclination towards customizable plans and contract-free options – precisely the kind of offerings MVNOs are ideally positioned to deliver. Competitive dynamics are intensifying, as established players continually refine and broaden their service portfolios, while new, agile entrants are consistently emerging. The market is projected to witness a Compound Annual Growth Rate (CAGR) of XX% between 2025 and 2033, propelled by the aforementioned factors and an anticipated market penetration increase of approximately XX% over the forecast period. The relentless shift towards increased data consumption coupled with the persistent need for accessible and affordable connectivity serves as the fundamental impetus for this projected growth. The current market size in 2025 is estimated to be valued at approximately $XX Million.
Leading Markets & Segments in US MVNO Industry
The US MVNO market is geographically dispersed, with no single dominant region. However, densely populated areas with high smartphone penetration experience higher demand. By operating model, the Full MVNO segment holds the largest market share due to its flexibility in offering customized services and packages.
- Key Drivers for Full MVNO Dominance:
- Ability to tailor plans to specific customer segments.
- Greater control over branding and marketing strategies.
- Potential for higher profit margins compared to reseller models.
By subscriber type, the Consumer segment dominates the market, primarily driven by the affordability and flexibility offered by MVNOs. The business segment is also showing considerable growth potential, particularly for smaller enterprises seeking cost-effective mobile solutions.
- Key Drivers for Consumer Segment Dominance:
- Cost-effectiveness: MVNOs often offer cheaper plans than traditional carriers.
- Flexibility: MVNOs provide a range of plan options to cater to individual needs.
- Accessibility: MVNOs often expand to underserved areas.
US MVNO Industry Product Developments
Recent product innovations within the US MVNO sector are primarily centered around delivering enhanced data allowances, creating attractive bundled service packages that integrate entertainment streaming and other digital content, and refining customer service platforms to offer superior support. MVNOs are strategically leveraging advanced technologies, including artificial intelligence (AI) and machine learning, to craft more personalized and bespoke mobile plans. These technologies also empower MVNOs to provide proactive customer support, anticipate user needs, and deliver highly targeted promotional offers. The key to achieving a sustainable competitive advantage lies in consistently offering superior value propositions through meticulously designed cost-effective plans, complemented by a range of compelling value-added services that resonate with consumer needs.
Key Drivers of US MVNO Industry Growth
Several factors propel the growth of the US MVNO industry. Technological advancements, such as the rollout of 5G, provide opportunities for improved network coverage and higher data speeds. Economic factors, such as consumers' increasing need for affordable mobile connectivity, drive demand. Favorable regulatory policies encouraging competition in the telecommunications sector further support market expansion.
Challenges in the US MVNO Industry Market
The US MVNO industry faces several challenges. Regulatory hurdles and the complexities of negotiating wholesale agreements with network operators can significantly impact profitability. Supply chain issues impacting device availability and network infrastructure can disrupt service delivery. Intense competition from established mobile carriers and other MVNOs necessitates continuous innovation and efficient cost management. These factors collectively impact the industry's growth trajectory, resulting in potential slowdowns.
Emerging Opportunities in US MVNO Industry
The future landscape of the US MVNO industry is replete with promising opportunities for significant growth and expansion. Emerging technological breakthroughs, particularly in the rapidly developing fields of the Internet of Things (IoT) and edge computing, are poised to unlock entirely new revenue streams and service categories. Strategic alliances and partnerships with leading technology providers and innovative content creators can serve as powerful catalysts for delivering enhanced, differentiated value-added services to a broader customer base. Furthermore, there exists substantial growth potential in strategically expanding into underserved geographic markets and diligently exploring and catering to highly specialized, niche customer segments that may be overlooked by larger, more generalized providers.
Leading Players in the US MVNO Industry Sector
- Consumer Cellular Inc
- Cricket Wireless LLC
- Republic Wireless Inc
- FreedomPop Inc
- AT&T Corporation
- Xfinity Mobile (Comcast Corporation)
- Verizon Communications Inc
- DISH Network L L C (Boost Mobile LLC)
- TracFone Wireless Inc (Straight Talk)
- T-Mobile USA INC
Key Milestones in US MVNO Industry Industry
- 2020: Increased adoption of 5G capable devices by several MVNOs.
- 2021: Several MVNOs launched unlimited data plans to compete with traditional operators.
- 2022: Significant increase in M&A activity within the MVNO sector, particularly among smaller players.
- 2023: Introduction of innovative bundled services combining mobile data with streaming platforms by a handful of major MVNOs.
- 2024: Further expansion of MVNOs into rural markets with targeted plans.
Strategic Outlook for US MVNO Industry Market
The US MVNO market presents a compelling investment opportunity. Sustained growth is expected due to rising smartphone penetration and demand for affordable mobile connectivity. Strategic opportunities lie in developing innovative service offerings, optimizing operational efficiency, and leveraging technological advancements. By focusing on customer-centric approaches, MVNOs can secure a strong market position and contribute to the continued expansion of the US mobile market.
US MVNO Industry Segmentation
-
1. Operating Model
- 1.1. Reseller
- 1.2. Service Operator
- 1.3. Full MVNO
- 1.4. Other Operational Models
-
2. Subscriber
- 2.1. Business
- 2.2. Consumer
US MVNO Industry Segmentation By Geography
-
1. North America
- 1.1. United States
- 1.2. Canada
- 1.3. Mexico
-
2. South America
- 2.1. Brazil
- 2.2. Argentina
- 2.3. Rest of South America
-
3. Europe
- 3.1. United Kingdom
- 3.2. Germany
- 3.3. France
- 3.4. Italy
- 3.5. Spain
- 3.6. Russia
- 3.7. Benelux
- 3.8. Nordics
- 3.9. Rest of Europe
-
4. Middle East & Africa
- 4.1. Turkey
- 4.2. Israel
- 4.3. GCC
- 4.4. North Africa
- 4.5. South Africa
- 4.6. Rest of Middle East & Africa
-
5. Asia Pacific
- 5.1. China
- 5.2. India
- 5.3. Japan
- 5.4. South Korea
- 5.5. ASEAN
- 5.6. Oceania
- 5.7. Rest of Asia Pacific
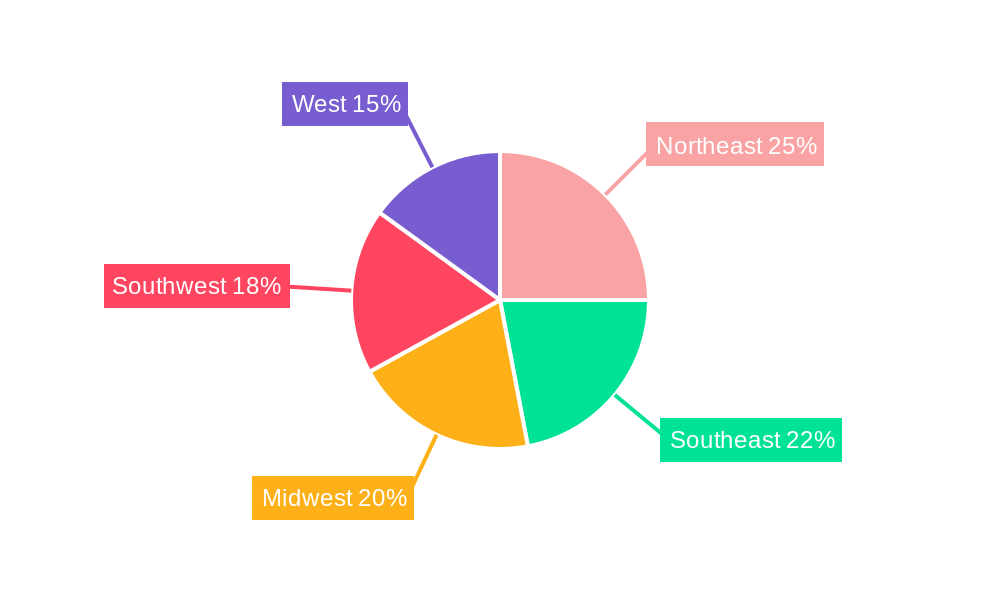
US MVNO Industry Regional Market Share
Geographic Coverage of US MVNO Industry
US MVNO Industry REPORT HIGHLIGHTS
| Aspects | Details |
|---|---|
| Study Period | 2020-2034 |
| Base Year | 2025 |
| Estimated Year | 2026 |
| Forecast Period | 2026-2034 |
| Historical Period | 2020-2025 |
| Growth Rate | CAGR of 4.31% from 2020-2034 |
| Segmentation |
|
Table of Contents
- 1. Introduction
- 1.1. Research Scope
- 1.2. Market Segmentation
- 1.3. Research Methodology
- 1.4. Definitions and Assumptions
- 2. Executive Summary
- 2.1. Introduction
- 3. Market Dynamics
- 3.1. Introduction
- 3.2. Market Drivers
- 3.2.1. ; Increasing Mobile Network Subscribers and the Growing Penetration Of Data Users; Rising Demand For Efficient Cellular Networks
- 3.3. Market Restrains
- 3.3.1. High Implementation Costs
- 3.4. Market Trends
- 3.4.1. Rising Demand for Efficient Cellular Network is Expected to Drive the Market
- 4. Market Factor Analysis
- 4.1. Porters Five Forces
- 4.2. Supply/Value Chain
- 4.3. PESTEL analysis
- 4.4. Market Entropy
- 4.5. Patent/Trademark Analysis
- 5. Global US MVNO Industry Analysis, Insights and Forecast, 2020-2032
- 5.1. Market Analysis, Insights and Forecast - by Operating Model
- 5.1.1. Reseller
- 5.1.2. Service Operator
- 5.1.3. Full MVNO
- 5.1.4. Other Operational Models
- 5.2. Market Analysis, Insights and Forecast - by Subscriber
- 5.2.1. Business
- 5.2.2. Consumer
- 5.3. Market Analysis, Insights and Forecast - by Region
- 5.3.1. North America
- 5.3.2. South America
- 5.3.3. Europe
- 5.3.4. Middle East & Africa
- 5.3.5. Asia Pacific
- 5.1. Market Analysis, Insights and Forecast - by Operating Model
- 6. North America US MVNO Industry Analysis, Insights and Forecast, 2020-2032
- 6.1. Market Analysis, Insights and Forecast - by Operating Model
- 6.1.1. Reseller
- 6.1.2. Service Operator
- 6.1.3. Full MVNO
- 6.1.4. Other Operational Models
- 6.2. Market Analysis, Insights and Forecast - by Subscriber
- 6.2.1. Business
- 6.2.2. Consumer
- 6.1. Market Analysis, Insights and Forecast - by Operating Model
- 7. South America US MVNO Industry Analysis, Insights and Forecast, 2020-2032
- 7.1. Market Analysis, Insights and Forecast - by Operating Model
- 7.1.1. Reseller
- 7.1.2. Service Operator
- 7.1.3. Full MVNO
- 7.1.4. Other Operational Models
- 7.2. Market Analysis, Insights and Forecast - by Subscriber
- 7.2.1. Business
- 7.2.2. Consumer
- 7.1. Market Analysis, Insights and Forecast - by Operating Model
- 8. Europe US MVNO Industry Analysis, Insights and Forecast, 2020-2032
- 8.1. Market Analysis, Insights and Forecast - by Operating Model
- 8.1.1. Reseller
- 8.1.2. Service Operator
- 8.1.3. Full MVNO
- 8.1.4. Other Operational Models
- 8.2. Market Analysis, Insights and Forecast - by Subscriber
- 8.2.1. Business
- 8.2.2. Consumer
- 8.1. Market Analysis, Insights and Forecast - by Operating Model
- 9. Middle East & Africa US MVNO Industry Analysis, Insights and Forecast, 2020-2032
- 9.1. Market Analysis, Insights and Forecast - by Operating Model
- 9.1.1. Reseller
- 9.1.2. Service Operator
- 9.1.3. Full MVNO
- 9.1.4. Other Operational Models
- 9.2. Market Analysis, Insights and Forecast - by Subscriber
- 9.2.1. Business
- 9.2.2. Consumer
- 9.1. Market Analysis, Insights and Forecast - by Operating Model
- 10. Asia Pacific US MVNO Industry Analysis, Insights and Forecast, 2020-2032
- 10.1. Market Analysis, Insights and Forecast - by Operating Model
- 10.1.1. Reseller
- 10.1.2. Service Operator
- 10.1.3. Full MVNO
- 10.1.4. Other Operational Models
- 10.2. Market Analysis, Insights and Forecast - by Subscriber
- 10.2.1. Business
- 10.2.2. Consumer
- 10.1. Market Analysis, Insights and Forecast - by Operating Model
- 11. Competitive Analysis
- 11.1. Global Market Share Analysis 2025
- 11.2. Company Profiles
- 11.2.1 Consumer Cellular Inc *List Not Exhaustive
- 11.2.1.1. Overview
- 11.2.1.2. Products
- 11.2.1.3. SWOT Analysis
- 11.2.1.4. Recent Developments
- 11.2.1.5. Financials (Based on Availability)
- 11.2.2 Cricket Wireless LLC
- 11.2.2.1. Overview
- 11.2.2.2. Products
- 11.2.2.3. SWOT Analysis
- 11.2.2.4. Recent Developments
- 11.2.2.5. Financials (Based on Availability)
- 11.2.3 Republic Wireless Inc
- 11.2.3.1. Overview
- 11.2.3.2. Products
- 11.2.3.3. SWOT Analysis
- 11.2.3.4. Recent Developments
- 11.2.3.5. Financials (Based on Availability)
- 11.2.4 FreedomPop Inc
- 11.2.4.1. Overview
- 11.2.4.2. Products
- 11.2.4.3. SWOT Analysis
- 11.2.4.4. Recent Developments
- 11.2.4.5. Financials (Based on Availability)
- 11.2.5 AT&T Corporation
- 11.2.5.1. Overview
- 11.2.5.2. Products
- 11.2.5.3. SWOT Analysis
- 11.2.5.4. Recent Developments
- 11.2.5.5. Financials (Based on Availability)
- 11.2.6 Xfinity Mobile (Comcast Corporation)
- 11.2.6.1. Overview
- 11.2.6.2. Products
- 11.2.6.3. SWOT Analysis
- 11.2.6.4. Recent Developments
- 11.2.6.5. Financials (Based on Availability)
- 11.2.7 Verizon Communications Inc
- 11.2.7.1. Overview
- 11.2.7.2. Products
- 11.2.7.3. SWOT Analysis
- 11.2.7.4. Recent Developments
- 11.2.7.5. Financials (Based on Availability)
- 11.2.8 DISH Network L L C (Boost Mobile LLC)
- 11.2.8.1. Overview
- 11.2.8.2. Products
- 11.2.8.3. SWOT Analysis
- 11.2.8.4. Recent Developments
- 11.2.8.5. Financials (Based on Availability)
- 11.2.9 TracFone Wireless Inc (Straight Talk)
- 11.2.9.1. Overview
- 11.2.9.2. Products
- 11.2.9.3. SWOT Analysis
- 11.2.9.4. Recent Developments
- 11.2.9.5. Financials (Based on Availability)
- 11.2.10 T-Mobile USA INC
- 11.2.10.1. Overview
- 11.2.10.2. Products
- 11.2.10.3. SWOT Analysis
- 11.2.10.4. Recent Developments
- 11.2.10.5. Financials (Based on Availability)
- 11.2.1 Consumer Cellular Inc *List Not Exhaustive
List of Figures
- Figure 1: Global US MVNO Industry Revenue Breakdown (Million, %) by Region 2025 & 2033
- Figure 2: North America US MVNO Industry Revenue (Million), by Operating Model 2025 & 2033
- Figure 3: North America US MVNO Industry Revenue Share (%), by Operating Model 2025 & 2033
- Figure 4: North America US MVNO Industry Revenue (Million), by Subscriber 2025 & 2033
- Figure 5: North America US MVNO Industry Revenue Share (%), by Subscriber 2025 & 2033
- Figure 6: North America US MVNO Industry Revenue (Million), by Country 2025 & 2033
- Figure 7: North America US MVNO Industry Revenue Share (%), by Country 2025 & 2033
- Figure 8: South America US MVNO Industry Revenue (Million), by Operating Model 2025 & 2033
- Figure 9: South America US MVNO Industry Revenue Share (%), by Operating Model 2025 & 2033
- Figure 10: South America US MVNO Industry Revenue (Million), by Subscriber 2025 & 2033
- Figure 11: South America US MVNO Industry Revenue Share (%), by Subscriber 2025 & 2033
- Figure 12: South America US MVNO Industry Revenue (Million), by Country 2025 & 2033
- Figure 13: South America US MVNO Industry Revenue Share (%), by Country 2025 & 2033
- Figure 14: Europe US MVNO Industry Revenue (Million), by Operating Model 2025 & 2033
- Figure 15: Europe US MVNO Industry Revenue Share (%), by Operating Model 2025 & 2033
- Figure 16: Europe US MVNO Industry Revenue (Million), by Subscriber 2025 & 2033
- Figure 17: Europe US MVNO Industry Revenue Share (%), by Subscriber 2025 & 2033
- Figure 18: Europe US MVNO Industry Revenue (Million), by Country 2025 & 2033
- Figure 19: Europe US MVNO Industry Revenue Share (%), by Country 2025 & 2033
- Figure 20: Middle East & Africa US MVNO Industry Revenue (Million), by Operating Model 2025 & 2033
- Figure 21: Middle East & Africa US MVNO Industry Revenue Share (%), by Operating Model 2025 & 2033
- Figure 22: Middle East & Africa US MVNO Industry Revenue (Million), by Subscriber 2025 & 2033
- Figure 23: Middle East & Africa US MVNO Industry Revenue Share (%), by Subscriber 2025 & 2033
- Figure 24: Middle East & Africa US MVNO Industry Revenue (Million), by Country 2025 & 2033
- Figure 25: Middle East & Africa US MVNO Industry Revenue Share (%), by Country 2025 & 2033
- Figure 26: Asia Pacific US MVNO Industry Revenue (Million), by Operating Model 2025 & 2033
- Figure 27: Asia Pacific US MVNO Industry Revenue Share (%), by Operating Model 2025 & 2033
- Figure 28: Asia Pacific US MVNO Industry Revenue (Million), by Subscriber 2025 & 2033
- Figure 29: Asia Pacific US MVNO Industry Revenue Share (%), by Subscriber 2025 & 2033
- Figure 30: Asia Pacific US MVNO Industry Revenue (Million), by Country 2025 & 2033
- Figure 31: Asia Pacific US MVNO Industry Revenue Share (%), by Country 2025 & 2033
List of Tables
- Table 1: Global US MVNO Industry Revenue Million Forecast, by Operating Model 2020 & 2033
- Table 2: Global US MVNO Industry Revenue Million Forecast, by Subscriber 2020 & 2033
- Table 3: Global US MVNO Industry Revenue Million Forecast, by Region 2020 & 2033
- Table 4: Global US MVNO Industry Revenue Million Forecast, by Operating Model 2020 & 2033
- Table 5: Global US MVNO Industry Revenue Million Forecast, by Subscriber 2020 & 2033
- Table 6: Global US MVNO Industry Revenue Million Forecast, by Country 2020 & 2033
- Table 7: United States US MVNO Industry Revenue (Million) Forecast, by Application 2020 & 2033
- Table 8: Canada US MVNO Industry Revenue (Million) Forecast, by Application 2020 & 2033
- Table 9: Mexico US MVNO Industry Revenue (Million) Forecast, by Application 2020 & 2033
- Table 10: Global US MVNO Industry Revenue Million Forecast, by Operating Model 2020 & 2033
- Table 11: Global US MVNO Industry Revenue Million Forecast, by Subscriber 2020 & 2033
- Table 12: Global US MVNO Industry Revenue Million Forecast, by Country 2020 & 2033
- Table 13: Brazil US MVNO Industry Revenue (Million) Forecast, by Application 2020 & 2033
- Table 14: Argentina US MVNO Industry Revenue (Million) Forecast, by Application 2020 & 2033
- Table 15: Rest of South America US MVNO Industry Revenue (Million) Forecast, by Application 2020 & 2033
- Table 16: Global US MVNO Industry Revenue Million Forecast, by Operating Model 2020 & 2033
- Table 17: Global US MVNO Industry Revenue Million Forecast, by Subscriber 2020 & 2033
- Table 18: Global US MVNO Industry Revenue Million Forecast, by Country 2020 & 2033
- Table 19: United Kingdom US MVNO Industry Revenue (Million) Forecast, by Application 2020 & 2033
- Table 20: Germany US MVNO Industry Revenue (Million) Forecast, by Application 2020 & 2033
- Table 21: France US MVNO Industry Revenue (Million) Forecast, by Application 2020 & 2033
- Table 22: Italy US MVNO Industry Revenue (Million) Forecast, by Application 2020 & 2033
- Table 23: Spain US MVNO Industry Revenue (Million) Forecast, by Application 2020 & 2033
- Table 24: Russia US MVNO Industry Revenue (Million) Forecast, by Application 2020 & 2033
- Table 25: Benelux US MVNO Industry Revenue (Million) Forecast, by Application 2020 & 2033
- Table 26: Nordics US MVNO Industry Revenue (Million) Forecast, by Application 2020 & 2033
- Table 27: Rest of Europe US MVNO Industry Revenue (Million) Forecast, by Application 2020 & 2033
- Table 28: Global US MVNO Industry Revenue Million Forecast, by Operating Model 2020 & 2033
- Table 29: Global US MVNO Industry Revenue Million Forecast, by Subscriber 2020 & 2033
- Table 30: Global US MVNO Industry Revenue Million Forecast, by Country 2020 & 2033
- Table 31: Turkey US MVNO Industry Revenue (Million) Forecast, by Application 2020 & 2033
- Table 32: Israel US MVNO Industry Revenue (Million) Forecast, by Application 2020 & 2033
- Table 33: GCC US MVNO Industry Revenue (Million) Forecast, by Application 2020 & 2033
- Table 34: North Africa US MVNO Industry Revenue (Million) Forecast, by Application 2020 & 2033
- Table 35: South Africa US MVNO Industry Revenue (Million) Forecast, by Application 2020 & 2033
- Table 36: Rest of Middle East & Africa US MVNO Industry Revenue (Million) Forecast, by Application 2020 & 2033
- Table 37: Global US MVNO Industry Revenue Million Forecast, by Operating Model 2020 & 2033
- Table 38: Global US MVNO Industry Revenue Million Forecast, by Subscriber 2020 & 2033
- Table 39: Global US MVNO Industry Revenue Million Forecast, by Country 2020 & 2033
- Table 40: China US MVNO Industry Revenue (Million) Forecast, by Application 2020 & 2033
- Table 41: India US MVNO Industry Revenue (Million) Forecast, by Application 2020 & 2033
- Table 42: Japan US MVNO Industry Revenue (Million) Forecast, by Application 2020 & 2033
- Table 43: South Korea US MVNO Industry Revenue (Million) Forecast, by Application 2020 & 2033
- Table 44: ASEAN US MVNO Industry Revenue (Million) Forecast, by Application 2020 & 2033
- Table 45: Oceania US MVNO Industry Revenue (Million) Forecast, by Application 2020 & 2033
- Table 46: Rest of Asia Pacific US MVNO Industry Revenue (Million) Forecast, by Application 2020 & 2033
Frequently Asked Questions
1. What is the projected Compound Annual Growth Rate (CAGR) of the US MVNO Industry?
The projected CAGR is approximately 4.31%.
2. Which companies are prominent players in the US MVNO Industry?
Key companies in the market include Consumer Cellular Inc *List Not Exhaustive, Cricket Wireless LLC, Republic Wireless Inc, FreedomPop Inc, AT&T Corporation, Xfinity Mobile (Comcast Corporation), Verizon Communications Inc, DISH Network L L C (Boost Mobile LLC), TracFone Wireless Inc (Straight Talk), T-Mobile USA INC.
3. What are the main segments of the US MVNO Industry?
The market segments include Operating Model, Subscriber.
4. Can you provide details about the market size?
The market size is estimated to be USD 13.72 Million as of 2022.
5. What are some drivers contributing to market growth?
; Increasing Mobile Network Subscribers and the Growing Penetration Of Data Users; Rising Demand For Efficient Cellular Networks.
6. What are the notable trends driving market growth?
Rising Demand for Efficient Cellular Network is Expected to Drive the Market.
7. Are there any restraints impacting market growth?
High Implementation Costs.
8. Can you provide examples of recent developments in the market?
N/A
9. What pricing options are available for accessing the report?
Pricing options include single-user, multi-user, and enterprise licenses priced at USD 3800, USD 4500, and USD 5800 respectively.
10. Is the market size provided in terms of value or volume?
The market size is provided in terms of value, measured in Million.
11. Are there any specific market keywords associated with the report?
Yes, the market keyword associated with the report is "US MVNO Industry," which aids in identifying and referencing the specific market segment covered.
12. How do I determine which pricing option suits my needs best?
The pricing options vary based on user requirements and access needs. Individual users may opt for single-user licenses, while businesses requiring broader access may choose multi-user or enterprise licenses for cost-effective access to the report.
13. Are there any additional resources or data provided in the US MVNO Industry report?
While the report offers comprehensive insights, it's advisable to review the specific contents or supplementary materials provided to ascertain if additional resources or data are available.
14. How can I stay updated on further developments or reports in the US MVNO Industry?
To stay informed about further developments, trends, and reports in the US MVNO Industry, consider subscribing to industry newsletters, following relevant companies and organizations, or regularly checking reputable industry news sources and publications.
Methodology
Step 1 - Identification of Relevant Samples Size from Population Database


Step 2 - Approaches for Defining Global Market Size (Value, Volume* & Price*)

Note*: In applicable scenarios
Step 3 - Data Sources
Primary Research
- Web Analytics
- Survey Reports
- Research Institute
- Latest Research Reports
- Opinion Leaders
Secondary Research
- Annual Reports
- White Paper
- Latest Press Release
- Industry Association
- Paid Database
- Investor Presentations

Step 4 - Data Triangulation
Involves using different sources of information in order to increase the validity of a study
These sources are likely to be stakeholders in a program - participants, other researchers, program staff, other community members, and so on.
Then we put all data in single framework & apply various statistical tools to find out the dynamic on the market.
During the analysis stage, feedback from the stakeholder groups would be compared to determine areas of agreement as well as areas of divergence