

Key Insights
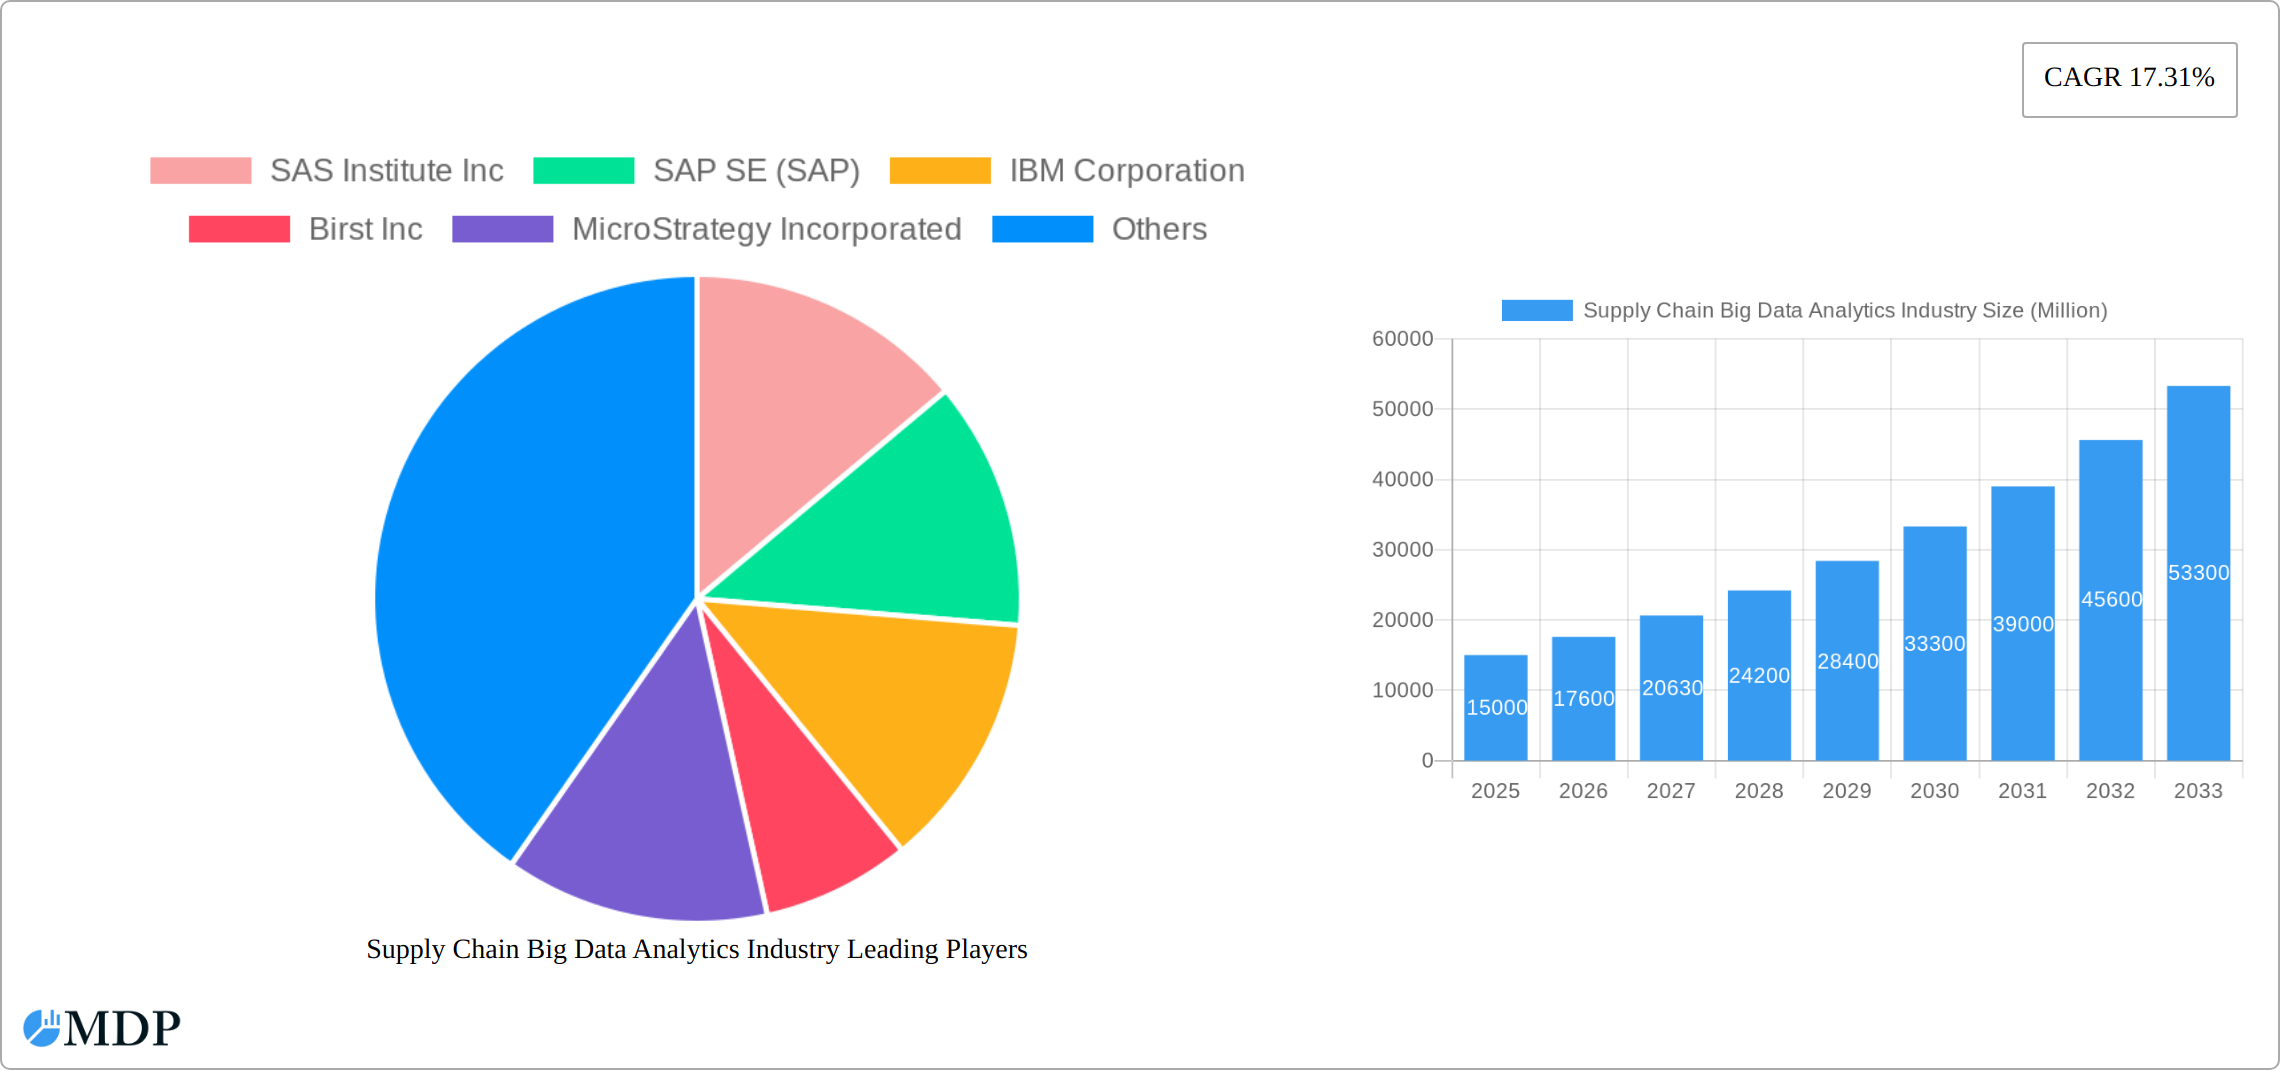
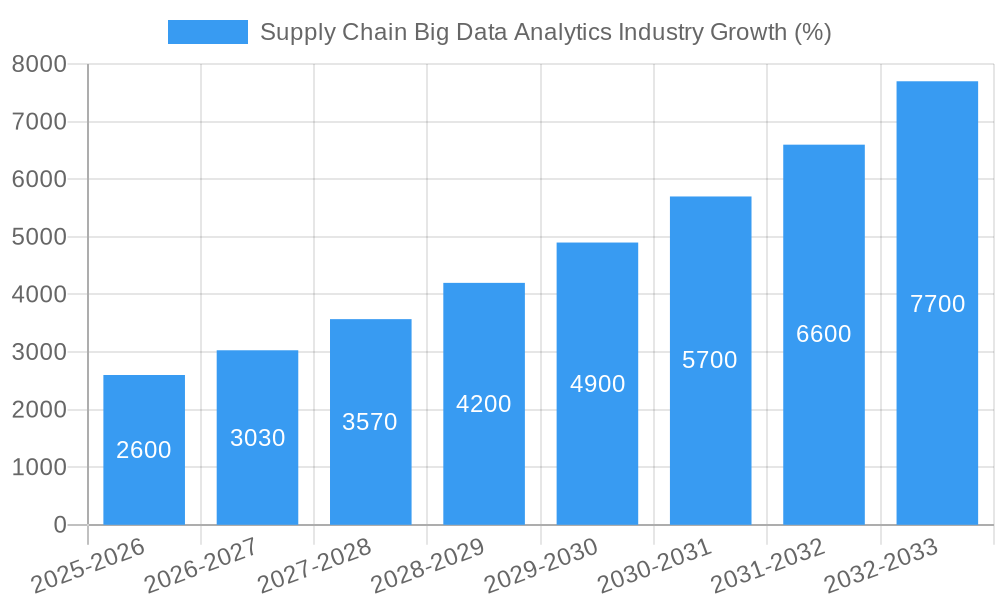
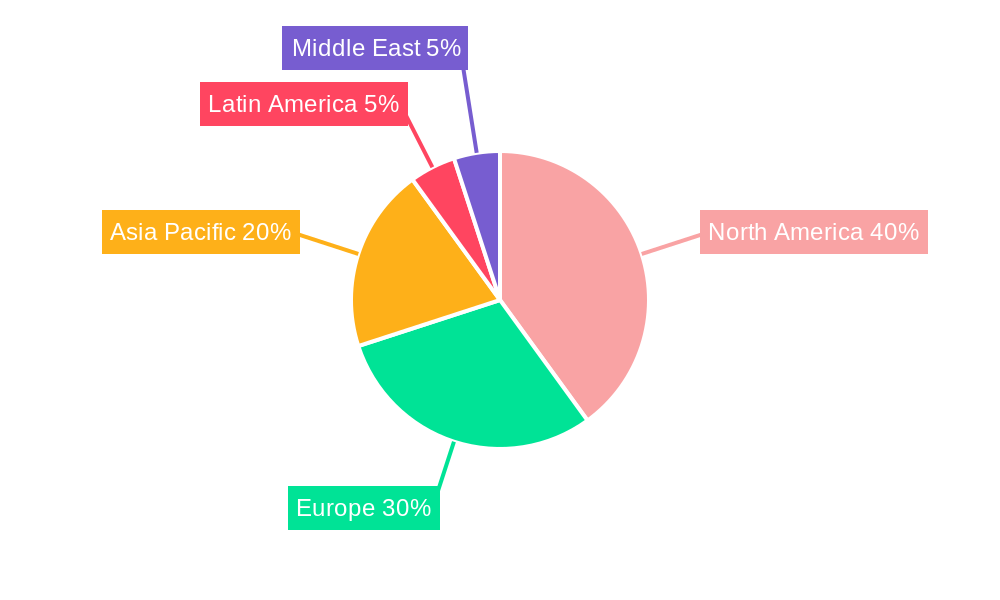
The Supply Chain Big Data Analytics market is experiencing robust growth, projected to reach a substantial size over the coming years. A Compound Annual Growth Rate (CAGR) of 17.31% from 2019 to 2024 indicates a significant market expansion driven by several factors. The increasing volume and complexity of supply chain data, coupled with the need for improved efficiency and real-time visibility, are key drivers. Businesses are increasingly leveraging big data analytics to optimize inventory management, enhance forecasting accuracy, improve logistics and transportation, and gain a competitive edge in a globalized market. The adoption of advanced analytics solutions, including predictive modeling and machine learning, further accelerates market growth. While challenges such as data integration complexities and the need for skilled professionals exist, the overall market trajectory remains positive. Segmentation reveals strong demand across various end-user industries, notably retail, transportation and logistics, manufacturing, and healthcare. The solution segment encompassing inventory planning and optimization, analytics, and scheduling and reporting tools contributes significantly to market revenue. North America currently holds a significant market share, followed by Europe and Asia Pacific, with emerging markets in Latin America and the Middle East showing promising growth potential. Leading players like SAS Institute, SAP, IBM, and Salesforce (Tableau) are driving innovation and shaping market dynamics through continuous product development and strategic partnerships.
The forecast period (2025-2033) anticipates sustained growth fueled by ongoing digital transformation within supply chains. Businesses are increasingly adopting cloud-based solutions for enhanced scalability and accessibility. The integration of IoT (Internet of Things) devices and the rise of AI-powered analytics are poised to further revolutionize supply chain management. The focus will shift towards advanced analytics capabilities capable of handling massive datasets and delivering actionable insights for proactive decision-making. The competitive landscape will remain dynamic, with both established players and emerging technology companies vying for market share. Continued investment in research and development, strategic acquisitions, and partnerships will shape the future of the Supply Chain Big Data Analytics market.
Supply Chain Big Data Analytics Industry Market Report: 2019-2033
This comprehensive report provides a detailed analysis of the Supply Chain Big Data Analytics industry, offering invaluable insights for stakeholders, investors, and industry professionals. With a study period spanning 2019-2033, a base year of 2025, and a forecast period of 2025-2033, this report leverages extensive market research to deliver actionable intelligence on market dynamics, trends, leading players, and future opportunities. The global market size is projected to reach $XX Million by 2033, exhibiting a CAGR of XX% during the forecast period.
Supply Chain Big Data Analytics Industry Market Dynamics & Concentration
The Supply Chain Big Data Analytics market exhibits a moderately concentrated landscape, dominated by several key players commanding substantial market share. This dynamic market is propelled by the escalating demand for enhanced supply chain visibility, operational efficiency, and resilience in the face of global uncertainties. The increasing stringency of regulatory frameworks, particularly those addressing data privacy and security (e.g., GDPR, CCPA), significantly shapes market practices and necessitates robust compliance strategies. This regulatory pressure fosters innovation in secure data handling and analytics. The continuous emergence of sophisticated analytics tools, fueled by advancements in Artificial Intelligence (AI) and Machine Learning (ML), drives innovation, offering more predictive and prescriptive capabilities. While substitute technologies exist, they haven't yet posed a significant threat to the prevalence of big data analytics solutions in the supply chain sector. End-user preferences consistently favor cloud-based, scalable solutions that offer seamless integration with existing Enterprise Resource Planning (ERP) and Supply Chain Management (SCM) systems. The frequency of mergers and acquisitions (M&A) activities reflects ongoing industry consolidation, strategic expansion efforts, and the pursuit of broader product portfolios and wider market reach. In 2024, the market witnessed approximately XX M&A deals, with an average deal size of $XX Million. Key players such as SAS Institute Inc. and SAP SE hold significant market share, estimated at approximately XX% and XX% respectively, while other established players like IBM and Oracle maintain a substantial presence. The competitive landscape is further defined by the rise of agile, specialized startups offering niche solutions.
Supply Chain Big Data Analytics Industry Industry Trends & Analysis
The Supply Chain Big Data Analytics market is experiencing robust growth, driven by several key factors. The increasing adoption of digital technologies across supply chains fuels the need for advanced analytics solutions. Businesses are leveraging big data to gain real-time insights into their operations, improve forecasting accuracy, optimize inventory management, and enhance customer service. The rising prevalence of e-commerce and the resulting complexity in supply chains are further propelling market growth. Technological disruptions, such as the rise of artificial intelligence (AI), machine learning (ML), and the Internet of Things (IoT), are revolutionizing supply chain management and creating new opportunities for big data analytics providers. Consumer preferences are shifting toward personalized experiences, increased transparency, and faster delivery times. This demands more sophisticated supply chain management, further strengthening the market for big data analytics. The competitive landscape is dynamic, with existing players focusing on strategic partnerships and acquisitions to expand their market presence and technological capabilities. The market is expected to exhibit a CAGR of XX% from 2025 to 2033, reaching an estimated value of $XX Million by 2033. Market penetration remains relatively high in developed economies, exceeding XX%, but substantial growth potential exists in developing markets.
Leading Markets & Segments in Supply Chain Big Data Analytics Industry
The North American region currently dominates the Supply Chain Big Data Analytics market, driven by high technological adoption, robust infrastructure, and a mature business environment. However, Asia-Pacific is exhibiting rapid growth, fueled by increasing manufacturing activity and e-commerce expansion.
- Key Drivers for North America: Advanced technological infrastructure, strong regulatory framework, high investment in supply chain optimization, early adoption of big data solutions.
- Key Drivers for Asia-Pacific: Rapid growth in manufacturing and e-commerce, rising government initiatives promoting digital transformation, increasing availability of affordable technological solutions.
Within segments, the Retail and Transportation & Logistics sectors demonstrate the highest demand for Supply Chain Big Data Analytics solutions due to their reliance on efficient and agile operations. The Manufacturing sector also represents a significant market segment, with companies utilizing analytics to optimize production processes and improve supply chain efficiency. The "Solution" type segment holds a larger market share compared to the "Service" segment, reflecting the increasing preference for readily available, integrated software solutions. The "Other End Users" segment shows consistent growth potential, indicating the wider applicability of these solutions beyond core industries.
Supply Chain Big Data Analytics Industry Product Developments
Recent product innovations are characterized by a strong focus on integrating advanced analytics with robust cloud-based platforms. This integration delivers scalable and flexible solutions capable of adapting to evolving business needs. These cutting-edge solutions leverage AI and ML to provide predictive insights, automate complex decision-making processes, and optimize diverse supply chain functions, including inventory management, demand forecasting, risk mitigation, and transportation optimization. Competitive differentiation is increasingly driven by the ability to provide accurate and timely insights, robust and secure data integration capabilities, intuitive user-friendly interfaces, and the capacity to adapt to specific industry needs. A notable trend is the development of specialized solutions finely tuned to address the unique operational challenges and data requirements of specific industries (e.g., healthcare, retail, manufacturing).
Key Drivers of Supply Chain Big Data Analytics Industry Growth
Several factors contribute to the growth of the Supply Chain Big Data Analytics industry. Technological advancements, including AI, ML, and IoT, enable real-time visibility and predictive analytics. The increasing need for efficient and resilient supply chains, coupled with the rise of e-commerce, fuels demand for advanced analytics. Government initiatives promoting digital transformation and investments in infrastructure further contribute to market growth.
Challenges in the Supply Chain Big Data Analytics Industry Market
The industry faces several significant challenges, including persistent concerns regarding data security and privacy, the inherent complexity of integrating data from disparate and often siloed sources, and the substantial upfront investment costs associated with implementation and ongoing maintenance. The shortage of skilled professionals proficient in managing and interpreting large, complex datasets remains a major hurdle. The competitive landscape, marked by the presence of both established industry giants and disruptive emerging startups, fosters intense competition. Data breaches and regulatory non-compliance can lead to significant financial losses and severe reputational damage, with average costs estimated at $XX Million per incident. Furthermore, ensuring data quality and accuracy across diverse data sources presents an ongoing operational challenge.
Emerging Opportunities in Supply Chain Big Data Analytics Industry
Significant growth potential lies in several key areas: the integration of blockchain technology to enhance traceability, transparency, and security throughout the supply chain; the development of increasingly sophisticated predictive modeling techniques leveraging AI and ML; and strategic expansion into high-growth emerging markets. Strategic partnerships between technology providers and supply chain operators are fostering innovation and creating new opportunities for the development and deployment of cutting-edge solutions. The rising adoption of cloud-based solutions, combined with the integration of advanced analytics capabilities within existing ERP and SCM systems, will serve as a significant driver of market expansion. The increasing focus on sustainability and ethical sourcing is also creating new opportunities for data-driven solutions that can optimize resource management and reduce environmental impact.
Leading Players in the Supply Chain Big Data Analytics Industry Sector
- SAS Institute Inc
- SAP SE (SAP)
- IBM Corporation
- Birst Inc
- MicroStrategy Incorporated
- Salesforce com Inc (Tableau Software Inc)
- Capgemini Group
- Sage Clarity Systems
- Oracle Corporation
- Kinaxis Inc
- Genpact Limited
Key Milestones in Supply Chain Big Data Analytics Industry Industry
- September 2022: Accenture's acquisition of MacGregor Partner expands its supply chain network and capabilities, particularly in smart logistics and warehouse management, significantly boosting its market share and strengthening its position in the market.
- November 2022: The collaboration between o9 Solutions and Genpact highlights the growing trend of AI-powered supply chain optimization, demonstrating the potential for automated and streamlined operations in large-scale deployments and showcasing the value of strategic partnerships.
- November 2022: Microsoft's launch of the Microsoft Supply Chain System underscores the increasing focus on open, scalable, and AI-driven platforms for supply chain data management, emphasizing the importance of interoperability and data accessibility.
Strategic Outlook for Supply Chain Big Data Analytics Industry Market
The Supply Chain Big Data Analytics market is poised for continued strong growth, driven by technological innovation and the increasing need for efficient and resilient supply chains. The focus on AI, machine learning, and cloud-based solutions will continue to shape the market landscape. Strategic partnerships and acquisitions will remain key strategies for market expansion. The long-term potential lies in developing solutions that address the evolving needs of various industries, incorporating advanced analytical capabilities, and enhancing security and data privacy measures.
Supply Chain Big Data Analytics Industry Segmentation
-
1. Type
-
1.1. Solution
- 1.1.1. Supply Chain Procurement and Planning Tool
- 1.1.2. Sales and Operations Planning
- 1.1.3. Manufacturing Analytics
- 1.1.4. Transportation and Logistics Analytics
- 1.1.5. Other So
-
1.2. Service
- 1.2.1. Professional Service
- 1.2.2. Support and Maintenance Service
-
1.1. Solution
-
2. End User
- 2.1. Retail
- 2.2. Transportation and Logistics
- 2.3. Manufacturing
- 2.4. Healthcare
- 2.5. Other End Users
Supply Chain Big Data Analytics Industry Segmentation By Geography
-
1. North America
- 1.1. United States
- 1.2. Canada
-
2. Europe
- 2.1. United Kingdom
- 2.2. Germany
- 2.3. France
- 2.4. Italy
- 2.5. Rest of Europe
-
3. Asia Pacific
- 3.1. China
- 3.2. Japan
- 3.3. South Korea
- 3.4. India
- 3.5. Rest of Asia Pacific
-
4. Latin America
- 4.1. Mexico
- 4.2. Brazil
- 4.3. Argentina
- 4.4. Rest of Latin America
- 5. Middle East
-
6. United Arab Emirates
- 6.1. Saudi Arabia
- 6.2. South Africa
- 6.3. Rest of Middle East
Supply Chain Big Data Analytics Industry REPORT HIGHLIGHTS
| Aspects | Details |
|---|---|
| Study Period | 2019-2033 |
| Base Year | 2024 |
| Estimated Year | 2025 |
| Forecast Period | 2025-2033 |
| Historical Period | 2019-2024 |
| Growth Rate | CAGR of 17.31% from 2019-2033 |
| Segmentation |
|
Table of Contents
- 1. Introduction
- 1.1. Research Scope
- 1.2. Market Segmentation
- 1.3. Research Methodology
- 1.4. Definitions and Assumptions
- 2. Executive Summary
- 2.1. Introduction
- 3. Market Dynamics
- 3.1. Introduction
- 3.2. Market Drivers
- 3.2.1. Increasing Need of Business Data to Improve Efficiency
- 3.3. Market Restrains
- 3.3.1. Operational Complexity Coupled with High Maintenance Costs
- 3.4. Market Trends
- 3.4.1. Retail is Expected to Register a Significant Growth
- 4. Market Factor Analysis
- 4.1. Porters Five Forces
- 4.2. Supply/Value Chain
- 4.3. PESTEL analysis
- 4.4. Market Entropy
- 4.5. Patent/Trademark Analysis
- 5. Global Supply Chain Big Data Analytics Industry Analysis, Insights and Forecast, 2019-2031
- 5.1. Market Analysis, Insights and Forecast - by Type
- 5.1.1. Solution
- 5.1.1.1. Supply Chain Procurement and Planning Tool
- 5.1.1.2. Sales and Operations Planning
- 5.1.1.3. Manufacturing Analytics
- 5.1.1.4. Transportation and Logistics Analytics
- 5.1.1.5. Other So
- 5.1.2. Service
- 5.1.2.1. Professional Service
- 5.1.2.2. Support and Maintenance Service
- 5.1.1. Solution
- 5.2. Market Analysis, Insights and Forecast - by End User
- 5.2.1. Retail
- 5.2.2. Transportation and Logistics
- 5.2.3. Manufacturing
- 5.2.4. Healthcare
- 5.2.5. Other End Users
- 5.3. Market Analysis, Insights and Forecast - by Region
- 5.3.1. North America
- 5.3.2. Europe
- 5.3.3. Asia Pacific
- 5.3.4. Latin America
- 5.3.5. Middle East
- 5.3.6. United Arab Emirates
- 5.1. Market Analysis, Insights and Forecast - by Type
- 6. North America Supply Chain Big Data Analytics Industry Analysis, Insights and Forecast, 2019-2031
- 6.1. Market Analysis, Insights and Forecast - by Type
- 6.1.1. Solution
- 6.1.1.1. Supply Chain Procurement and Planning Tool
- 6.1.1.2. Sales and Operations Planning
- 6.1.1.3. Manufacturing Analytics
- 6.1.1.4. Transportation and Logistics Analytics
- 6.1.1.5. Other So
- 6.1.2. Service
- 6.1.2.1. Professional Service
- 6.1.2.2. Support and Maintenance Service
- 6.1.1. Solution
- 6.2. Market Analysis, Insights and Forecast - by End User
- 6.2.1. Retail
- 6.2.2. Transportation and Logistics
- 6.2.3. Manufacturing
- 6.2.4. Healthcare
- 6.2.5. Other End Users
- 6.1. Market Analysis, Insights and Forecast - by Type
- 7. Europe Supply Chain Big Data Analytics Industry Analysis, Insights and Forecast, 2019-2031
- 7.1. Market Analysis, Insights and Forecast - by Type
- 7.1.1. Solution
- 7.1.1.1. Supply Chain Procurement and Planning Tool
- 7.1.1.2. Sales and Operations Planning
- 7.1.1.3. Manufacturing Analytics
- 7.1.1.4. Transportation and Logistics Analytics
- 7.1.1.5. Other So
- 7.1.2. Service
- 7.1.2.1. Professional Service
- 7.1.2.2. Support and Maintenance Service
- 7.1.1. Solution
- 7.2. Market Analysis, Insights and Forecast - by End User
- 7.2.1. Retail
- 7.2.2. Transportation and Logistics
- 7.2.3. Manufacturing
- 7.2.4. Healthcare
- 7.2.5. Other End Users
- 7.1. Market Analysis, Insights and Forecast - by Type
- 8. Asia Pacific Supply Chain Big Data Analytics Industry Analysis, Insights and Forecast, 2019-2031
- 8.1. Market Analysis, Insights and Forecast - by Type
- 8.1.1. Solution
- 8.1.1.1. Supply Chain Procurement and Planning Tool
- 8.1.1.2. Sales and Operations Planning
- 8.1.1.3. Manufacturing Analytics
- 8.1.1.4. Transportation and Logistics Analytics
- 8.1.1.5. Other So
- 8.1.2. Service
- 8.1.2.1. Professional Service
- 8.1.2.2. Support and Maintenance Service
- 8.1.1. Solution
- 8.2. Market Analysis, Insights and Forecast - by End User
- 8.2.1. Retail
- 8.2.2. Transportation and Logistics
- 8.2.3. Manufacturing
- 8.2.4. Healthcare
- 8.2.5. Other End Users
- 8.1. Market Analysis, Insights and Forecast - by Type
- 9. Latin America Supply Chain Big Data Analytics Industry Analysis, Insights and Forecast, 2019-2031
- 9.1. Market Analysis, Insights and Forecast - by Type
- 9.1.1. Solution
- 9.1.1.1. Supply Chain Procurement and Planning Tool
- 9.1.1.2. Sales and Operations Planning
- 9.1.1.3. Manufacturing Analytics
- 9.1.1.4. Transportation and Logistics Analytics
- 9.1.1.5. Other So
- 9.1.2. Service
- 9.1.2.1. Professional Service
- 9.1.2.2. Support and Maintenance Service
- 9.1.1. Solution
- 9.2. Market Analysis, Insights and Forecast - by End User
- 9.2.1. Retail
- 9.2.2. Transportation and Logistics
- 9.2.3. Manufacturing
- 9.2.4. Healthcare
- 9.2.5. Other End Users
- 9.1. Market Analysis, Insights and Forecast - by Type
- 10. Middle East Supply Chain Big Data Analytics Industry Analysis, Insights and Forecast, 2019-2031
- 10.1. Market Analysis, Insights and Forecast - by Type
- 10.1.1. Solution
- 10.1.1.1. Supply Chain Procurement and Planning Tool
- 10.1.1.2. Sales and Operations Planning
- 10.1.1.3. Manufacturing Analytics
- 10.1.1.4. Transportation and Logistics Analytics
- 10.1.1.5. Other So
- 10.1.2. Service
- 10.1.2.1. Professional Service
- 10.1.2.2. Support and Maintenance Service
- 10.1.1. Solution
- 10.2. Market Analysis, Insights and Forecast - by End User
- 10.2.1. Retail
- 10.2.2. Transportation and Logistics
- 10.2.3. Manufacturing
- 10.2.4. Healthcare
- 10.2.5. Other End Users
- 10.1. Market Analysis, Insights and Forecast - by Type
- 11. United Arab Emirates Supply Chain Big Data Analytics Industry Analysis, Insights and Forecast, 2019-2031
- 11.1. Market Analysis, Insights and Forecast - by Type
- 11.1.1. Solution
- 11.1.1.1. Supply Chain Procurement and Planning Tool
- 11.1.1.2. Sales and Operations Planning
- 11.1.1.3. Manufacturing Analytics
- 11.1.1.4. Transportation and Logistics Analytics
- 11.1.1.5. Other So
- 11.1.2. Service
- 11.1.2.1. Professional Service
- 11.1.2.2. Support and Maintenance Service
- 11.1.1. Solution
- 11.2. Market Analysis, Insights and Forecast - by End User
- 11.2.1. Retail
- 11.2.2. Transportation and Logistics
- 11.2.3. Manufacturing
- 11.2.4. Healthcare
- 11.2.5. Other End Users
- 11.1. Market Analysis, Insights and Forecast - by Type
- 12. North America Supply Chain Big Data Analytics Industry Analysis, Insights and Forecast, 2019-2031
- 12.1. Market Analysis, Insights and Forecast - By Country/Sub-region
- 12.1.1 United States
- 12.1.2 Canada
- 13. Europe Supply Chain Big Data Analytics Industry Analysis, Insights and Forecast, 2019-2031
- 13.1. Market Analysis, Insights and Forecast - By Country/Sub-region
- 13.1.1 United Kingdom
- 13.1.2 Germany
- 13.1.3 France
- 13.1.4 Italy
- 13.1.5 Rest of Europe
- 14. Asia Pacific Supply Chain Big Data Analytics Industry Analysis, Insights and Forecast, 2019-2031
- 14.1. Market Analysis, Insights and Forecast - By Country/Sub-region
- 14.1.1 China
- 14.1.2 Japan
- 14.1.3 South Korea
- 14.1.4 India
- 14.1.5 Rest of Asia Pacific
- 15. Latin America Supply Chain Big Data Analytics Industry Analysis, Insights and Forecast, 2019-2031
- 15.1. Market Analysis, Insights and Forecast - By Country/Sub-region
- 15.1.1 Mexico
- 15.1.2 Brazil
- 15.1.3 Argentina
- 15.1.4 Rest of Latin America
- 16. Middle East Supply Chain Big Data Analytics Industry Analysis, Insights and Forecast, 2019-2031
- 16.1. Market Analysis, Insights and Forecast - By Country/Sub-region
- 16.1.1.
- 17. United Arab Emirates Supply Chain Big Data Analytics Industry Analysis, Insights and Forecast, 2019-2031
- 17.1. Market Analysis, Insights and Forecast - By Country/Sub-region
- 17.1.1 Saudi Arabia
- 17.1.2 South Africa
- 17.1.3 Rest of Middle East
- 18. Competitive Analysis
- 18.1. Global Market Share Analysis 2024
- 18.2. Company Profiles
- 18.2.1 SAS Institute Inc
- 18.2.1.1. Overview
- 18.2.1.2. Products
- 18.2.1.3. SWOT Analysis
- 18.2.1.4. Recent Developments
- 18.2.1.5. Financials (Based on Availability)
- 18.2.2 SAP SE (SAP)
- 18.2.2.1. Overview
- 18.2.2.2. Products
- 18.2.2.3. SWOT Analysis
- 18.2.2.4. Recent Developments
- 18.2.2.5. Financials (Based on Availability)
- 18.2.3 IBM Corporation
- 18.2.3.1. Overview
- 18.2.3.2. Products
- 18.2.3.3. SWOT Analysis
- 18.2.3.4. Recent Developments
- 18.2.3.5. Financials (Based on Availability)
- 18.2.4 Birst Inc
- 18.2.4.1. Overview
- 18.2.4.2. Products
- 18.2.4.3. SWOT Analysis
- 18.2.4.4. Recent Developments
- 18.2.4.5. Financials (Based on Availability)
- 18.2.5 MicroStrategy Incorporated
- 18.2.5.1. Overview
- 18.2.5.2. Products
- 18.2.5.3. SWOT Analysis
- 18.2.5.4. Recent Developments
- 18.2.5.5. Financials (Based on Availability)
- 18.2.6 Salesforce com Inc (Tableau Software Inc )
- 18.2.6.1. Overview
- 18.2.6.2. Products
- 18.2.6.3. SWOT Analysis
- 18.2.6.4. Recent Developments
- 18.2.6.5. Financials (Based on Availability)
- 18.2.7 Capgemini Group
- 18.2.7.1. Overview
- 18.2.7.2. Products
- 18.2.7.3. SWOT Analysis
- 18.2.7.4. Recent Developments
- 18.2.7.5. Financials (Based on Availability)
- 18.2.8 Sage Clarity Systems
- 18.2.8.1. Overview
- 18.2.8.2. Products
- 18.2.8.3. SWOT Analysis
- 18.2.8.4. Recent Developments
- 18.2.8.5. Financials (Based on Availability)
- 18.2.9 Oracle Corporation
- 18.2.9.1. Overview
- 18.2.9.2. Products
- 18.2.9.3. SWOT Analysis
- 18.2.9.4. Recent Developments
- 18.2.9.5. Financials (Based on Availability)
- 18.2.10 Kinaxis Inc *List Not Exhaustive
- 18.2.10.1. Overview
- 18.2.10.2. Products
- 18.2.10.3. SWOT Analysis
- 18.2.10.4. Recent Developments
- 18.2.10.5. Financials (Based on Availability)
- 18.2.11 Genpact Limited
- 18.2.11.1. Overview
- 18.2.11.2. Products
- 18.2.11.3. SWOT Analysis
- 18.2.11.4. Recent Developments
- 18.2.11.5. Financials (Based on Availability)
- 18.2.1 SAS Institute Inc
List of Figures
- Figure 1: Global Supply Chain Big Data Analytics Industry Revenue Breakdown (Million, %) by Region 2024 & 2032
- Figure 2: North America Supply Chain Big Data Analytics Industry Revenue (Million), by Country 2024 & 2032
- Figure 3: North America Supply Chain Big Data Analytics Industry Revenue Share (%), by Country 2024 & 2032
- Figure 4: Europe Supply Chain Big Data Analytics Industry Revenue (Million), by Country 2024 & 2032
- Figure 5: Europe Supply Chain Big Data Analytics Industry Revenue Share (%), by Country 2024 & 2032
- Figure 6: Asia Pacific Supply Chain Big Data Analytics Industry Revenue (Million), by Country 2024 & 2032
- Figure 7: Asia Pacific Supply Chain Big Data Analytics Industry Revenue Share (%), by Country 2024 & 2032
- Figure 8: Latin America Supply Chain Big Data Analytics Industry Revenue (Million), by Country 2024 & 2032
- Figure 9: Latin America Supply Chain Big Data Analytics Industry Revenue Share (%), by Country 2024 & 2032
- Figure 10: Middle East Supply Chain Big Data Analytics Industry Revenue (Million), by Country 2024 & 2032
- Figure 11: Middle East Supply Chain Big Data Analytics Industry Revenue Share (%), by Country 2024 & 2032
- Figure 12: United Arab Emirates Supply Chain Big Data Analytics Industry Revenue (Million), by Country 2024 & 2032
- Figure 13: United Arab Emirates Supply Chain Big Data Analytics Industry Revenue Share (%), by Country 2024 & 2032
- Figure 14: North America Supply Chain Big Data Analytics Industry Revenue (Million), by Type 2024 & 2032
- Figure 15: North America Supply Chain Big Data Analytics Industry Revenue Share (%), by Type 2024 & 2032
- Figure 16: North America Supply Chain Big Data Analytics Industry Revenue (Million), by End User 2024 & 2032
- Figure 17: North America Supply Chain Big Data Analytics Industry Revenue Share (%), by End User 2024 & 2032
- Figure 18: North America Supply Chain Big Data Analytics Industry Revenue (Million), by Country 2024 & 2032
- Figure 19: North America Supply Chain Big Data Analytics Industry Revenue Share (%), by Country 2024 & 2032
- Figure 20: Europe Supply Chain Big Data Analytics Industry Revenue (Million), by Type 2024 & 2032
- Figure 21: Europe Supply Chain Big Data Analytics Industry Revenue Share (%), by Type 2024 & 2032
- Figure 22: Europe Supply Chain Big Data Analytics Industry Revenue (Million), by End User 2024 & 2032
- Figure 23: Europe Supply Chain Big Data Analytics Industry Revenue Share (%), by End User 2024 & 2032
- Figure 24: Europe Supply Chain Big Data Analytics Industry Revenue (Million), by Country 2024 & 2032
- Figure 25: Europe Supply Chain Big Data Analytics Industry Revenue Share (%), by Country 2024 & 2032
- Figure 26: Asia Pacific Supply Chain Big Data Analytics Industry Revenue (Million), by Type 2024 & 2032
- Figure 27: Asia Pacific Supply Chain Big Data Analytics Industry Revenue Share (%), by Type 2024 & 2032
- Figure 28: Asia Pacific Supply Chain Big Data Analytics Industry Revenue (Million), by End User 2024 & 2032
- Figure 29: Asia Pacific Supply Chain Big Data Analytics Industry Revenue Share (%), by End User 2024 & 2032
- Figure 30: Asia Pacific Supply Chain Big Data Analytics Industry Revenue (Million), by Country 2024 & 2032
- Figure 31: Asia Pacific Supply Chain Big Data Analytics Industry Revenue Share (%), by Country 2024 & 2032
- Figure 32: Latin America Supply Chain Big Data Analytics Industry Revenue (Million), by Type 2024 & 2032
- Figure 33: Latin America Supply Chain Big Data Analytics Industry Revenue Share (%), by Type 2024 & 2032
- Figure 34: Latin America Supply Chain Big Data Analytics Industry Revenue (Million), by End User 2024 & 2032
- Figure 35: Latin America Supply Chain Big Data Analytics Industry Revenue Share (%), by End User 2024 & 2032
- Figure 36: Latin America Supply Chain Big Data Analytics Industry Revenue (Million), by Country 2024 & 2032
- Figure 37: Latin America Supply Chain Big Data Analytics Industry Revenue Share (%), by Country 2024 & 2032
- Figure 38: Middle East Supply Chain Big Data Analytics Industry Revenue (Million), by Type 2024 & 2032
- Figure 39: Middle East Supply Chain Big Data Analytics Industry Revenue Share (%), by Type 2024 & 2032
- Figure 40: Middle East Supply Chain Big Data Analytics Industry Revenue (Million), by End User 2024 & 2032
- Figure 41: Middle East Supply Chain Big Data Analytics Industry Revenue Share (%), by End User 2024 & 2032
- Figure 42: Middle East Supply Chain Big Data Analytics Industry Revenue (Million), by Country 2024 & 2032
- Figure 43: Middle East Supply Chain Big Data Analytics Industry Revenue Share (%), by Country 2024 & 2032
- Figure 44: United Arab Emirates Supply Chain Big Data Analytics Industry Revenue (Million), by Type 2024 & 2032
- Figure 45: United Arab Emirates Supply Chain Big Data Analytics Industry Revenue Share (%), by Type 2024 & 2032
- Figure 46: United Arab Emirates Supply Chain Big Data Analytics Industry Revenue (Million), by End User 2024 & 2032
- Figure 47: United Arab Emirates Supply Chain Big Data Analytics Industry Revenue Share (%), by End User 2024 & 2032
- Figure 48: United Arab Emirates Supply Chain Big Data Analytics Industry Revenue (Million), by Country 2024 & 2032
- Figure 49: United Arab Emirates Supply Chain Big Data Analytics Industry Revenue Share (%), by Country 2024 & 2032
List of Tables
- Table 1: Global Supply Chain Big Data Analytics Industry Revenue Million Forecast, by Region 2019 & 2032
- Table 2: Global Supply Chain Big Data Analytics Industry Revenue Million Forecast, by Type 2019 & 2032
- Table 3: Global Supply Chain Big Data Analytics Industry Revenue Million Forecast, by End User 2019 & 2032
- Table 4: Global Supply Chain Big Data Analytics Industry Revenue Million Forecast, by Region 2019 & 2032
- Table 5: Global Supply Chain Big Data Analytics Industry Revenue Million Forecast, by Country 2019 & 2032
- Table 6: United States Supply Chain Big Data Analytics Industry Revenue (Million) Forecast, by Application 2019 & 2032
- Table 7: Canada Supply Chain Big Data Analytics Industry Revenue (Million) Forecast, by Application 2019 & 2032
- Table 8: Global Supply Chain Big Data Analytics Industry Revenue Million Forecast, by Country 2019 & 2032
- Table 9: United Kingdom Supply Chain Big Data Analytics Industry Revenue (Million) Forecast, by Application 2019 & 2032
- Table 10: Germany Supply Chain Big Data Analytics Industry Revenue (Million) Forecast, by Application 2019 & 2032
- Table 11: France Supply Chain Big Data Analytics Industry Revenue (Million) Forecast, by Application 2019 & 2032
- Table 12: Italy Supply Chain Big Data Analytics Industry Revenue (Million) Forecast, by Application 2019 & 2032
- Table 13: Rest of Europe Supply Chain Big Data Analytics Industry Revenue (Million) Forecast, by Application 2019 & 2032
- Table 14: Global Supply Chain Big Data Analytics Industry Revenue Million Forecast, by Country 2019 & 2032
- Table 15: China Supply Chain Big Data Analytics Industry Revenue (Million) Forecast, by Application 2019 & 2032
- Table 16: Japan Supply Chain Big Data Analytics Industry Revenue (Million) Forecast, by Application 2019 & 2032
- Table 17: South Korea Supply Chain Big Data Analytics Industry Revenue (Million) Forecast, by Application 2019 & 2032
- Table 18: India Supply Chain Big Data Analytics Industry Revenue (Million) Forecast, by Application 2019 & 2032
- Table 19: Rest of Asia Pacific Supply Chain Big Data Analytics Industry Revenue (Million) Forecast, by Application 2019 & 2032
- Table 20: Global Supply Chain Big Data Analytics Industry Revenue Million Forecast, by Country 2019 & 2032
- Table 21: Mexico Supply Chain Big Data Analytics Industry Revenue (Million) Forecast, by Application 2019 & 2032
- Table 22: Brazil Supply Chain Big Data Analytics Industry Revenue (Million) Forecast, by Application 2019 & 2032
- Table 23: Argentina Supply Chain Big Data Analytics Industry Revenue (Million) Forecast, by Application 2019 & 2032
- Table 24: Rest of Latin America Supply Chain Big Data Analytics Industry Revenue (Million) Forecast, by Application 2019 & 2032
- Table 25: Global Supply Chain Big Data Analytics Industry Revenue Million Forecast, by Country 2019 & 2032
- Table 26: Supply Chain Big Data Analytics Industry Revenue (Million) Forecast, by Application 2019 & 2032
- Table 27: Global Supply Chain Big Data Analytics Industry Revenue Million Forecast, by Country 2019 & 2032
- Table 28: Saudi Arabia Supply Chain Big Data Analytics Industry Revenue (Million) Forecast, by Application 2019 & 2032
- Table 29: South Africa Supply Chain Big Data Analytics Industry Revenue (Million) Forecast, by Application 2019 & 2032
- Table 30: Rest of Middle East Supply Chain Big Data Analytics Industry Revenue (Million) Forecast, by Application 2019 & 2032
- Table 31: Global Supply Chain Big Data Analytics Industry Revenue Million Forecast, by Type 2019 & 2032
- Table 32: Global Supply Chain Big Data Analytics Industry Revenue Million Forecast, by End User 2019 & 2032
- Table 33: Global Supply Chain Big Data Analytics Industry Revenue Million Forecast, by Country 2019 & 2032
- Table 34: United States Supply Chain Big Data Analytics Industry Revenue (Million) Forecast, by Application 2019 & 2032
- Table 35: Canada Supply Chain Big Data Analytics Industry Revenue (Million) Forecast, by Application 2019 & 2032
- Table 36: Global Supply Chain Big Data Analytics Industry Revenue Million Forecast, by Type 2019 & 2032
- Table 37: Global Supply Chain Big Data Analytics Industry Revenue Million Forecast, by End User 2019 & 2032
- Table 38: Global Supply Chain Big Data Analytics Industry Revenue Million Forecast, by Country 2019 & 2032
- Table 39: United Kingdom Supply Chain Big Data Analytics Industry Revenue (Million) Forecast, by Application 2019 & 2032
- Table 40: Germany Supply Chain Big Data Analytics Industry Revenue (Million) Forecast, by Application 2019 & 2032
- Table 41: France Supply Chain Big Data Analytics Industry Revenue (Million) Forecast, by Application 2019 & 2032
- Table 42: Italy Supply Chain Big Data Analytics Industry Revenue (Million) Forecast, by Application 2019 & 2032
- Table 43: Rest of Europe Supply Chain Big Data Analytics Industry Revenue (Million) Forecast, by Application 2019 & 2032
- Table 44: Global Supply Chain Big Data Analytics Industry Revenue Million Forecast, by Type 2019 & 2032
- Table 45: Global Supply Chain Big Data Analytics Industry Revenue Million Forecast, by End User 2019 & 2032
- Table 46: Global Supply Chain Big Data Analytics Industry Revenue Million Forecast, by Country 2019 & 2032
- Table 47: China Supply Chain Big Data Analytics Industry Revenue (Million) Forecast, by Application 2019 & 2032
- Table 48: Japan Supply Chain Big Data Analytics Industry Revenue (Million) Forecast, by Application 2019 & 2032
- Table 49: South Korea Supply Chain Big Data Analytics Industry Revenue (Million) Forecast, by Application 2019 & 2032
- Table 50: India Supply Chain Big Data Analytics Industry Revenue (Million) Forecast, by Application 2019 & 2032
- Table 51: Rest of Asia Pacific Supply Chain Big Data Analytics Industry Revenue (Million) Forecast, by Application 2019 & 2032
- Table 52: Global Supply Chain Big Data Analytics Industry Revenue Million Forecast, by Type 2019 & 2032
- Table 53: Global Supply Chain Big Data Analytics Industry Revenue Million Forecast, by End User 2019 & 2032
- Table 54: Global Supply Chain Big Data Analytics Industry Revenue Million Forecast, by Country 2019 & 2032
- Table 55: Mexico Supply Chain Big Data Analytics Industry Revenue (Million) Forecast, by Application 2019 & 2032
- Table 56: Brazil Supply Chain Big Data Analytics Industry Revenue (Million) Forecast, by Application 2019 & 2032
- Table 57: Argentina Supply Chain Big Data Analytics Industry Revenue (Million) Forecast, by Application 2019 & 2032
- Table 58: Rest of Latin America Supply Chain Big Data Analytics Industry Revenue (Million) Forecast, by Application 2019 & 2032
- Table 59: Global Supply Chain Big Data Analytics Industry Revenue Million Forecast, by Type 2019 & 2032
- Table 60: Global Supply Chain Big Data Analytics Industry Revenue Million Forecast, by End User 2019 & 2032
- Table 61: Global Supply Chain Big Data Analytics Industry Revenue Million Forecast, by Country 2019 & 2032
- Table 62: Global Supply Chain Big Data Analytics Industry Revenue Million Forecast, by Type 2019 & 2032
- Table 63: Global Supply Chain Big Data Analytics Industry Revenue Million Forecast, by End User 2019 & 2032
- Table 64: Global Supply Chain Big Data Analytics Industry Revenue Million Forecast, by Country 2019 & 2032
- Table 65: Saudi Arabia Supply Chain Big Data Analytics Industry Revenue (Million) Forecast, by Application 2019 & 2032
- Table 66: South Africa Supply Chain Big Data Analytics Industry Revenue (Million) Forecast, by Application 2019 & 2032
- Table 67: Rest of Middle East Supply Chain Big Data Analytics Industry Revenue (Million) Forecast, by Application 2019 & 2032
Frequently Asked Questions
1. What is the projected Compound Annual Growth Rate (CAGR) of the Supply Chain Big Data Analytics Industry?
The projected CAGR is approximately 17.31%.
2. Which companies are prominent players in the Supply Chain Big Data Analytics Industry?
Key companies in the market include SAS Institute Inc, SAP SE (SAP), IBM Corporation, Birst Inc, MicroStrategy Incorporated, Salesforce com Inc (Tableau Software Inc ), Capgemini Group, Sage Clarity Systems, Oracle Corporation, Kinaxis Inc *List Not Exhaustive, Genpact Limited.
3. What are the main segments of the Supply Chain Big Data Analytics Industry?
The market segments include Type, End User.
4. Can you provide details about the market size?
The market size is estimated to be USD XX Million as of 2022.
5. What are some drivers contributing to market growth?
Increasing Need of Business Data to Improve Efficiency.
6. What are the notable trends driving market growth?
Retail is Expected to Register a Significant Growth.
7. Are there any restraints impacting market growth?
Operational Complexity Coupled with High Maintenance Costs.
8. Can you provide examples of recent developments in the market?
September 2022: Accenture announced the acquisition of MacGregor Partner, a prominent supply chain consultant and technology supplier specializing in smart logistics and warehouse administration. It is an intelligent logistics and warehouse management company, as well as a supply chain consultant and technology supplier. Accenture's supply chain network, powered by Blue Yonder technology, has grown due to the acquisition.
9. What pricing options are available for accessing the report?
Pricing options include single-user, multi-user, and enterprise licenses priced at USD 4750, USD 5250, and USD 8750 respectively.
10. Is the market size provided in terms of value or volume?
The market size is provided in terms of value, measured in Million.
11. Are there any specific market keywords associated with the report?
Yes, the market keyword associated with the report is "Supply Chain Big Data Analytics Industry," which aids in identifying and referencing the specific market segment covered.
12. How do I determine which pricing option suits my needs best?
The pricing options vary based on user requirements and access needs. Individual users may opt for single-user licenses, while businesses requiring broader access may choose multi-user or enterprise licenses for cost-effective access to the report.
13. Are there any additional resources or data provided in the Supply Chain Big Data Analytics Industry report?
While the report offers comprehensive insights, it's advisable to review the specific contents or supplementary materials provided to ascertain if additional resources or data are available.
14. How can I stay updated on further developments or reports in the Supply Chain Big Data Analytics Industry?
To stay informed about further developments, trends, and reports in the Supply Chain Big Data Analytics Industry, consider subscribing to industry newsletters, following relevant companies and organizations, or regularly checking reputable industry news sources and publications.
Methodology
Step 1 - Identification of Relevant Samples Size from Population Database


Step 2 - Approaches for Defining Global Market Size (Value, Volume* & Price*)

Note*: In applicable scenarios
Step 3 - Data Sources
Primary Research
- Web Analytics
- Survey Reports
- Research Institute
- Latest Research Reports
- Opinion Leaders
Secondary Research
- Annual Reports
- White Paper
- Latest Press Release
- Industry Association
- Paid Database
- Investor Presentations

Step 4 - Data Triangulation
Involves using different sources of information in order to increase the validity of a study
These sources are likely to be stakeholders in a program - participants, other researchers, program staff, other community members, and so on.
Then we put all data in single framework & apply various statistical tools to find out the dynamic on the market.
During the analysis stage, feedback from the stakeholder groups would be compared to determine areas of agreement as well as areas of divergence
