

Key Insights
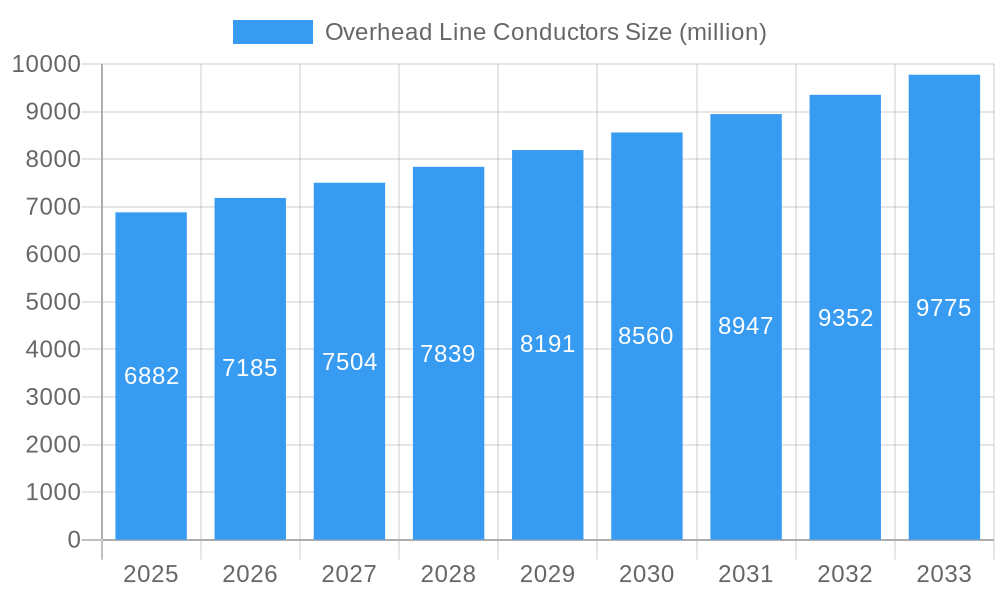
The global overhead line conductors market, valued at $6.882 billion in 2025, is projected to experience steady growth, driven by the expanding electricity transmission and distribution infrastructure globally. The compound annual growth rate (CAGR) of 4.2% from 2025 to 2033 indicates a significant market expansion, primarily fueled by increasing urbanization, rising energy demand, and the growing adoption of renewable energy sources like solar and wind power, requiring extensive transmission networks. Key market segments include various voltage classes (low, medium, high, extra-high, and ultra-high pressure) and conductor types (ACSR, AAAC, ACAR, AACSR, AAC, and others). The high-pressure and extra-high-pressure segments are anticipated to witness faster growth due to the increasing need for long-distance power transmission. Furthermore, the shift towards more efficient and durable conductor materials, like those with improved ampacity and corrosion resistance, is driving innovation and market expansion. Competitive landscape analysis reveals key players such as Southwire, Prysmian, Nexans, and Hengtong Group, constantly innovating to cater to evolving market demands. Geographic expansion, particularly in developing economies with burgeoning energy infrastructure projects, presents significant growth opportunities.
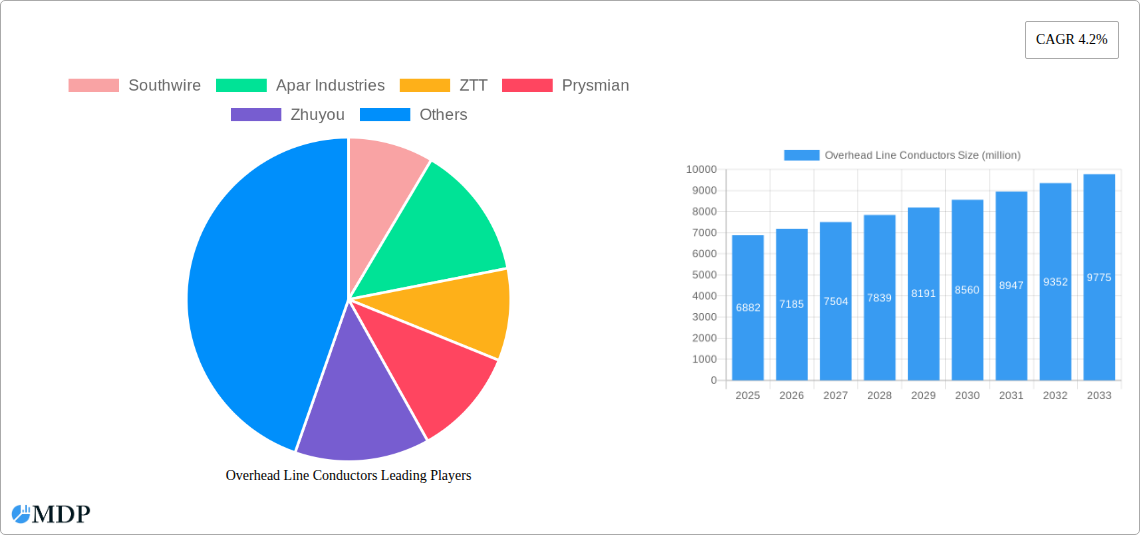
Overhead Line Conductors Market Size (In Billion)
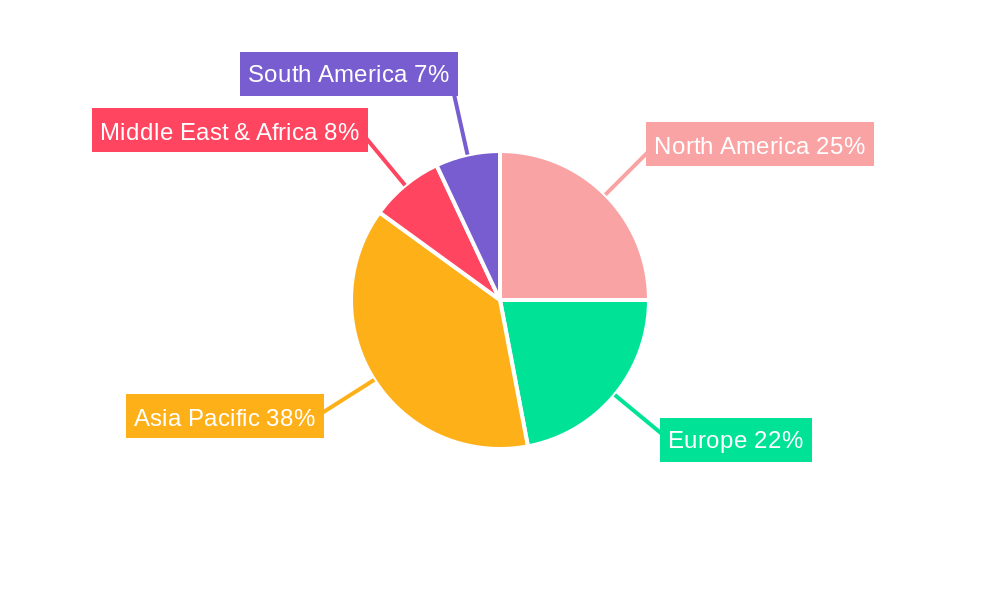
The market's growth trajectory is influenced by several factors. Government initiatives promoting grid modernization and renewable energy integration are significant catalysts. However, challenges such as high initial investment costs for infrastructure development and potential supply chain disruptions due to material scarcity and geopolitical factors could act as restraints. Nevertheless, ongoing technological advancements in conductor materials and manufacturing processes, along with increasing demand for reliable and efficient power transmission, are expected to outweigh these challenges, sustaining a robust growth outlook for the overhead line conductors market throughout the forecast period. Regional variations in growth are anticipated, with Asia-Pacific and North America likely to be leading markets due to substantial investment in power infrastructure and renewable energy projects.
Overhead Line Conductors Company Market Share
Overhead Line Conductors Market Report: 2019-2033 Forecast
Uncover the intricacies of the global Overhead Line Conductors market with this comprehensive report, offering a detailed analysis from 2019 to 2033. Valued at $XX million in 2025, this market is poised for significant growth. This in-depth study provides critical insights for industry stakeholders, investors, and strategic decision-makers seeking a clear understanding of market trends, competitive dynamics, and future opportunities. The report covers key players like Southwire, Prysmian, and Nexans, across various segments including ACSR, AAAC conductors and applications ranging from low to ultra-high voltage.
Overhead Line Conductors Market Dynamics & Concentration
The global overhead line conductors market, valued at $XX million in 2025, exhibits a moderately concentrated landscape. Key players, including Southwire, Prysmian, and Nexans, hold significant market share, driven by extensive production capacity, technological advancements, and established global distribution networks. The market concentration ratio (CR4) is estimated at XX%, indicating the influence of a few dominant players.
- Innovation Drivers: Ongoing R&D efforts focus on enhancing conductor materials (e.g., high-temperature superconductors), improving conductor designs for increased efficiency and lifespan, and developing smart grid technologies for enhanced grid management.
- Regulatory Frameworks: Stringent safety regulations and environmental standards, particularly concerning conductor lifespan and environmental impact, influence market dynamics and drive innovation towards sustainable solutions.
- Product Substitutes: While overhead line conductors remain the primary transmission method, alternative technologies like underground cables are gaining traction in specific applications due to factors like land constraints and reduced visual impact. The market share of these substitutes is currently at xx%.
- End-User Trends: The increasing demand for electricity globally, fueled by rising urbanization and industrialization, is a primary growth driver. This is further intensified by the expansion of renewable energy sources, requiring robust and efficient transmission infrastructure.
- M&A Activities: The historical period (2019-2024) witnessed approximately XX M&A deals, primarily focused on consolidating market share, expanding geographical reach, and accessing new technologies. The estimated deal value for these transactions was $XX million. The forecast period (2025-2033) is projected to see a similar level of activity.
Overhead Line Conductors Industry Trends & Analysis
The overhead line conductors market is experiencing robust growth, with a CAGR of XX% projected from 2025 to 2033. This growth is attributed to several key factors. The increasing global energy demand, driven by economic growth and population expansion, necessitates the expansion and modernization of power transmission networks. Technological advancements, such as the development of high-capacity conductors and smart grid technologies, further enhance efficiency and reliability. Furthermore, government initiatives promoting renewable energy integration and grid modernization are creating significant opportunities. The market penetration rate of advanced conductor types, like AACSR, is expected to reach XX% by 2033, driven by their enhanced performance characteristics. Competitive dynamics are characterized by intense competition among established players, focusing on cost optimization, product differentiation, and strategic partnerships.
Leading Markets & Segments in Overhead Line Conductors
The Asia-Pacific region currently dominates the overhead line conductors market, driven by rapid infrastructure development and substantial investments in power transmission projects. China and India are key contributors to this regional dominance.
- Key Drivers:
- Economic Policies: Government initiatives focused on infrastructure development and grid modernization significantly impact market growth.
- Infrastructure Development: Expansion of power transmission networks to meet increasing energy demand drives significant growth.
- Renewable Energy Integration: The increasing adoption of renewable energy sources necessitates robust transmission infrastructure, further bolstering market demand.
Segment Dominance:
- Application: The High Pressure (69-345 kV) segment currently holds the largest market share, driven by the extensive use of overhead lines in long-distance power transmission.
- Type: ACSR conductors maintain a dominant market share due to their cost-effectiveness and reliable performance. However, the AACSR segment is expected to witness significant growth due to its superior strength and conductivity.
Overhead Line Conductors Product Developments
Recent product innovations focus on enhancing conductor strength, conductivity, and lifespan. New materials and manufacturing processes are improving the efficiency and reliability of overhead lines. The integration of smart sensors and monitoring systems enhances grid management and reduces maintenance costs. These advancements improve market fit by offering enhanced performance and reducing operational expenses, appealing to utilities and project developers.
Key Drivers of Overhead Line Conductors Growth
The market's growth is propelled by several factors. Firstly, the global rise in energy demand necessitates enhanced power transmission infrastructure. Secondly, government support for renewable energy integration and grid modernization initiatives stimulate investments in new transmission lines. Finally, technological advancements in conductor materials and designs lead to increased efficiency and reliability, driving adoption.
Challenges in the Overhead Line Conductors Market
The market faces challenges, including fluctuating raw material prices (e.g., aluminum and steel), impacting production costs and profitability. Supply chain disruptions can also cause delays and hinder project execution. Furthermore, intense competition among manufacturers necessitates continuous innovation and cost optimization to maintain market share.
Emerging Opportunities in Overhead Line Conductors
The integration of smart grid technologies presents a significant opportunity for market expansion. The development of high-temperature superconductors could revolutionize power transmission, offering greater efficiency and capacity. Strategic partnerships between manufacturers and grid operators can unlock further growth potential by optimizing product development and market access.
Key Milestones in Overhead Line Conductors Industry
- 2020: Introduction of a new high-strength ACSR conductor by Prysmian.
- 2021: Merger of two regional players in the Asia-Pacific market.
- 2022: Launch of a smart grid monitoring system integrated with overhead conductors.
- 2023: Successful pilot project using high-temperature superconductor technology in a power transmission line.
- 2024: Implementation of new environmental regulations impacting conductor production.
Strategic Outlook for Overhead Line Conductors Market
The overhead line conductors market is projected to experience sustained growth in the forecast period (2025-2033), driven by increasing energy demand, renewable energy integration, and technological advancements. Strategic opportunities lie in developing innovative conductor materials, integrating smart grid technologies, and focusing on sustainable solutions. Companies can leverage these opportunities to gain a competitive advantage in this expanding market.
Overhead Line Conductors Segmentation
-
1. Application
- 1.1. Low Pressure (less than 1kv)
- 1.2. Middle Pressure (1-69 kV)
- 1.3. High Pressure (69-345 kV)
- 1.4. Extra-high Pressure (345-800 kV)
- 1.5. Ultra-high Pressure (>800 kV)
-
2. Types
- 2.1. ACSR
- 2.2. AAAC
- 2.3. ACAR
- 2.4. AACSR
- 2.5. AAC
- 2.6. Others
Overhead Line Conductors Segmentation By Geography
-
1. North America
- 1.1. United States
- 1.2. Canada
- 1.3. Mexico
-
2. South America
- 2.1. Brazil
- 2.2. Argentina
- 2.3. Rest of South America
-
3. Europe
- 3.1. United Kingdom
- 3.2. Germany
- 3.3. France
- 3.4. Italy
- 3.5. Spain
- 3.6. Russia
- 3.7. Benelux
- 3.8. Nordics
- 3.9. Rest of Europe
-
4. Middle East & Africa
- 4.1. Turkey
- 4.2. Israel
- 4.3. GCC
- 4.4. North Africa
- 4.5. South Africa
- 4.6. Rest of Middle East & Africa
-
5. Asia Pacific
- 5.1. China
- 5.2. India
- 5.3. Japan
- 5.4. South Korea
- 5.5. ASEAN
- 5.6. Oceania
- 5.7. Rest of Asia Pacific
Overhead Line Conductors Regional Market Share
Geographic Coverage of Overhead Line Conductors
Overhead Line Conductors REPORT HIGHLIGHTS
| Aspects | Details |
|---|---|
| Study Period | 2020-2034 |
| Base Year | 2025 |
| Estimated Year | 2026 |
| Forecast Period | 2026-2034 |
| Historical Period | 2020-2025 |
| Growth Rate | CAGR of 4.2% from 2020-2034 |
| Segmentation |
|
Table of Contents
- 1. Introduction
- 1.1. Research Scope
- 1.2. Market Segmentation
- 1.3. Research Methodology
- 1.4. Definitions and Assumptions
- 2. Executive Summary
- 2.1. Introduction
- 3. Market Dynamics
- 3.1. Introduction
- 3.2. Market Drivers
- 3.3. Market Restrains
- 3.4. Market Trends
- 4. Market Factor Analysis
- 4.1. Porters Five Forces
- 4.2. Supply/Value Chain
- 4.3. PESTEL analysis
- 4.4. Market Entropy
- 4.5. Patent/Trademark Analysis
- 5. Global Overhead Line Conductors Analysis, Insights and Forecast, 2020-2032
- 5.1. Market Analysis, Insights and Forecast - by Application
- 5.1.1. Low Pressure (less than 1kv)
- 5.1.2. Middle Pressure (1-69 kV)
- 5.1.3. High Pressure (69-345 kV)
- 5.1.4. Extra-high Pressure (345-800 kV)
- 5.1.5. Ultra-high Pressure (>800 kV)
- 5.2. Market Analysis, Insights and Forecast - by Types
- 5.2.1. ACSR
- 5.2.2. AAAC
- 5.2.3. ACAR
- 5.2.4. AACSR
- 5.2.5. AAC
- 5.2.6. Others
- 5.3. Market Analysis, Insights and Forecast - by Region
- 5.3.1. North America
- 5.3.2. South America
- 5.3.3. Europe
- 5.3.4. Middle East & Africa
- 5.3.5. Asia Pacific
- 5.1. Market Analysis, Insights and Forecast - by Application
- 6. North America Overhead Line Conductors Analysis, Insights and Forecast, 2020-2032
- 6.1. Market Analysis, Insights and Forecast - by Application
- 6.1.1. Low Pressure (less than 1kv)
- 6.1.2. Middle Pressure (1-69 kV)
- 6.1.3. High Pressure (69-345 kV)
- 6.1.4. Extra-high Pressure (345-800 kV)
- 6.1.5. Ultra-high Pressure (>800 kV)
- 6.2. Market Analysis, Insights and Forecast - by Types
- 6.2.1. ACSR
- 6.2.2. AAAC
- 6.2.3. ACAR
- 6.2.4. AACSR
- 6.2.5. AAC
- 6.2.6. Others
- 6.1. Market Analysis, Insights and Forecast - by Application
- 7. South America Overhead Line Conductors Analysis, Insights and Forecast, 2020-2032
- 7.1. Market Analysis, Insights and Forecast - by Application
- 7.1.1. Low Pressure (less than 1kv)
- 7.1.2. Middle Pressure (1-69 kV)
- 7.1.3. High Pressure (69-345 kV)
- 7.1.4. Extra-high Pressure (345-800 kV)
- 7.1.5. Ultra-high Pressure (>800 kV)
- 7.2. Market Analysis, Insights and Forecast - by Types
- 7.2.1. ACSR
- 7.2.2. AAAC
- 7.2.3. ACAR
- 7.2.4. AACSR
- 7.2.5. AAC
- 7.2.6. Others
- 7.1. Market Analysis, Insights and Forecast - by Application
- 8. Europe Overhead Line Conductors Analysis, Insights and Forecast, 2020-2032
- 8.1. Market Analysis, Insights and Forecast - by Application
- 8.1.1. Low Pressure (less than 1kv)
- 8.1.2. Middle Pressure (1-69 kV)
- 8.1.3. High Pressure (69-345 kV)
- 8.1.4. Extra-high Pressure (345-800 kV)
- 8.1.5. Ultra-high Pressure (>800 kV)
- 8.2. Market Analysis, Insights and Forecast - by Types
- 8.2.1. ACSR
- 8.2.2. AAAC
- 8.2.3. ACAR
- 8.2.4. AACSR
- 8.2.5. AAC
- 8.2.6. Others
- 8.1. Market Analysis, Insights and Forecast - by Application
- 9. Middle East & Africa Overhead Line Conductors Analysis, Insights and Forecast, 2020-2032
- 9.1. Market Analysis, Insights and Forecast - by Application
- 9.1.1. Low Pressure (less than 1kv)
- 9.1.2. Middle Pressure (1-69 kV)
- 9.1.3. High Pressure (69-345 kV)
- 9.1.4. Extra-high Pressure (345-800 kV)
- 9.1.5. Ultra-high Pressure (>800 kV)
- 9.2. Market Analysis, Insights and Forecast - by Types
- 9.2.1. ACSR
- 9.2.2. AAAC
- 9.2.3. ACAR
- 9.2.4. AACSR
- 9.2.5. AAC
- 9.2.6. Others
- 9.1. Market Analysis, Insights and Forecast - by Application
- 10. Asia Pacific Overhead Line Conductors Analysis, Insights and Forecast, 2020-2032
- 10.1. Market Analysis, Insights and Forecast - by Application
- 10.1.1. Low Pressure (less than 1kv)
- 10.1.2. Middle Pressure (1-69 kV)
- 10.1.3. High Pressure (69-345 kV)
- 10.1.4. Extra-high Pressure (345-800 kV)
- 10.1.5. Ultra-high Pressure (>800 kV)
- 10.2. Market Analysis, Insights and Forecast - by Types
- 10.2.1. ACSR
- 10.2.2. AAAC
- 10.2.3. ACAR
- 10.2.4. AACSR
- 10.2.5. AAC
- 10.2.6. Others
- 10.1. Market Analysis, Insights and Forecast - by Application
- 11. Competitive Analysis
- 11.1. Global Market Share Analysis 2025
- 11.2. Company Profiles
- 11.2.1 Southwire
- 11.2.1.1. Overview
- 11.2.1.2. Products
- 11.2.1.3. SWOT Analysis
- 11.2.1.4. Recent Developments
- 11.2.1.5. Financials (Based on Availability)
- 11.2.2 Apar Industries
- 11.2.2.1. Overview
- 11.2.2.2. Products
- 11.2.2.3. SWOT Analysis
- 11.2.2.4. Recent Developments
- 11.2.2.5. Financials (Based on Availability)
- 11.2.3 ZTT
- 11.2.3.1. Overview
- 11.2.3.2. Products
- 11.2.3.3. SWOT Analysis
- 11.2.3.4. Recent Developments
- 11.2.3.5. Financials (Based on Availability)
- 11.2.4 Prysmian
- 11.2.4.1. Overview
- 11.2.4.2. Products
- 11.2.4.3. SWOT Analysis
- 11.2.4.4. Recent Developments
- 11.2.4.5. Financials (Based on Availability)
- 11.2.5 Zhuyou
- 11.2.5.1. Overview
- 11.2.5.2. Products
- 11.2.5.3. SWOT Analysis
- 11.2.5.4. Recent Developments
- 11.2.5.5. Financials (Based on Availability)
- 11.2.6 Nexans
- 11.2.6.1. Overview
- 11.2.6.2. Products
- 11.2.6.3. SWOT Analysis
- 11.2.6.4. Recent Developments
- 11.2.6.5. Financials (Based on Availability)
- 11.2.7 Tongda
- 11.2.7.1. Overview
- 11.2.7.2. Products
- 11.2.7.3. SWOT Analysis
- 11.2.7.4. Recent Developments
- 11.2.7.5. Financials (Based on Availability)
- 11.2.8 SWCC
- 11.2.8.1. Overview
- 11.2.8.2. Products
- 11.2.8.3. SWOT Analysis
- 11.2.8.4. Recent Developments
- 11.2.8.5. Financials (Based on Availability)
- 11.2.9 Oman Cables
- 11.2.9.1. Overview
- 11.2.9.2. Products
- 11.2.9.3. SWOT Analysis
- 11.2.9.4. Recent Developments
- 11.2.9.5. Financials (Based on Availability)
- 11.2.10 Bekaert
- 11.2.10.1. Overview
- 11.2.10.2. Products
- 11.2.10.3. SWOT Analysis
- 11.2.10.4. Recent Developments
- 11.2.10.5. Financials (Based on Availability)
- 11.2.11 Hengtong Group
- 11.2.11.1. Overview
- 11.2.11.2. Products
- 11.2.11.3. SWOT Analysis
- 11.2.11.4. Recent Developments
- 11.2.11.5. Financials (Based on Availability)
- 11.2.12 3M
- 11.2.12.1. Overview
- 11.2.12.2. Products
- 11.2.12.3. SWOT Analysis
- 11.2.12.4. Recent Developments
- 11.2.12.5. Financials (Based on Availability)
- 11.2.13 Diamond Power Infrastructure
- 11.2.13.1. Overview
- 11.2.13.2. Products
- 11.2.13.3. SWOT Analysis
- 11.2.13.4. Recent Developments
- 11.2.13.5. Financials (Based on Availability)
- 11.2.14 LAMIFIL
- 11.2.14.1. Overview
- 11.2.14.2. Products
- 11.2.14.3. SWOT Analysis
- 11.2.14.4. Recent Developments
- 11.2.14.5. Financials (Based on Availability)
- 11.2.15 Midal
- 11.2.15.1. Overview
- 11.2.15.2. Products
- 11.2.15.3. SWOT Analysis
- 11.2.15.4. Recent Developments
- 11.2.15.5. Financials (Based on Availability)
- 11.2.16 LUMPI BERNDORF
- 11.2.16.1. Overview
- 11.2.16.2. Products
- 11.2.16.3. SWOT Analysis
- 11.2.16.4. Recent Developments
- 11.2.16.5. Financials (Based on Availability)
- 11.2.17 CTC
- 11.2.17.1. Overview
- 11.2.17.2. Products
- 11.2.17.3. SWOT Analysis
- 11.2.17.4. Recent Developments
- 11.2.17.5. Financials (Based on Availability)
- 11.2.18 Eland Cables
- 11.2.18.1. Overview
- 11.2.18.2. Products
- 11.2.18.3. SWOT Analysis
- 11.2.18.4. Recent Developments
- 11.2.18.5. Financials (Based on Availability)
- 11.2.19 Kelani
- 11.2.19.1. Overview
- 11.2.19.2. Products
- 11.2.19.3. SWOT Analysis
- 11.2.19.4. Recent Developments
- 11.2.19.5. Financials (Based on Availability)
- 11.2.20 Jeddah
- 11.2.20.1. Overview
- 11.2.20.2. Products
- 11.2.20.3. SWOT Analysis
- 11.2.20.4. Recent Developments
- 11.2.20.5. Financials (Based on Availability)
- 11.2.21 CABCON
- 11.2.21.1. Overview
- 11.2.21.2. Products
- 11.2.21.3. SWOT Analysis
- 11.2.21.4. Recent Developments
- 11.2.21.5. Financials (Based on Availability)
- 11.2.22 Galaxy
- 11.2.22.1. Overview
- 11.2.22.2. Products
- 11.2.22.3. SWOT Analysis
- 11.2.22.4. Recent Developments
- 11.2.22.5. Financials (Based on Availability)
- 11.2.23 Alcon
- 11.2.23.1. Overview
- 11.2.23.2. Products
- 11.2.23.3. SWOT Analysis
- 11.2.23.4. Recent Developments
- 11.2.23.5. Financials (Based on Availability)
- 11.2.1 Southwire
List of Figures
- Figure 1: Global Overhead Line Conductors Revenue Breakdown (million, %) by Region 2025 & 2033
- Figure 2: Global Overhead Line Conductors Volume Breakdown (K, %) by Region 2025 & 2033
- Figure 3: North America Overhead Line Conductors Revenue (million), by Application 2025 & 2033
- Figure 4: North America Overhead Line Conductors Volume (K), by Application 2025 & 2033
- Figure 5: North America Overhead Line Conductors Revenue Share (%), by Application 2025 & 2033
- Figure 6: North America Overhead Line Conductors Volume Share (%), by Application 2025 & 2033
- Figure 7: North America Overhead Line Conductors Revenue (million), by Types 2025 & 2033
- Figure 8: North America Overhead Line Conductors Volume (K), by Types 2025 & 2033
- Figure 9: North America Overhead Line Conductors Revenue Share (%), by Types 2025 & 2033
- Figure 10: North America Overhead Line Conductors Volume Share (%), by Types 2025 & 2033
- Figure 11: North America Overhead Line Conductors Revenue (million), by Country 2025 & 2033
- Figure 12: North America Overhead Line Conductors Volume (K), by Country 2025 & 2033
- Figure 13: North America Overhead Line Conductors Revenue Share (%), by Country 2025 & 2033
- Figure 14: North America Overhead Line Conductors Volume Share (%), by Country 2025 & 2033
- Figure 15: South America Overhead Line Conductors Revenue (million), by Application 2025 & 2033
- Figure 16: South America Overhead Line Conductors Volume (K), by Application 2025 & 2033
- Figure 17: South America Overhead Line Conductors Revenue Share (%), by Application 2025 & 2033
- Figure 18: South America Overhead Line Conductors Volume Share (%), by Application 2025 & 2033
- Figure 19: South America Overhead Line Conductors Revenue (million), by Types 2025 & 2033
- Figure 20: South America Overhead Line Conductors Volume (K), by Types 2025 & 2033
- Figure 21: South America Overhead Line Conductors Revenue Share (%), by Types 2025 & 2033
- Figure 22: South America Overhead Line Conductors Volume Share (%), by Types 2025 & 2033
- Figure 23: South America Overhead Line Conductors Revenue (million), by Country 2025 & 2033
- Figure 24: South America Overhead Line Conductors Volume (K), by Country 2025 & 2033
- Figure 25: South America Overhead Line Conductors Revenue Share (%), by Country 2025 & 2033
- Figure 26: South America Overhead Line Conductors Volume Share (%), by Country 2025 & 2033
- Figure 27: Europe Overhead Line Conductors Revenue (million), by Application 2025 & 2033
- Figure 28: Europe Overhead Line Conductors Volume (K), by Application 2025 & 2033
- Figure 29: Europe Overhead Line Conductors Revenue Share (%), by Application 2025 & 2033
- Figure 30: Europe Overhead Line Conductors Volume Share (%), by Application 2025 & 2033
- Figure 31: Europe Overhead Line Conductors Revenue (million), by Types 2025 & 2033
- Figure 32: Europe Overhead Line Conductors Volume (K), by Types 2025 & 2033
- Figure 33: Europe Overhead Line Conductors Revenue Share (%), by Types 2025 & 2033
- Figure 34: Europe Overhead Line Conductors Volume Share (%), by Types 2025 & 2033
- Figure 35: Europe Overhead Line Conductors Revenue (million), by Country 2025 & 2033
- Figure 36: Europe Overhead Line Conductors Volume (K), by Country 2025 & 2033
- Figure 37: Europe Overhead Line Conductors Revenue Share (%), by Country 2025 & 2033
- Figure 38: Europe Overhead Line Conductors Volume Share (%), by Country 2025 & 2033
- Figure 39: Middle East & Africa Overhead Line Conductors Revenue (million), by Application 2025 & 2033
- Figure 40: Middle East & Africa Overhead Line Conductors Volume (K), by Application 2025 & 2033
- Figure 41: Middle East & Africa Overhead Line Conductors Revenue Share (%), by Application 2025 & 2033
- Figure 42: Middle East & Africa Overhead Line Conductors Volume Share (%), by Application 2025 & 2033
- Figure 43: Middle East & Africa Overhead Line Conductors Revenue (million), by Types 2025 & 2033
- Figure 44: Middle East & Africa Overhead Line Conductors Volume (K), by Types 2025 & 2033
- Figure 45: Middle East & Africa Overhead Line Conductors Revenue Share (%), by Types 2025 & 2033
- Figure 46: Middle East & Africa Overhead Line Conductors Volume Share (%), by Types 2025 & 2033
- Figure 47: Middle East & Africa Overhead Line Conductors Revenue (million), by Country 2025 & 2033
- Figure 48: Middle East & Africa Overhead Line Conductors Volume (K), by Country 2025 & 2033
- Figure 49: Middle East & Africa Overhead Line Conductors Revenue Share (%), by Country 2025 & 2033
- Figure 50: Middle East & Africa Overhead Line Conductors Volume Share (%), by Country 2025 & 2033
- Figure 51: Asia Pacific Overhead Line Conductors Revenue (million), by Application 2025 & 2033
- Figure 52: Asia Pacific Overhead Line Conductors Volume (K), by Application 2025 & 2033
- Figure 53: Asia Pacific Overhead Line Conductors Revenue Share (%), by Application 2025 & 2033
- Figure 54: Asia Pacific Overhead Line Conductors Volume Share (%), by Application 2025 & 2033
- Figure 55: Asia Pacific Overhead Line Conductors Revenue (million), by Types 2025 & 2033
- Figure 56: Asia Pacific Overhead Line Conductors Volume (K), by Types 2025 & 2033
- Figure 57: Asia Pacific Overhead Line Conductors Revenue Share (%), by Types 2025 & 2033
- Figure 58: Asia Pacific Overhead Line Conductors Volume Share (%), by Types 2025 & 2033
- Figure 59: Asia Pacific Overhead Line Conductors Revenue (million), by Country 2025 & 2033
- Figure 60: Asia Pacific Overhead Line Conductors Volume (K), by Country 2025 & 2033
- Figure 61: Asia Pacific Overhead Line Conductors Revenue Share (%), by Country 2025 & 2033
- Figure 62: Asia Pacific Overhead Line Conductors Volume Share (%), by Country 2025 & 2033
List of Tables
- Table 1: Global Overhead Line Conductors Revenue million Forecast, by Application 2020 & 2033
- Table 2: Global Overhead Line Conductors Volume K Forecast, by Application 2020 & 2033
- Table 3: Global Overhead Line Conductors Revenue million Forecast, by Types 2020 & 2033
- Table 4: Global Overhead Line Conductors Volume K Forecast, by Types 2020 & 2033
- Table 5: Global Overhead Line Conductors Revenue million Forecast, by Region 2020 & 2033
- Table 6: Global Overhead Line Conductors Volume K Forecast, by Region 2020 & 2033
- Table 7: Global Overhead Line Conductors Revenue million Forecast, by Application 2020 & 2033
- Table 8: Global Overhead Line Conductors Volume K Forecast, by Application 2020 & 2033
- Table 9: Global Overhead Line Conductors Revenue million Forecast, by Types 2020 & 2033
- Table 10: Global Overhead Line Conductors Volume K Forecast, by Types 2020 & 2033
- Table 11: Global Overhead Line Conductors Revenue million Forecast, by Country 2020 & 2033
- Table 12: Global Overhead Line Conductors Volume K Forecast, by Country 2020 & 2033
- Table 13: United States Overhead Line Conductors Revenue (million) Forecast, by Application 2020 & 2033
- Table 14: United States Overhead Line Conductors Volume (K) Forecast, by Application 2020 & 2033
- Table 15: Canada Overhead Line Conductors Revenue (million) Forecast, by Application 2020 & 2033
- Table 16: Canada Overhead Line Conductors Volume (K) Forecast, by Application 2020 & 2033
- Table 17: Mexico Overhead Line Conductors Revenue (million) Forecast, by Application 2020 & 2033
- Table 18: Mexico Overhead Line Conductors Volume (K) Forecast, by Application 2020 & 2033
- Table 19: Global Overhead Line Conductors Revenue million Forecast, by Application 2020 & 2033
- Table 20: Global Overhead Line Conductors Volume K Forecast, by Application 2020 & 2033
- Table 21: Global Overhead Line Conductors Revenue million Forecast, by Types 2020 & 2033
- Table 22: Global Overhead Line Conductors Volume K Forecast, by Types 2020 & 2033
- Table 23: Global Overhead Line Conductors Revenue million Forecast, by Country 2020 & 2033
- Table 24: Global Overhead Line Conductors Volume K Forecast, by Country 2020 & 2033
- Table 25: Brazil Overhead Line Conductors Revenue (million) Forecast, by Application 2020 & 2033
- Table 26: Brazil Overhead Line Conductors Volume (K) Forecast, by Application 2020 & 2033
- Table 27: Argentina Overhead Line Conductors Revenue (million) Forecast, by Application 2020 & 2033
- Table 28: Argentina Overhead Line Conductors Volume (K) Forecast, by Application 2020 & 2033
- Table 29: Rest of South America Overhead Line Conductors Revenue (million) Forecast, by Application 2020 & 2033
- Table 30: Rest of South America Overhead Line Conductors Volume (K) Forecast, by Application 2020 & 2033
- Table 31: Global Overhead Line Conductors Revenue million Forecast, by Application 2020 & 2033
- Table 32: Global Overhead Line Conductors Volume K Forecast, by Application 2020 & 2033
- Table 33: Global Overhead Line Conductors Revenue million Forecast, by Types 2020 & 2033
- Table 34: Global Overhead Line Conductors Volume K Forecast, by Types 2020 & 2033
- Table 35: Global Overhead Line Conductors Revenue million Forecast, by Country 2020 & 2033
- Table 36: Global Overhead Line Conductors Volume K Forecast, by Country 2020 & 2033
- Table 37: United Kingdom Overhead Line Conductors Revenue (million) Forecast, by Application 2020 & 2033
- Table 38: United Kingdom Overhead Line Conductors Volume (K) Forecast, by Application 2020 & 2033
- Table 39: Germany Overhead Line Conductors Revenue (million) Forecast, by Application 2020 & 2033
- Table 40: Germany Overhead Line Conductors Volume (K) Forecast, by Application 2020 & 2033
- Table 41: France Overhead Line Conductors Revenue (million) Forecast, by Application 2020 & 2033
- Table 42: France Overhead Line Conductors Volume (K) Forecast, by Application 2020 & 2033
- Table 43: Italy Overhead Line Conductors Revenue (million) Forecast, by Application 2020 & 2033
- Table 44: Italy Overhead Line Conductors Volume (K) Forecast, by Application 2020 & 2033
- Table 45: Spain Overhead Line Conductors Revenue (million) Forecast, by Application 2020 & 2033
- Table 46: Spain Overhead Line Conductors Volume (K) Forecast, by Application 2020 & 2033
- Table 47: Russia Overhead Line Conductors Revenue (million) Forecast, by Application 2020 & 2033
- Table 48: Russia Overhead Line Conductors Volume (K) Forecast, by Application 2020 & 2033
- Table 49: Benelux Overhead Line Conductors Revenue (million) Forecast, by Application 2020 & 2033
- Table 50: Benelux Overhead Line Conductors Volume (K) Forecast, by Application 2020 & 2033
- Table 51: Nordics Overhead Line Conductors Revenue (million) Forecast, by Application 2020 & 2033
- Table 52: Nordics Overhead Line Conductors Volume (K) Forecast, by Application 2020 & 2033
- Table 53: Rest of Europe Overhead Line Conductors Revenue (million) Forecast, by Application 2020 & 2033
- Table 54: Rest of Europe Overhead Line Conductors Volume (K) Forecast, by Application 2020 & 2033
- Table 55: Global Overhead Line Conductors Revenue million Forecast, by Application 2020 & 2033
- Table 56: Global Overhead Line Conductors Volume K Forecast, by Application 2020 & 2033
- Table 57: Global Overhead Line Conductors Revenue million Forecast, by Types 2020 & 2033
- Table 58: Global Overhead Line Conductors Volume K Forecast, by Types 2020 & 2033
- Table 59: Global Overhead Line Conductors Revenue million Forecast, by Country 2020 & 2033
- Table 60: Global Overhead Line Conductors Volume K Forecast, by Country 2020 & 2033
- Table 61: Turkey Overhead Line Conductors Revenue (million) Forecast, by Application 2020 & 2033
- Table 62: Turkey Overhead Line Conductors Volume (K) Forecast, by Application 2020 & 2033
- Table 63: Israel Overhead Line Conductors Revenue (million) Forecast, by Application 2020 & 2033
- Table 64: Israel Overhead Line Conductors Volume (K) Forecast, by Application 2020 & 2033
- Table 65: GCC Overhead Line Conductors Revenue (million) Forecast, by Application 2020 & 2033
- Table 66: GCC Overhead Line Conductors Volume (K) Forecast, by Application 2020 & 2033
- Table 67: North Africa Overhead Line Conductors Revenue (million) Forecast, by Application 2020 & 2033
- Table 68: North Africa Overhead Line Conductors Volume (K) Forecast, by Application 2020 & 2033
- Table 69: South Africa Overhead Line Conductors Revenue (million) Forecast, by Application 2020 & 2033
- Table 70: South Africa Overhead Line Conductors Volume (K) Forecast, by Application 2020 & 2033
- Table 71: Rest of Middle East & Africa Overhead Line Conductors Revenue (million) Forecast, by Application 2020 & 2033
- Table 72: Rest of Middle East & Africa Overhead Line Conductors Volume (K) Forecast, by Application 2020 & 2033
- Table 73: Global Overhead Line Conductors Revenue million Forecast, by Application 2020 & 2033
- Table 74: Global Overhead Line Conductors Volume K Forecast, by Application 2020 & 2033
- Table 75: Global Overhead Line Conductors Revenue million Forecast, by Types 2020 & 2033
- Table 76: Global Overhead Line Conductors Volume K Forecast, by Types 2020 & 2033
- Table 77: Global Overhead Line Conductors Revenue million Forecast, by Country 2020 & 2033
- Table 78: Global Overhead Line Conductors Volume K Forecast, by Country 2020 & 2033
- Table 79: China Overhead Line Conductors Revenue (million) Forecast, by Application 2020 & 2033
- Table 80: China Overhead Line Conductors Volume (K) Forecast, by Application 2020 & 2033
- Table 81: India Overhead Line Conductors Revenue (million) Forecast, by Application 2020 & 2033
- Table 82: India Overhead Line Conductors Volume (K) Forecast, by Application 2020 & 2033
- Table 83: Japan Overhead Line Conductors Revenue (million) Forecast, by Application 2020 & 2033
- Table 84: Japan Overhead Line Conductors Volume (K) Forecast, by Application 2020 & 2033
- Table 85: South Korea Overhead Line Conductors Revenue (million) Forecast, by Application 2020 & 2033
- Table 86: South Korea Overhead Line Conductors Volume (K) Forecast, by Application 2020 & 2033
- Table 87: ASEAN Overhead Line Conductors Revenue (million) Forecast, by Application 2020 & 2033
- Table 88: ASEAN Overhead Line Conductors Volume (K) Forecast, by Application 2020 & 2033
- Table 89: Oceania Overhead Line Conductors Revenue (million) Forecast, by Application 2020 & 2033
- Table 90: Oceania Overhead Line Conductors Volume (K) Forecast, by Application 2020 & 2033
- Table 91: Rest of Asia Pacific Overhead Line Conductors Revenue (million) Forecast, by Application 2020 & 2033
- Table 92: Rest of Asia Pacific Overhead Line Conductors Volume (K) Forecast, by Application 2020 & 2033
Frequently Asked Questions
1. What is the projected Compound Annual Growth Rate (CAGR) of the Overhead Line Conductors?
The projected CAGR is approximately 4.2%.
2. Which companies are prominent players in the Overhead Line Conductors?
Key companies in the market include Southwire, Apar Industries, ZTT, Prysmian, Zhuyou, Nexans, Tongda, SWCC, Oman Cables, Bekaert, Hengtong Group, 3M, Diamond Power Infrastructure, LAMIFIL, Midal, LUMPI BERNDORF, CTC, Eland Cables, Kelani, Jeddah, CABCON, Galaxy, Alcon.
3. What are the main segments of the Overhead Line Conductors?
The market segments include Application, Types.
4. Can you provide details about the market size?
The market size is estimated to be USD 6882 million as of 2022.
5. What are some drivers contributing to market growth?
N/A
6. What are the notable trends driving market growth?
N/A
7. Are there any restraints impacting market growth?
N/A
8. Can you provide examples of recent developments in the market?
N/A
9. What pricing options are available for accessing the report?
Pricing options include single-user, multi-user, and enterprise licenses priced at USD 4350.00, USD 6525.00, and USD 8700.00 respectively.
10. Is the market size provided in terms of value or volume?
The market size is provided in terms of value, measured in million and volume, measured in K.
11. Are there any specific market keywords associated with the report?
Yes, the market keyword associated with the report is "Overhead Line Conductors," which aids in identifying and referencing the specific market segment covered.
12. How do I determine which pricing option suits my needs best?
The pricing options vary based on user requirements and access needs. Individual users may opt for single-user licenses, while businesses requiring broader access may choose multi-user or enterprise licenses for cost-effective access to the report.
13. Are there any additional resources or data provided in the Overhead Line Conductors report?
While the report offers comprehensive insights, it's advisable to review the specific contents or supplementary materials provided to ascertain if additional resources or data are available.
14. How can I stay updated on further developments or reports in the Overhead Line Conductors?
To stay informed about further developments, trends, and reports in the Overhead Line Conductors, consider subscribing to industry newsletters, following relevant companies and organizations, or regularly checking reputable industry news sources and publications.
Methodology
Step 1 - Identification of Relevant Samples Size from Population Database


Step 2 - Approaches for Defining Global Market Size (Value, Volume* & Price*)

Note*: In applicable scenarios
Step 3 - Data Sources
Primary Research
- Web Analytics
- Survey Reports
- Research Institute
- Latest Research Reports
- Opinion Leaders
Secondary Research
- Annual Reports
- White Paper
- Latest Press Release
- Industry Association
- Paid Database
- Investor Presentations

Step 4 - Data Triangulation
Involves using different sources of information in order to increase the validity of a study
These sources are likely to be stakeholders in a program - participants, other researchers, program staff, other community members, and so on.
Then we put all data in single framework & apply various statistical tools to find out the dynamic on the market.
During the analysis stage, feedback from the stakeholder groups would be compared to determine areas of agreement as well as areas of divergence