

Key Insights
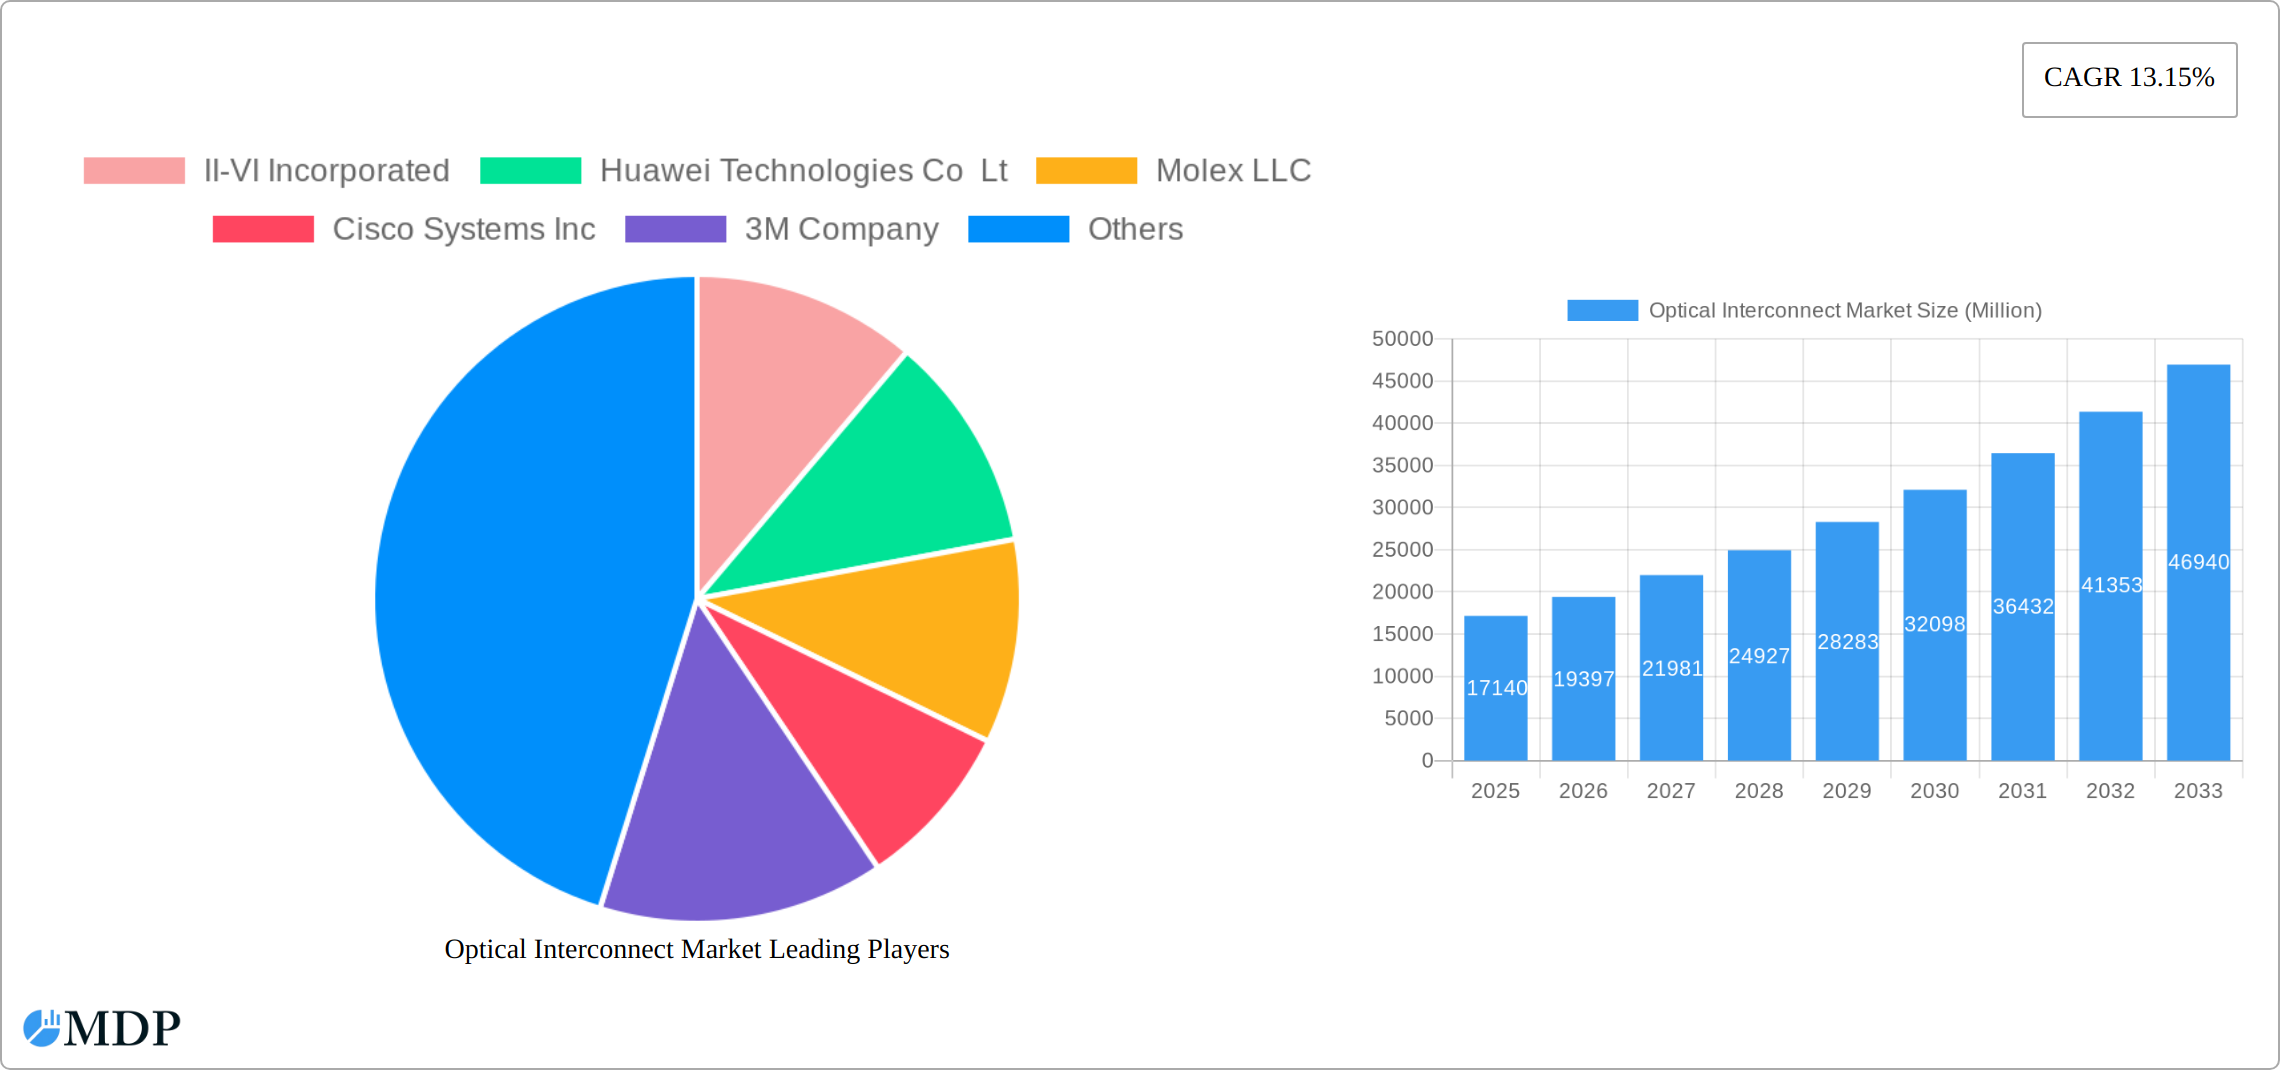
The global optical interconnect market, valued at $17.14 billion in 2025, is poised for robust growth, exhibiting a Compound Annual Growth Rate (CAGR) of 13.15% from 2025 to 2033. This expansion is fueled by several key factors. The burgeoning demand for high-speed data transmission in data centers, fueled by cloud computing and the proliferation of 5G networks, is a primary driver. The increasing adoption of artificial intelligence (AI), machine learning (ML), and high-performance computing (HPC) further intensifies the need for high-bandwidth optical interconnects. Technological advancements, such as the development of more efficient and cost-effective optical transceivers, active optical cables (AOCs), and embedded optical modules (EOMs), are also contributing to market growth. Furthermore, the expansion of fiber optic infrastructure globally creates a favorable environment for market expansion. While potential supply chain constraints and the cyclical nature of the technology sector pose some restraints, the overall market outlook remains exceptionally positive. Segment-wise, data communication applications are expected to dominate due to the ever-increasing data traffic. Geographically, North America and Asia Pacific are projected to be the leading regions, driven by significant investments in advanced technologies and robust infrastructure development in these areas.
The competitive landscape is characterized by a mix of established players like II-VI Incorporated, Huawei Technologies, Molex, Cisco Systems, and 3M, alongside emerging players like Go!Foton. These companies are constantly innovating to enhance product performance, reduce costs, and expand their market share. The market's future trajectory will depend on factors such as the pace of 5G rollout, advancements in data center architecture, the adoption of new technologies like coherent optical transmission, and the overall global economic climate. Companies focusing on research and development, strategic partnerships, and effective supply chain management are likely to gain a significant competitive advantage in this rapidly evolving market. The forecast period (2025-2033) promises substantial growth, making the optical interconnect market an attractive investment opportunity.
Optical Interconnect Market Report: 2019-2033
This comprehensive report provides a detailed analysis of the Optical Interconnect Market, offering invaluable insights for industry stakeholders, investors, and strategic decision-makers. Covering the period 2019-2033, with a base year of 2025 and a forecast period of 2025-2033, this report leverages rigorous data analysis and market research to paint a complete picture of this dynamic sector. The report uses Million for all values.
Key areas covered include market dynamics, industry trends, leading segments and markets, product developments, key drivers and challenges, emerging opportunities, leading players, key milestones, and a strategic outlook for the future. This report is essential for understanding the current state and future trajectory of the Optical Interconnect Market. High-traffic keywords such as "Optical Transceivers," "Active Optical Cables (AOCs)," "Embedded Optical Modules (EOMs)," "Data Communication," "Telecommunication," "Optical Interconnect Market," and "Market Analysis" are incorporated throughout to ensure maximum search visibility.
Optical Interconnect Market Market Dynamics & Concentration
The Optical Interconnect Market is characterized by a moderately concentrated landscape, with key players such as II-VI Incorporated, Huawei Technologies Co Lt, Molex LLC, Cisco Systems Inc, and 3M Company holding significant market share. The market's dynamics are shaped by several factors:
- Innovation Drivers: Continuous advancements in fiber optic technology, miniaturization of components, and increasing demand for higher bandwidth are key drivers of innovation. The development of next-generation optical transceivers with increased speeds and lower power consumption is a major focus.
- Regulatory Frameworks: Government regulations concerning data security and network infrastructure significantly impact market growth. Policies promoting digital infrastructure development in various regions fuel market expansion.
- Product Substitutes: While fiber optics currently dominate, alternative technologies like wireless communication remain a competitive force, albeit with limitations in bandwidth and distance.
- End-User Trends: The rising adoption of cloud computing, the expansion of 5G networks, and the increasing demand for high-speed data transmission across diverse sectors (data centers, telecommunications, automotive) are driving market growth.
- M&A Activities: The number of mergers and acquisitions (M&A) in the sector has been moderate over the past few years, averaging xx deals annually from 2019 to 2024. These activities are primarily driven by the need to expand market reach, enhance technological capabilities, and secure access to key resources. Market share distribution among the top five players is estimated to be around xx%, with the remaining share distributed among numerous smaller participants.
Optical Interconnect Market Industry Trends & Analysis
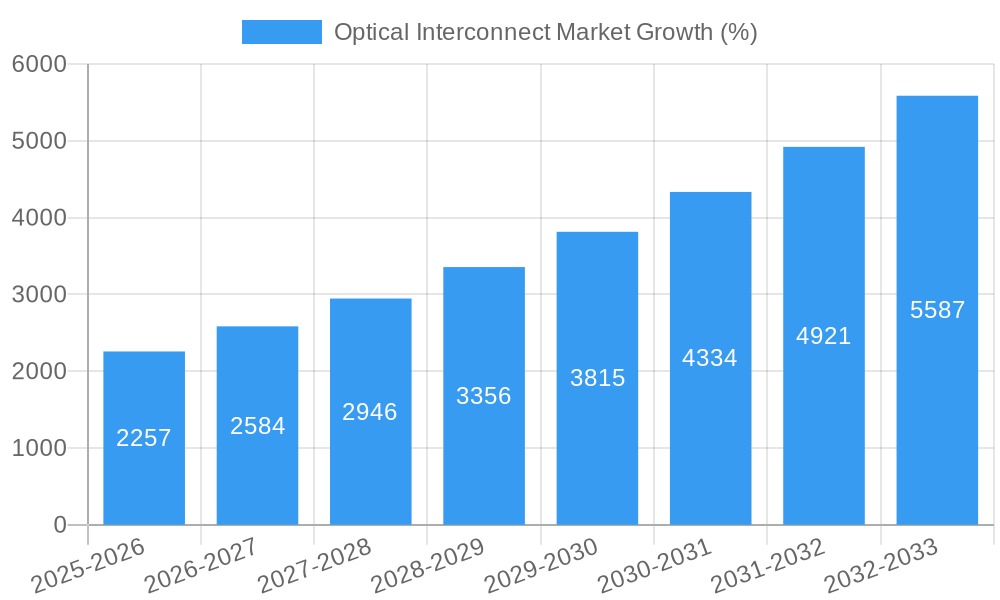
The Optical Interconnect Market is experiencing robust growth, with a Compound Annual Growth Rate (CAGR) projected at xx% during the forecast period (2025-2033). This growth is fueled by several factors:
The widespread adoption of high-speed data transmission technologies across various sectors like telecommunications and data centers is a crucial driver. The increasing demand for high-bandwidth applications, such as cloud computing and 5G networks, is further propelling market expansion. Technological advancements, particularly in the development of higher-speed optical transceivers and active optical cables (AOCs), are enhancing the capabilities and efficiency of optical interconnect solutions. Market penetration of AOCs and EOMs is projected to reach xx% by 2033, driven by their growing adoption in data centers and high-performance computing applications. Competitive dynamics are intensifying as companies strive to enhance their product offerings and expand their market share through innovation, strategic partnerships, and acquisitions.
Leading Markets & Segments in Optical Interconnect Market
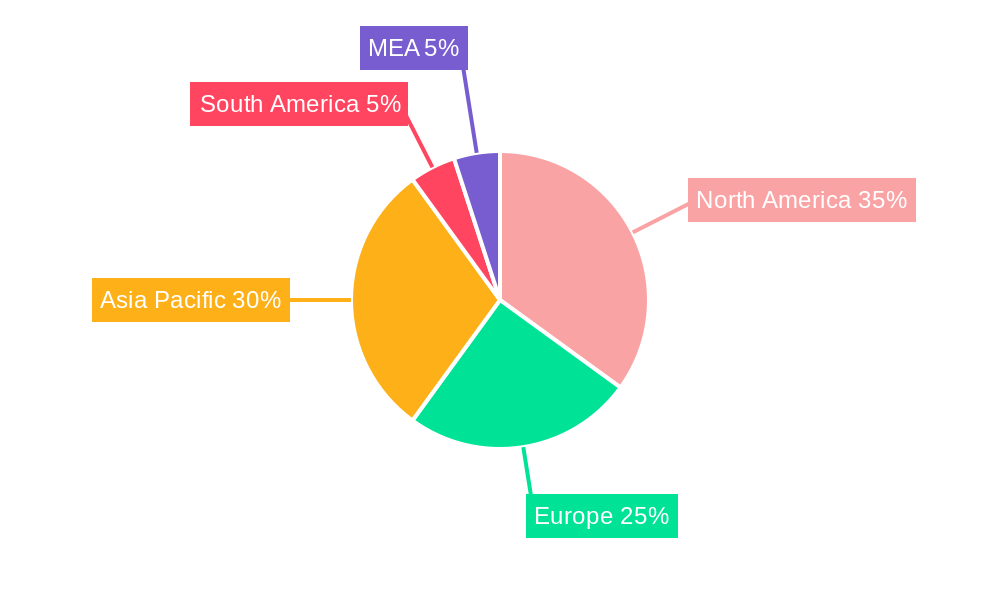
The global Optical Interconnect Market is experiencing robust growth, driven by the exponential increase in data traffic and the widespread adoption of high-bandwidth applications. While North America currently holds a significant market share due to its advanced telecommunications infrastructure and substantial investments in data centers, the Asia-Pacific region is projected to demonstrate the most rapid expansion throughout the forecast period. This surge is fueled by substantial investments in 5G infrastructure and the burgeoning data center market, particularly in countries like China and India.
Key Market Drivers by Segment:
Type:
- Optical Transceivers: The demand for high-speed optical transceivers continues to escalate, primarily driven by the expansion of hyperscale data centers, the global rollout of 5G networks, and the ever-increasing requirements of cloud computing. Advancements in technology are pushing data rates to 400G, 800G, and beyond, further stimulating market growth.
- Active Optical Cables (AOCs): AOCs are gaining significant traction in short-reach data center interconnects due to their ease of installation, cost-effectiveness, and improved performance compared to passive solutions. Their smaller form factor and ease of management are further contributing to their widespread adoption.
- Embedded Optical Modules (EOMs): The integration of EOMs into high-speed computing and telecommunications equipment is accelerating, driven by the need for higher bandwidth density and reduced system footprint. This trend is particularly pronounced in applications requiring high-speed data transmission and processing.
Application:
- Telecommunications: The deployment of 5G networks is a major catalyst for growth in the telecommunications sector. The demand for higher bandwidth and lower latency is driving the adoption of advanced optical interconnect technologies to support the increased data throughput requirements of 5G infrastructure.
- Data Centers: The rapid expansion of data centers globally, fueled by cloud computing, big data analytics, and the Internet of Things (IoT), is a significant driver of market growth. The need for high-speed interconnects within and between data centers is fuelling demand for high-performance optical interconnect solutions.
- High-Performance Computing (HPC): The increasing computational demands of HPC applications are driving the adoption of high-bandwidth, low-latency optical interconnects to enable faster data transfer and processing speeds.
Geographic Considerations: Government initiatives promoting digital infrastructure development, coupled with robust economic growth, are further stimulating market expansion in several key regions. The strong regulatory support in North America and the massive investments in Asia are key factors contributing to regional growth disparities.
Optical Interconnect Market Product Developments
Continuous innovation is shaping the optical interconnect landscape. Key advancements include the development of higher-data-rate transceivers (400G, 800G, and beyond), improved power efficiency through advanced modulation techniques and silicon photonics, and the miniaturization of components to support higher density packaging. Cost-effective AOCs are further expanding the reach of high-speed connectivity, while the integration of EOMs is streamlining system designs and enhancing performance across diverse applications. These innovations are directly addressing the increasing bandwidth demands and space constraints prevalent in modern data centers and telecommunication networks.
Key Drivers of Optical Interconnect Market Growth
Several key factors fuel the market’s growth. Technological advancements, such as the development of higher-speed optical transceivers and smaller form factors, are a major driver. The expanding adoption of cloud computing and 5G networks significantly increases demand for high-bandwidth connectivity. Favorable government policies and investments in digital infrastructure, especially in developing economies, further propel market expansion. Furthermore, the burgeoning demand for high-speed data transmission across various sectors, including data centers and telecommunications, contributes significantly to market growth.
Challenges in the Optical Interconnect Market Market
The Optical Interconnect Market faces challenges like stringent regulatory compliance requirements, particularly regarding data security and network integrity. Supply chain disruptions and fluctuations in raw material prices impact production costs and market stability. Intense competition among established players and the emergence of new competitors create pricing pressures. The potential impact of these challenges can be quantified by assessing their effect on manufacturing output, market share, and overall profitability, with potential losses estimated in the range of xx Million annually.
Emerging Opportunities in Optical Interconnect Market
The integration of artificial intelligence (AI) and machine learning (ML) in optical network management offers significant opportunities for optimizing network performance, resource allocation, and fault prediction. Strategic partnerships and collaborations are fostering innovation and accelerating the development of cutting-edge solutions. The expansion into emerging markets, particularly in developing economies, represents a significant avenue for growth. Moreover, advancements in coherent optical technology, silicon photonics, and next-generation optical transceivers are unlocking new possibilities for higher bandwidth and longer reach, promising continued expansion of the optical interconnect market.
Leading Players in the Optical Interconnect Market Sector
- II-VI Incorporated
- Huawei Technologies Co Lt
- Molex LLC
- Cisco Systems Inc
- 3M Company
- Amphenol Corporation
- TE Connectivity Ltd
- Go!Foton Inc
- Corning Incorporated
- Sumitomo Electric Industries Ltd
Key Milestones in Optical Interconnect Market Industry
- March 2021: Reflex Photonics secured a multimillion-dollar contract for its SpaceABLE 28 optical modules, highlighting the market's expansion into the aerospace sector.
- 2019: Reflex Photonics launched LightCONEX active optical blind mate, showcasing innovation in interconnect technology.
- July 2020: Vodafone New Zealand's collaboration with Ciena Corporation for 800-Gbps data center interconnect demonstrates the growing demand for high-bandwidth solutions.
Strategic Outlook for Optical Interconnect Market Market
The future of the Optical Interconnect Market is bright, driven by continued technological advancements and increasing demand for high-speed data transmission. Strategic opportunities exist in developing innovative products and solutions tailored to specific market needs, forging strategic alliances to expand market reach, and entering emerging markets with high growth potential. Focusing on sustainability and energy efficiency in product development will also drive success. The market is poised for continued robust growth, with significant potential for expansion across diverse sectors.
Optical Interconnect Market Segmentation
-
1. Type
- 1.1. Optical Transceivers
- 1.2. Active Optical Cables (AOCs)
- 1.3. Embedded Optical Modules (EOMs)
-
2. Application
- 2.1. Telecommunication
- 2.2. Data Communication
Optical Interconnect Market Segmentation By Geography
-
1. North America
- 1.1. United States
- 1.2. Canada
-
2. Europe
- 2.1. Germany
- 2.2. United Kingdom
- 2.3. France
- 2.4. Rest of Europe
-
3. Asia Pacific
- 3.1. India
- 3.2. China
- 3.3. Japan
- 3.4. Rest of Asia Pacific
- 4. Latin America
- 5. Middle East and Africa
Optical Interconnect Market REPORT HIGHLIGHTS
| Aspects | Details |
|---|---|
| Study Period | 2019-2033 |
| Base Year | 2024 |
| Estimated Year | 2025 |
| Forecast Period | 2025-2033 |
| Historical Period | 2019-2024 |
| Growth Rate | CAGR of 13.15% from 2019-2033 |
| Segmentation |
|
Table of Contents
- 1. Introduction
- 1.1. Research Scope
- 1.2. Market Segmentation
- 1.3. Research Methodology
- 1.4. Definitions and Assumptions
- 2. Executive Summary
- 2.1. Introduction
- 3. Market Dynamics
- 3.1. Introduction
- 3.2. Market Drivers
- 3.2.1 Increasing Demand for Communication Bandwidth Owing to Demand for Cloud Computing
- 3.2.2 AI
- 3.2.3 and HPC; Increasing Investment in Data Centers Interconnect and Fiber Optic Communication
- 3.3. Market Restrains
- 3.3.1. Slow Commercialization of Optical Interconnection Related Technologies
- 3.4. Market Trends
- 3.4.1. Data Communication is Expected to Spur the Demand for Optical Interconnects
- 4. Market Factor Analysis
- 4.1. Porters Five Forces
- 4.2. Supply/Value Chain
- 4.3. PESTEL analysis
- 4.4. Market Entropy
- 4.5. Patent/Trademark Analysis
- 5. Global Optical Interconnect Market Analysis, Insights and Forecast, 2019-2031
- 5.1. Market Analysis, Insights and Forecast - by Type
- 5.1.1. Optical Transceivers
- 5.1.2. Active Optical Cables (AOCs)
- 5.1.3. Embedded Optical Modules (EOMs)
- 5.2. Market Analysis, Insights and Forecast - by Application
- 5.2.1. Telecommunication
- 5.2.2. Data Communication
- 5.3. Market Analysis, Insights and Forecast - by Region
- 5.3.1. North America
- 5.3.2. Europe
- 5.3.3. Asia Pacific
- 5.3.4. Latin America
- 5.3.5. Middle East and Africa
- 5.1. Market Analysis, Insights and Forecast - by Type
- 6. North America Optical Interconnect Market Analysis, Insights and Forecast, 2019-2031
- 6.1. Market Analysis, Insights and Forecast - by Type
- 6.1.1. Optical Transceivers
- 6.1.2. Active Optical Cables (AOCs)
- 6.1.3. Embedded Optical Modules (EOMs)
- 6.2. Market Analysis, Insights and Forecast - by Application
- 6.2.1. Telecommunication
- 6.2.2. Data Communication
- 6.1. Market Analysis, Insights and Forecast - by Type
- 7. Europe Optical Interconnect Market Analysis, Insights and Forecast, 2019-2031
- 7.1. Market Analysis, Insights and Forecast - by Type
- 7.1.1. Optical Transceivers
- 7.1.2. Active Optical Cables (AOCs)
- 7.1.3. Embedded Optical Modules (EOMs)
- 7.2. Market Analysis, Insights and Forecast - by Application
- 7.2.1. Telecommunication
- 7.2.2. Data Communication
- 7.1. Market Analysis, Insights and Forecast - by Type
- 8. Asia Pacific Optical Interconnect Market Analysis, Insights and Forecast, 2019-2031
- 8.1. Market Analysis, Insights and Forecast - by Type
- 8.1.1. Optical Transceivers
- 8.1.2. Active Optical Cables (AOCs)
- 8.1.3. Embedded Optical Modules (EOMs)
- 8.2. Market Analysis, Insights and Forecast - by Application
- 8.2.1. Telecommunication
- 8.2.2. Data Communication
- 8.1. Market Analysis, Insights and Forecast - by Type
- 9. Latin America Optical Interconnect Market Analysis, Insights and Forecast, 2019-2031
- 9.1. Market Analysis, Insights and Forecast - by Type
- 9.1.1. Optical Transceivers
- 9.1.2. Active Optical Cables (AOCs)
- 9.1.3. Embedded Optical Modules (EOMs)
- 9.2. Market Analysis, Insights and Forecast - by Application
- 9.2.1. Telecommunication
- 9.2.2. Data Communication
- 9.1. Market Analysis, Insights and Forecast - by Type
- 10. Middle East and Africa Optical Interconnect Market Analysis, Insights and Forecast, 2019-2031
- 10.1. Market Analysis, Insights and Forecast - by Type
- 10.1.1. Optical Transceivers
- 10.1.2. Active Optical Cables (AOCs)
- 10.1.3. Embedded Optical Modules (EOMs)
- 10.2. Market Analysis, Insights and Forecast - by Application
- 10.2.1. Telecommunication
- 10.2.2. Data Communication
- 10.1. Market Analysis, Insights and Forecast - by Type
- 11. North America Optical Interconnect Market Analysis, Insights and Forecast, 2019-2031
- 11.1. Market Analysis, Insights and Forecast - By Country/Sub-region
- 11.1.1 United States
- 11.1.2 Canada
- 11.1.3 Mexico
- 12. Europe Optical Interconnect Market Analysis, Insights and Forecast, 2019-2031
- 12.1. Market Analysis, Insights and Forecast - By Country/Sub-region
- 12.1.1 Germany
- 12.1.2 United Kingdom
- 12.1.3 France
- 12.1.4 Spain
- 12.1.5 Italy
- 12.1.6 Spain
- 12.1.7 Belgium
- 12.1.8 Netherland
- 12.1.9 Nordics
- 12.1.10 Rest of Europe
- 13. Asia Pacific Optical Interconnect Market Analysis, Insights and Forecast, 2019-2031
- 13.1. Market Analysis, Insights and Forecast - By Country/Sub-region
- 13.1.1 China
- 13.1.2 Japan
- 13.1.3 India
- 13.1.4 South Korea
- 13.1.5 Southeast Asia
- 13.1.6 Australia
- 13.1.7 Indonesia
- 13.1.8 Phillipes
- 13.1.9 Singapore
- 13.1.10 Thailandc
- 13.1.11 Rest of Asia Pacific
- 14. South America Optical Interconnect Market Analysis, Insights and Forecast, 2019-2031
- 14.1. Market Analysis, Insights and Forecast - By Country/Sub-region
- 14.1.1 Brazil
- 14.1.2 Argentina
- 14.1.3 Peru
- 14.1.4 Chile
- 14.1.5 Colombia
- 14.1.6 Ecuador
- 14.1.7 Venezuela
- 14.1.8 Rest of South America
- 15. North America Optical Interconnect Market Analysis, Insights and Forecast, 2019-2031
- 15.1. Market Analysis, Insights and Forecast - By Country/Sub-region
- 15.1.1 United States
- 15.1.2 Canada
- 15.1.3 Mexico
- 16. MEA Optical Interconnect Market Analysis, Insights and Forecast, 2019-2031
- 16.1. Market Analysis, Insights and Forecast - By Country/Sub-region
- 16.1.1 United Arab Emirates
- 16.1.2 Saudi Arabia
- 16.1.3 South Africa
- 16.1.4 Rest of Middle East and Africa
- 17. Competitive Analysis
- 17.1. Global Market Share Analysis 2024
- 17.2. Company Profiles
- 17.2.1 II-VI Incorporated
- 17.2.1.1. Overview
- 17.2.1.2. Products
- 17.2.1.3. SWOT Analysis
- 17.2.1.4. Recent Developments
- 17.2.1.5. Financials (Based on Availability)
- 17.2.2 Huawei Technologies Co Lt
- 17.2.2.1. Overview
- 17.2.2.2. Products
- 17.2.2.3. SWOT Analysis
- 17.2.2.4. Recent Developments
- 17.2.2.5. Financials (Based on Availability)
- 17.2.3 Molex LLC
- 17.2.3.1. Overview
- 17.2.3.2. Products
- 17.2.3.3. SWOT Analysis
- 17.2.3.4. Recent Developments
- 17.2.3.5. Financials (Based on Availability)
- 17.2.4 Cisco Systems Inc
- 17.2.4.1. Overview
- 17.2.4.2. Products
- 17.2.4.3. SWOT Analysis
- 17.2.4.4. Recent Developments
- 17.2.4.5. Financials (Based on Availability)
- 17.2.5 3M Company
- 17.2.5.1. Overview
- 17.2.5.2. Products
- 17.2.5.3. SWOT Analysis
- 17.2.5.4. Recent Developments
- 17.2.5.5. Financials (Based on Availability)
- 17.2.6 Amphenol Corporation
- 17.2.6.1. Overview
- 17.2.6.2. Products
- 17.2.6.3. SWOT Analysis
- 17.2.6.4. Recent Developments
- 17.2.6.5. Financials (Based on Availability)
- 17.2.7 TE Connectivity Ltd
- 17.2.7.1. Overview
- 17.2.7.2. Products
- 17.2.7.3. SWOT Analysis
- 17.2.7.4. Recent Developments
- 17.2.7.5. Financials (Based on Availability)
- 17.2.8 Go!Foton Inc
- 17.2.8.1. Overview
- 17.2.8.2. Products
- 17.2.8.3. SWOT Analysis
- 17.2.8.4. Recent Developments
- 17.2.8.5. Financials (Based on Availability)
- 17.2.9 Corning Incorporated
- 17.2.9.1. Overview
- 17.2.9.2. Products
- 17.2.9.3. SWOT Analysis
- 17.2.9.4. Recent Developments
- 17.2.9.5. Financials (Based on Availability)
- 17.2.10 Sumitomo Electric Industries Ltd
- 17.2.10.1. Overview
- 17.2.10.2. Products
- 17.2.10.3. SWOT Analysis
- 17.2.10.4. Recent Developments
- 17.2.10.5. Financials (Based on Availability)
- 17.2.1 II-VI Incorporated
List of Figures
- Figure 1: Global Optical Interconnect Market Revenue Breakdown (Million, %) by Region 2024 & 2032
- Figure 2: North America Optical Interconnect Market Revenue (Million), by Country 2024 & 2032
- Figure 3: North America Optical Interconnect Market Revenue Share (%), by Country 2024 & 2032
- Figure 4: Europe Optical Interconnect Market Revenue (Million), by Country 2024 & 2032
- Figure 5: Europe Optical Interconnect Market Revenue Share (%), by Country 2024 & 2032
- Figure 6: Asia Pacific Optical Interconnect Market Revenue (Million), by Country 2024 & 2032
- Figure 7: Asia Pacific Optical Interconnect Market Revenue Share (%), by Country 2024 & 2032
- Figure 8: South America Optical Interconnect Market Revenue (Million), by Country 2024 & 2032
- Figure 9: South America Optical Interconnect Market Revenue Share (%), by Country 2024 & 2032
- Figure 10: North America Optical Interconnect Market Revenue (Million), by Country 2024 & 2032
- Figure 11: North America Optical Interconnect Market Revenue Share (%), by Country 2024 & 2032
- Figure 12: MEA Optical Interconnect Market Revenue (Million), by Country 2024 & 2032
- Figure 13: MEA Optical Interconnect Market Revenue Share (%), by Country 2024 & 2032
- Figure 14: North America Optical Interconnect Market Revenue (Million), by Type 2024 & 2032
- Figure 15: North America Optical Interconnect Market Revenue Share (%), by Type 2024 & 2032
- Figure 16: North America Optical Interconnect Market Revenue (Million), by Application 2024 & 2032
- Figure 17: North America Optical Interconnect Market Revenue Share (%), by Application 2024 & 2032
- Figure 18: North America Optical Interconnect Market Revenue (Million), by Country 2024 & 2032
- Figure 19: North America Optical Interconnect Market Revenue Share (%), by Country 2024 & 2032
- Figure 20: Europe Optical Interconnect Market Revenue (Million), by Type 2024 & 2032
- Figure 21: Europe Optical Interconnect Market Revenue Share (%), by Type 2024 & 2032
- Figure 22: Europe Optical Interconnect Market Revenue (Million), by Application 2024 & 2032
- Figure 23: Europe Optical Interconnect Market Revenue Share (%), by Application 2024 & 2032
- Figure 24: Europe Optical Interconnect Market Revenue (Million), by Country 2024 & 2032
- Figure 25: Europe Optical Interconnect Market Revenue Share (%), by Country 2024 & 2032
- Figure 26: Asia Pacific Optical Interconnect Market Revenue (Million), by Type 2024 & 2032
- Figure 27: Asia Pacific Optical Interconnect Market Revenue Share (%), by Type 2024 & 2032
- Figure 28: Asia Pacific Optical Interconnect Market Revenue (Million), by Application 2024 & 2032
- Figure 29: Asia Pacific Optical Interconnect Market Revenue Share (%), by Application 2024 & 2032
- Figure 30: Asia Pacific Optical Interconnect Market Revenue (Million), by Country 2024 & 2032
- Figure 31: Asia Pacific Optical Interconnect Market Revenue Share (%), by Country 2024 & 2032
- Figure 32: Latin America Optical Interconnect Market Revenue (Million), by Type 2024 & 2032
- Figure 33: Latin America Optical Interconnect Market Revenue Share (%), by Type 2024 & 2032
- Figure 34: Latin America Optical Interconnect Market Revenue (Million), by Application 2024 & 2032
- Figure 35: Latin America Optical Interconnect Market Revenue Share (%), by Application 2024 & 2032
- Figure 36: Latin America Optical Interconnect Market Revenue (Million), by Country 2024 & 2032
- Figure 37: Latin America Optical Interconnect Market Revenue Share (%), by Country 2024 & 2032
- Figure 38: Middle East and Africa Optical Interconnect Market Revenue (Million), by Type 2024 & 2032
- Figure 39: Middle East and Africa Optical Interconnect Market Revenue Share (%), by Type 2024 & 2032
- Figure 40: Middle East and Africa Optical Interconnect Market Revenue (Million), by Application 2024 & 2032
- Figure 41: Middle East and Africa Optical Interconnect Market Revenue Share (%), by Application 2024 & 2032
- Figure 42: Middle East and Africa Optical Interconnect Market Revenue (Million), by Country 2024 & 2032
- Figure 43: Middle East and Africa Optical Interconnect Market Revenue Share (%), by Country 2024 & 2032
List of Tables
- Table 1: Global Optical Interconnect Market Revenue Million Forecast, by Region 2019 & 2032
- Table 2: Global Optical Interconnect Market Revenue Million Forecast, by Type 2019 & 2032
- Table 3: Global Optical Interconnect Market Revenue Million Forecast, by Application 2019 & 2032
- Table 4: Global Optical Interconnect Market Revenue Million Forecast, by Region 2019 & 2032
- Table 5: Global Optical Interconnect Market Revenue Million Forecast, by Country 2019 & 2032
- Table 6: United States Optical Interconnect Market Revenue (Million) Forecast, by Application 2019 & 2032
- Table 7: Canada Optical Interconnect Market Revenue (Million) Forecast, by Application 2019 & 2032
- Table 8: Mexico Optical Interconnect Market Revenue (Million) Forecast, by Application 2019 & 2032
- Table 9: Global Optical Interconnect Market Revenue Million Forecast, by Country 2019 & 2032
- Table 10: Germany Optical Interconnect Market Revenue (Million) Forecast, by Application 2019 & 2032
- Table 11: United Kingdom Optical Interconnect Market Revenue (Million) Forecast, by Application 2019 & 2032
- Table 12: France Optical Interconnect Market Revenue (Million) Forecast, by Application 2019 & 2032
- Table 13: Spain Optical Interconnect Market Revenue (Million) Forecast, by Application 2019 & 2032
- Table 14: Italy Optical Interconnect Market Revenue (Million) Forecast, by Application 2019 & 2032
- Table 15: Spain Optical Interconnect Market Revenue (Million) Forecast, by Application 2019 & 2032
- Table 16: Belgium Optical Interconnect Market Revenue (Million) Forecast, by Application 2019 & 2032
- Table 17: Netherland Optical Interconnect Market Revenue (Million) Forecast, by Application 2019 & 2032
- Table 18: Nordics Optical Interconnect Market Revenue (Million) Forecast, by Application 2019 & 2032
- Table 19: Rest of Europe Optical Interconnect Market Revenue (Million) Forecast, by Application 2019 & 2032
- Table 20: Global Optical Interconnect Market Revenue Million Forecast, by Country 2019 & 2032
- Table 21: China Optical Interconnect Market Revenue (Million) Forecast, by Application 2019 & 2032
- Table 22: Japan Optical Interconnect Market Revenue (Million) Forecast, by Application 2019 & 2032
- Table 23: India Optical Interconnect Market Revenue (Million) Forecast, by Application 2019 & 2032
- Table 24: South Korea Optical Interconnect Market Revenue (Million) Forecast, by Application 2019 & 2032
- Table 25: Southeast Asia Optical Interconnect Market Revenue (Million) Forecast, by Application 2019 & 2032
- Table 26: Australia Optical Interconnect Market Revenue (Million) Forecast, by Application 2019 & 2032
- Table 27: Indonesia Optical Interconnect Market Revenue (Million) Forecast, by Application 2019 & 2032
- Table 28: Phillipes Optical Interconnect Market Revenue (Million) Forecast, by Application 2019 & 2032
- Table 29: Singapore Optical Interconnect Market Revenue (Million) Forecast, by Application 2019 & 2032
- Table 30: Thailandc Optical Interconnect Market Revenue (Million) Forecast, by Application 2019 & 2032
- Table 31: Rest of Asia Pacific Optical Interconnect Market Revenue (Million) Forecast, by Application 2019 & 2032
- Table 32: Global Optical Interconnect Market Revenue Million Forecast, by Country 2019 & 2032
- Table 33: Brazil Optical Interconnect Market Revenue (Million) Forecast, by Application 2019 & 2032
- Table 34: Argentina Optical Interconnect Market Revenue (Million) Forecast, by Application 2019 & 2032
- Table 35: Peru Optical Interconnect Market Revenue (Million) Forecast, by Application 2019 & 2032
- Table 36: Chile Optical Interconnect Market Revenue (Million) Forecast, by Application 2019 & 2032
- Table 37: Colombia Optical Interconnect Market Revenue (Million) Forecast, by Application 2019 & 2032
- Table 38: Ecuador Optical Interconnect Market Revenue (Million) Forecast, by Application 2019 & 2032
- Table 39: Venezuela Optical Interconnect Market Revenue (Million) Forecast, by Application 2019 & 2032
- Table 40: Rest of South America Optical Interconnect Market Revenue (Million) Forecast, by Application 2019 & 2032
- Table 41: Global Optical Interconnect Market Revenue Million Forecast, by Country 2019 & 2032
- Table 42: United States Optical Interconnect Market Revenue (Million) Forecast, by Application 2019 & 2032
- Table 43: Canada Optical Interconnect Market Revenue (Million) Forecast, by Application 2019 & 2032
- Table 44: Mexico Optical Interconnect Market Revenue (Million) Forecast, by Application 2019 & 2032
- Table 45: Global Optical Interconnect Market Revenue Million Forecast, by Country 2019 & 2032
- Table 46: United Arab Emirates Optical Interconnect Market Revenue (Million) Forecast, by Application 2019 & 2032
- Table 47: Saudi Arabia Optical Interconnect Market Revenue (Million) Forecast, by Application 2019 & 2032
- Table 48: South Africa Optical Interconnect Market Revenue (Million) Forecast, by Application 2019 & 2032
- Table 49: Rest of Middle East and Africa Optical Interconnect Market Revenue (Million) Forecast, by Application 2019 & 2032
- Table 50: Global Optical Interconnect Market Revenue Million Forecast, by Type 2019 & 2032
- Table 51: Global Optical Interconnect Market Revenue Million Forecast, by Application 2019 & 2032
- Table 52: Global Optical Interconnect Market Revenue Million Forecast, by Country 2019 & 2032
- Table 53: United States Optical Interconnect Market Revenue (Million) Forecast, by Application 2019 & 2032
- Table 54: Canada Optical Interconnect Market Revenue (Million) Forecast, by Application 2019 & 2032
- Table 55: Global Optical Interconnect Market Revenue Million Forecast, by Type 2019 & 2032
- Table 56: Global Optical Interconnect Market Revenue Million Forecast, by Application 2019 & 2032
- Table 57: Global Optical Interconnect Market Revenue Million Forecast, by Country 2019 & 2032
- Table 58: Germany Optical Interconnect Market Revenue (Million) Forecast, by Application 2019 & 2032
- Table 59: United Kingdom Optical Interconnect Market Revenue (Million) Forecast, by Application 2019 & 2032
- Table 60: France Optical Interconnect Market Revenue (Million) Forecast, by Application 2019 & 2032
- Table 61: Rest of Europe Optical Interconnect Market Revenue (Million) Forecast, by Application 2019 & 2032
- Table 62: Global Optical Interconnect Market Revenue Million Forecast, by Type 2019 & 2032
- Table 63: Global Optical Interconnect Market Revenue Million Forecast, by Application 2019 & 2032
- Table 64: Global Optical Interconnect Market Revenue Million Forecast, by Country 2019 & 2032
- Table 65: India Optical Interconnect Market Revenue (Million) Forecast, by Application 2019 & 2032
- Table 66: China Optical Interconnect Market Revenue (Million) Forecast, by Application 2019 & 2032
- Table 67: Japan Optical Interconnect Market Revenue (Million) Forecast, by Application 2019 & 2032
- Table 68: Rest of Asia Pacific Optical Interconnect Market Revenue (Million) Forecast, by Application 2019 & 2032
- Table 69: Global Optical Interconnect Market Revenue Million Forecast, by Type 2019 & 2032
- Table 70: Global Optical Interconnect Market Revenue Million Forecast, by Application 2019 & 2032
- Table 71: Global Optical Interconnect Market Revenue Million Forecast, by Country 2019 & 2032
- Table 72: Global Optical Interconnect Market Revenue Million Forecast, by Type 2019 & 2032
- Table 73: Global Optical Interconnect Market Revenue Million Forecast, by Application 2019 & 2032
- Table 74: Global Optical Interconnect Market Revenue Million Forecast, by Country 2019 & 2032
Frequently Asked Questions
1. What is the projected Compound Annual Growth Rate (CAGR) of the Optical Interconnect Market?
The projected CAGR is approximately 13.15%.
2. Which companies are prominent players in the Optical Interconnect Market?
Key companies in the market include II-VI Incorporated, Huawei Technologies Co Lt, Molex LLC, Cisco Systems Inc, 3M Company, Amphenol Corporation, TE Connectivity Ltd, Go!Foton Inc, Corning Incorporated, Sumitomo Electric Industries Ltd.
3. What are the main segments of the Optical Interconnect Market?
The market segments include Type, Application.
4. Can you provide details about the market size?
The market size is estimated to be USD 17.14 Million as of 2022.
5. What are some drivers contributing to market growth?
Increasing Demand for Communication Bandwidth Owing to Demand for Cloud Computing. AI. and HPC; Increasing Investment in Data Centers Interconnect and Fiber Optic Communication.
6. What are the notable trends driving market growth?
Data Communication is Expected to Spur the Demand for Optical Interconnects.
7. Are there any restraints impacting market growth?
Slow Commercialization of Optical Interconnection Related Technologies.
8. Can you provide examples of recent developments in the market?
March 2021 - Canada-based Reflex Photonics was awarded a multimillion-dollar contract to deliver thousands of SpaceABLE 28 optical module devices to be used in high-throughput communication satellites (HTCS) that may be deployed in geostationary orbit. Building on the recognized robustness inherent in the design of Reflex Photonics' optical modules, the SpaceABLE28 line may provide radiation-resistant optical interconnect modules tested and qualified for use in harsh space environment. In 2019, the company launched new LightCONEX active optical blind mate that interconnects compatible with the upcoming VITA 66.5 standard and supported by the Sensor Open System Architecture (SOSA) consortium.
9. What pricing options are available for accessing the report?
Pricing options include single-user, multi-user, and enterprise licenses priced at USD 4750, USD 5250, and USD 8750 respectively.
10. Is the market size provided in terms of value or volume?
The market size is provided in terms of value, measured in Million.
11. Are there any specific market keywords associated with the report?
Yes, the market keyword associated with the report is "Optical Interconnect Market," which aids in identifying and referencing the specific market segment covered.
12. How do I determine which pricing option suits my needs best?
The pricing options vary based on user requirements and access needs. Individual users may opt for single-user licenses, while businesses requiring broader access may choose multi-user or enterprise licenses for cost-effective access to the report.
13. Are there any additional resources or data provided in the Optical Interconnect Market report?
While the report offers comprehensive insights, it's advisable to review the specific contents or supplementary materials provided to ascertain if additional resources or data are available.
14. How can I stay updated on further developments or reports in the Optical Interconnect Market?
To stay informed about further developments, trends, and reports in the Optical Interconnect Market, consider subscribing to industry newsletters, following relevant companies and organizations, or regularly checking reputable industry news sources and publications.
Methodology
Step 1 - Identification of Relevant Samples Size from Population Database


Step 2 - Approaches for Defining Global Market Size (Value, Volume* & Price*)

Note*: In applicable scenarios
Step 3 - Data Sources
Primary Research
- Web Analytics
- Survey Reports
- Research Institute
- Latest Research Reports
- Opinion Leaders
Secondary Research
- Annual Reports
- White Paper
- Latest Press Release
- Industry Association
- Paid Database
- Investor Presentations

Step 4 - Data Triangulation
Involves using different sources of information in order to increase the validity of a study
These sources are likely to be stakeholders in a program - participants, other researchers, program staff, other community members, and so on.
Then we put all data in single framework & apply various statistical tools to find out the dynamic on the market.
During the analysis stage, feedback from the stakeholder groups would be compared to determine areas of agreement as well as areas of divergence
