

Key Insights
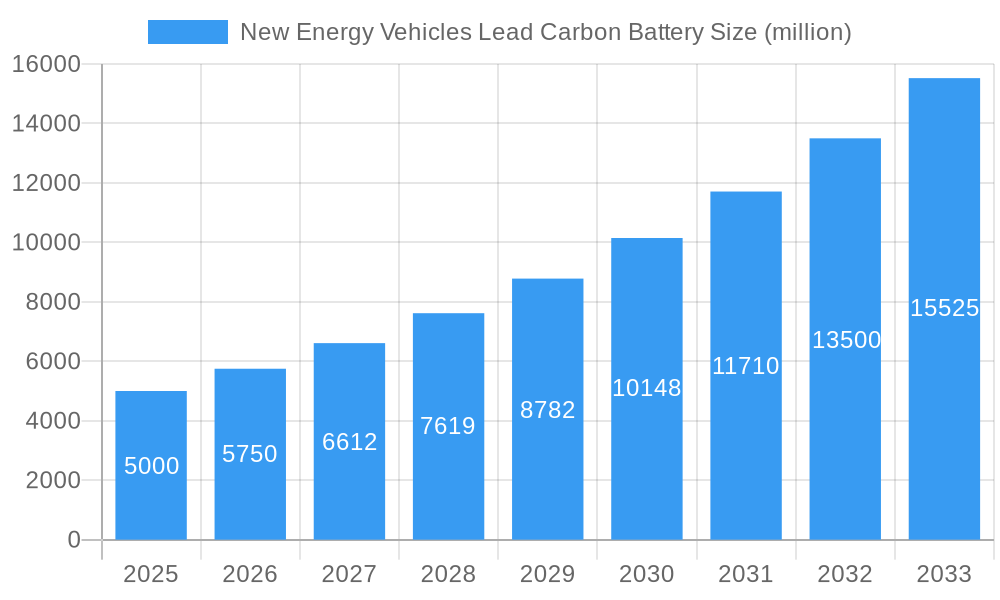
The New Energy Vehicles (NEV) Lead Carbon Battery market is experiencing robust growth, driven by the burgeoning adoption of electric vehicles (EVs) and electric bicycles globally. The market, estimated at $5 billion in 2025, is projected to exhibit a Compound Annual Growth Rate (CAGR) of 15% from 2025 to 2033, reaching approximately $15 billion by 2033. This expansion is fueled by several key factors, including stringent government regulations promoting EV adoption (particularly in Europe and China), increasing consumer demand for environmentally friendly transportation solutions, and continuous advancements in battery technology leading to enhanced energy density and lifespan. The growing popularity of hybrid electric vehicles (HEVs) and electric bicycles, particularly in Asia-Pacific and North America, significantly contributes to the market's expansion. Segment-wise, the "Between 200 and 800 Ah" battery type currently holds the largest market share due to its suitability in a wide range of NEV applications. However, the "Above 800 Ah" segment is poised for significant growth in the coming years, driven by the increasing demand for higher-range EVs.
New Energy Vehicles Lead Carbon Battery Market Size (In Billion)
Despite the positive outlook, challenges remain. Fluctuations in lead and carbon prices, coupled with the potential for stricter environmental regulations concerning lead-acid battery disposal, pose significant restraints. Competition among established players like Furukawa, Eastpenn, and Chinese manufacturers such as Narada and Huafu Energy Storage is intense, demanding continuous innovation and cost optimization strategies for market dominance. Further geographic expansion, particularly in developing economies with nascent EV markets, presents significant opportunities for growth but requires tailored distribution strategies and addressing infrastructure limitations. The market will see a continued shift towards higher-capacity batteries as EV technology advances, demanding manufacturers adapt to meet these evolving needs and the need for sustainable recycling processes to minimize environmental impact.
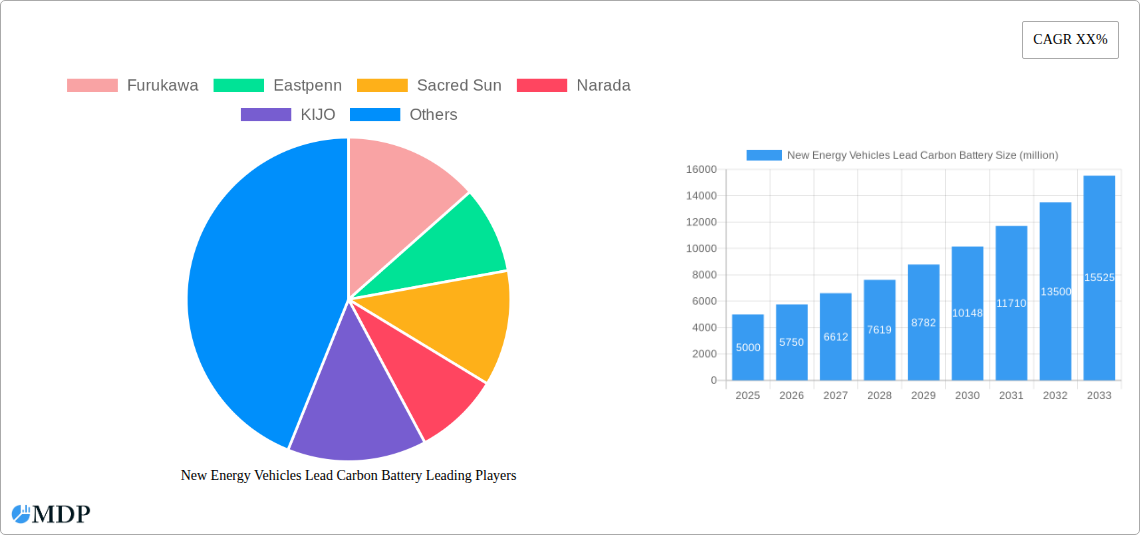
New Energy Vehicles Lead Carbon Battery Company Market Share
New Energy Vehicles Lead Carbon Battery Market Report: 2019-2033
Unlocking Growth Opportunities in the Booming New Energy Vehicle (NEV) Lead Carbon Battery Sector
This comprehensive report provides an in-depth analysis of the New Energy Vehicles Lead Carbon Battery market from 2019 to 2033, offering invaluable insights for stakeholders across the value chain. The study covers market dynamics, leading players, technological advancements, and future growth projections, leveraging extensive data analysis and expert insights. With a focus on key segments like Hybrid Electric Vehicles, Electric Bicycles, and various battery capacity ranges (Below 200 Ah, Between 200 and 800 Ah, Above 800 Ah), this report is essential for strategic decision-making and investment planning. The market is projected to reach xx million by 2033, exhibiting a significant CAGR.
New Energy Vehicles Lead Carbon Battery Market Dynamics & Concentration
This section analyzes the competitive landscape, identifying key trends impacting market concentration. The report examines innovation drivers such as advancements in battery chemistry and manufacturing processes, regulatory frameworks influencing battery standards and adoption rates, the emergence of substitute technologies (e.g., Lithium-ion), evolving end-user preferences towards longer lifespan and higher performance batteries, and significant M&A activities reshaping the industry structure. The analysis incorporates data on market share held by major players like Furukawa, Eastpenn, Sacred Sun, Narada, KIJO, Huafu Energy Storage, Axion, ShuangDeng, and China Tianneng. Metrics such as market share distribution and the number of M&A deals concluded during the study period (2019-2024) are included, providing a granular understanding of market concentration and competitive intensity. The estimated market share for 2025 for the top 3 players is approximately xx%. A total of xx M&A deals were recorded between 2019 and 2024.
New Energy Vehicles Lead Carbon Battery Industry Trends & Analysis
This section delves into the key factors driving market growth, including technological disruptions, shifts in consumer preferences towards greener transportation solutions, and the intensifying competitive landscape. The report provides a detailed analysis of the market's CAGR during the forecast period (2025-2033), along with an in-depth look at market penetration rates across different applications and geographical regions. The impact of government incentives, rising environmental concerns, and the increasing adoption of electric vehicles are thoroughly assessed. Technological innovations such as improved energy density, longer cycle life, and faster charging capabilities are examined in detail. Consumer preference shifts towards higher-performance, longer-lasting batteries are analyzed, outlining their influence on market demand. The competitive dynamics, including pricing strategies, product differentiation, and market expansion tactics employed by key players, are meticulously analyzed.
Leading Markets & Segments in New Energy Vehicles Lead Carbon Battery
This section identifies the dominant geographical regions and product segments within the NEV lead carbon battery market. The analysis focuses on the application segments – Hybrid Electric Vehicles, Electric Bicycles, and Others – as well as battery capacity segments – Below 200 Ah, Between 200 and 800 Ah, and Above 800 Ah.
- Key Drivers:
- Favorable government policies and subsidies promoting NEV adoption.
- Expanding charging infrastructure in key markets.
- Increasing affordability of electric vehicles.
- Growing consumer awareness of environmental concerns.
Detailed analysis reveals the dominance of [Specific Region/Country] in terms of market share and volume, with [Specific Segment - e.g., Hybrid Electric Vehicles or Between 200 and 800 Ah batteries] exhibiting the highest growth trajectory. This section provides a comprehensive breakdown of market dynamics in each segment and region, highlighting the specific factors contributing to their market leadership.
New Energy Vehicles Lead Carbon Battery Product Developments
Recent product innovations focus on enhancing energy density, extending cycle life, and improving safety features. These advancements are driven by the demand for improved performance and reliability in various applications. The competitive advantages offered by these new products are analyzed, emphasizing their suitability for specific market niches. Technological trends like advanced grid-level energy storage solutions for electric vehicles are also examined. This section also analyzes the adaptability of lead-carbon batteries across various applications, addressing their strengths and limitations compared to competing technologies.
Key Drivers of New Energy Vehicles Lead Carbon Battery Growth
Several factors contribute to the robust growth of the NEV lead carbon battery market. Technological advancements, such as improved energy density and cycle life, are significantly contributing to increased adoption. Government regulations and incentives promoting the use of electric vehicles are bolstering market growth. Furthermore, the increasing affordability of electric vehicles is making them accessible to a wider consumer base, further fueling demand for lead-carbon batteries.
Challenges in the New Energy Vehicles Lead Carbon Battery Market
The NEV lead carbon battery market faces challenges including regulatory hurdles related to environmental compliance and safety standards. Supply chain disruptions and fluctuations in raw material prices can impact production costs and market stability. Intense competition from alternative battery technologies, such as lithium-ion batteries, poses a significant challenge to market growth. These factors can influence market dynamics, pricing, and overall profitability. For example, xx million in potential revenue was lost due to supply chain disruptions in 2022.
Emerging Opportunities in New Energy Vehicles Lead Carbon Battery
Significant opportunities exist for market expansion through technological breakthroughs leading to improved battery performance and cost reduction. Strategic partnerships between battery manufacturers and electric vehicle producers can unlock new market segments. Market expansion into developing economies with burgeoning NEV markets offers significant potential for growth. These opportunities are likely to shape future market dynamics and accelerate the adoption of lead-carbon batteries.
Key Milestones in New Energy Vehicles Lead Carbon Battery Industry
- 2020: Introduction of a new lead-carbon battery technology with improved energy density by [Company Name].
- 2021: Significant investment in R&D for lead-carbon battery technology by [Company Name].
- 2022: Launch of a new line of high-capacity lead-carbon batteries for electric buses by [Company Name].
- 2023: Strategic partnership between [Company Name] and [Company Name] to develop next-generation lead-carbon batteries.
- 2024: Government regulations promoting the adoption of lead-carbon batteries in [Region/Country].
Strategic Outlook for New Energy Vehicles Lead Carbon Battery Market
The NEV lead carbon battery market is poised for sustained growth driven by technological advancements, government support, and increasing consumer adoption of electric vehicles. Strategic opportunities exist for companies to focus on product innovation, cost reduction, and strategic partnerships to enhance their market position. The market's long-term potential remains substantial, particularly in emerging economies and with continued technological progress.
New Energy Vehicles Lead Carbon Battery Segmentation
-
1. Application
- 1.1. Hybrid Electric Vehicles
- 1.2. Electric Bicycles
- 1.3. Others
-
2. Types
- 2.1. Below 200 Ah
- 2.2. Between 200 and 800 Ah
- 2.3. Above 800 Ah
New Energy Vehicles Lead Carbon Battery Segmentation By Geography
-
1. North America
- 1.1. United States
- 1.2. Canada
- 1.3. Mexico
-
2. South America
- 2.1. Brazil
- 2.2. Argentina
- 2.3. Rest of South America
-
3. Europe
- 3.1. United Kingdom
- 3.2. Germany
- 3.3. France
- 3.4. Italy
- 3.5. Spain
- 3.6. Russia
- 3.7. Benelux
- 3.8. Nordics
- 3.9. Rest of Europe
-
4. Middle East & Africa
- 4.1. Turkey
- 4.2. Israel
- 4.3. GCC
- 4.4. North Africa
- 4.5. South Africa
- 4.6. Rest of Middle East & Africa
-
5. Asia Pacific
- 5.1. China
- 5.2. India
- 5.3. Japan
- 5.4. South Korea
- 5.5. ASEAN
- 5.6. Oceania
- 5.7. Rest of Asia Pacific
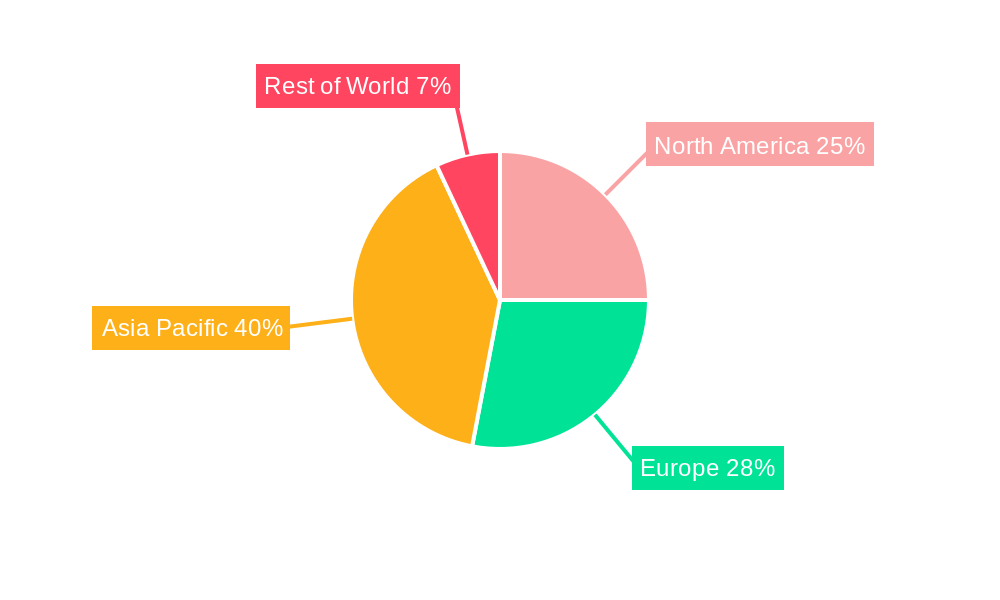
New Energy Vehicles Lead Carbon Battery Regional Market Share
Geographic Coverage of New Energy Vehicles Lead Carbon Battery
New Energy Vehicles Lead Carbon Battery REPORT HIGHLIGHTS
| Aspects | Details |
|---|---|
| Study Period | 2020-2034 |
| Base Year | 2025 |
| Estimated Year | 2026 |
| Forecast Period | 2026-2034 |
| Historical Period | 2020-2025 |
| Growth Rate | CAGR of 16.35% from 2020-2034 |
| Segmentation |
|
Table of Contents
- 1. Introduction
- 1.1. Research Scope
- 1.2. Market Segmentation
- 1.3. Research Methodology
- 1.4. Definitions and Assumptions
- 2. Executive Summary
- 2.1. Introduction
- 3. Market Dynamics
- 3.1. Introduction
- 3.2. Market Drivers
- 3.3. Market Restrains
- 3.4. Market Trends
- 4. Market Factor Analysis
- 4.1. Porters Five Forces
- 4.2. Supply/Value Chain
- 4.3. PESTEL analysis
- 4.4. Market Entropy
- 4.5. Patent/Trademark Analysis
- 5. Global New Energy Vehicles Lead Carbon Battery Analysis, Insights and Forecast, 2020-2032
- 5.1. Market Analysis, Insights and Forecast - by Application
- 5.1.1. Hybrid Electric Vehicles
- 5.1.2. Electric Bicycles
- 5.1.3. Others
- 5.2. Market Analysis, Insights and Forecast - by Types
- 5.2.1. Below 200 Ah
- 5.2.2. Between 200 and 800 Ah
- 5.2.3. Above 800 Ah
- 5.3. Market Analysis, Insights and Forecast - by Region
- 5.3.1. North America
- 5.3.2. South America
- 5.3.3. Europe
- 5.3.4. Middle East & Africa
- 5.3.5. Asia Pacific
- 5.1. Market Analysis, Insights and Forecast - by Application
- 6. North America New Energy Vehicles Lead Carbon Battery Analysis, Insights and Forecast, 2020-2032
- 6.1. Market Analysis, Insights and Forecast - by Application
- 6.1.1. Hybrid Electric Vehicles
- 6.1.2. Electric Bicycles
- 6.1.3. Others
- 6.2. Market Analysis, Insights and Forecast - by Types
- 6.2.1. Below 200 Ah
- 6.2.2. Between 200 and 800 Ah
- 6.2.3. Above 800 Ah
- 6.1. Market Analysis, Insights and Forecast - by Application
- 7. South America New Energy Vehicles Lead Carbon Battery Analysis, Insights and Forecast, 2020-2032
- 7.1. Market Analysis, Insights and Forecast - by Application
- 7.1.1. Hybrid Electric Vehicles
- 7.1.2. Electric Bicycles
- 7.1.3. Others
- 7.2. Market Analysis, Insights and Forecast - by Types
- 7.2.1. Below 200 Ah
- 7.2.2. Between 200 and 800 Ah
- 7.2.3. Above 800 Ah
- 7.1. Market Analysis, Insights and Forecast - by Application
- 8. Europe New Energy Vehicles Lead Carbon Battery Analysis, Insights and Forecast, 2020-2032
- 8.1. Market Analysis, Insights and Forecast - by Application
- 8.1.1. Hybrid Electric Vehicles
- 8.1.2. Electric Bicycles
- 8.1.3. Others
- 8.2. Market Analysis, Insights and Forecast - by Types
- 8.2.1. Below 200 Ah
- 8.2.2. Between 200 and 800 Ah
- 8.2.3. Above 800 Ah
- 8.1. Market Analysis, Insights and Forecast - by Application
- 9. Middle East & Africa New Energy Vehicles Lead Carbon Battery Analysis, Insights and Forecast, 2020-2032
- 9.1. Market Analysis, Insights and Forecast - by Application
- 9.1.1. Hybrid Electric Vehicles
- 9.1.2. Electric Bicycles
- 9.1.3. Others
- 9.2. Market Analysis, Insights and Forecast - by Types
- 9.2.1. Below 200 Ah
- 9.2.2. Between 200 and 800 Ah
- 9.2.3. Above 800 Ah
- 9.1. Market Analysis, Insights and Forecast - by Application
- 10. Asia Pacific New Energy Vehicles Lead Carbon Battery Analysis, Insights and Forecast, 2020-2032
- 10.1. Market Analysis, Insights and Forecast - by Application
- 10.1.1. Hybrid Electric Vehicles
- 10.1.2. Electric Bicycles
- 10.1.3. Others
- 10.2. Market Analysis, Insights and Forecast - by Types
- 10.2.1. Below 200 Ah
- 10.2.2. Between 200 and 800 Ah
- 10.2.3. Above 800 Ah
- 10.1. Market Analysis, Insights and Forecast - by Application
- 11. Competitive Analysis
- 11.1. Global Market Share Analysis 2025
- 11.2. Company Profiles
- 11.2.1 Furukawa
- 11.2.1.1. Overview
- 11.2.1.2. Products
- 11.2.1.3. SWOT Analysis
- 11.2.1.4. Recent Developments
- 11.2.1.5. Financials (Based on Availability)
- 11.2.2 Eastpenn
- 11.2.2.1. Overview
- 11.2.2.2. Products
- 11.2.2.3. SWOT Analysis
- 11.2.2.4. Recent Developments
- 11.2.2.5. Financials (Based on Availability)
- 11.2.3 Sacred Sun
- 11.2.3.1. Overview
- 11.2.3.2. Products
- 11.2.3.3. SWOT Analysis
- 11.2.3.4. Recent Developments
- 11.2.3.5. Financials (Based on Availability)
- 11.2.4 Narada
- 11.2.4.1. Overview
- 11.2.4.2. Products
- 11.2.4.3. SWOT Analysis
- 11.2.4.4. Recent Developments
- 11.2.4.5. Financials (Based on Availability)
- 11.2.5 KIJO
- 11.2.5.1. Overview
- 11.2.5.2. Products
- 11.2.5.3. SWOT Analysis
- 11.2.5.4. Recent Developments
- 11.2.5.5. Financials (Based on Availability)
- 11.2.6 Huafu Energy Storage
- 11.2.6.1. Overview
- 11.2.6.2. Products
- 11.2.6.3. SWOT Analysis
- 11.2.6.4. Recent Developments
- 11.2.6.5. Financials (Based on Availability)
- 11.2.7 Axion
- 11.2.7.1. Overview
- 11.2.7.2. Products
- 11.2.7.3. SWOT Analysis
- 11.2.7.4. Recent Developments
- 11.2.7.5. Financials (Based on Availability)
- 11.2.8 ShuangDeng
- 11.2.8.1. Overview
- 11.2.8.2. Products
- 11.2.8.3. SWOT Analysis
- 11.2.8.4. Recent Developments
- 11.2.8.5. Financials (Based on Availability)
- 11.2.9 China Tianneng
- 11.2.9.1. Overview
- 11.2.9.2. Products
- 11.2.9.3. SWOT Analysis
- 11.2.9.4. Recent Developments
- 11.2.9.5. Financials (Based on Availability)
- 11.2.1 Furukawa
List of Figures
- Figure 1: Global New Energy Vehicles Lead Carbon Battery Revenue Breakdown (undefined, %) by Region 2025 & 2033
- Figure 2: North America New Energy Vehicles Lead Carbon Battery Revenue (undefined), by Application 2025 & 2033
- Figure 3: North America New Energy Vehicles Lead Carbon Battery Revenue Share (%), by Application 2025 & 2033
- Figure 4: North America New Energy Vehicles Lead Carbon Battery Revenue (undefined), by Types 2025 & 2033
- Figure 5: North America New Energy Vehicles Lead Carbon Battery Revenue Share (%), by Types 2025 & 2033
- Figure 6: North America New Energy Vehicles Lead Carbon Battery Revenue (undefined), by Country 2025 & 2033
- Figure 7: North America New Energy Vehicles Lead Carbon Battery Revenue Share (%), by Country 2025 & 2033
- Figure 8: South America New Energy Vehicles Lead Carbon Battery Revenue (undefined), by Application 2025 & 2033
- Figure 9: South America New Energy Vehicles Lead Carbon Battery Revenue Share (%), by Application 2025 & 2033
- Figure 10: South America New Energy Vehicles Lead Carbon Battery Revenue (undefined), by Types 2025 & 2033
- Figure 11: South America New Energy Vehicles Lead Carbon Battery Revenue Share (%), by Types 2025 & 2033
- Figure 12: South America New Energy Vehicles Lead Carbon Battery Revenue (undefined), by Country 2025 & 2033
- Figure 13: South America New Energy Vehicles Lead Carbon Battery Revenue Share (%), by Country 2025 & 2033
- Figure 14: Europe New Energy Vehicles Lead Carbon Battery Revenue (undefined), by Application 2025 & 2033
- Figure 15: Europe New Energy Vehicles Lead Carbon Battery Revenue Share (%), by Application 2025 & 2033
- Figure 16: Europe New Energy Vehicles Lead Carbon Battery Revenue (undefined), by Types 2025 & 2033
- Figure 17: Europe New Energy Vehicles Lead Carbon Battery Revenue Share (%), by Types 2025 & 2033
- Figure 18: Europe New Energy Vehicles Lead Carbon Battery Revenue (undefined), by Country 2025 & 2033
- Figure 19: Europe New Energy Vehicles Lead Carbon Battery Revenue Share (%), by Country 2025 & 2033
- Figure 20: Middle East & Africa New Energy Vehicles Lead Carbon Battery Revenue (undefined), by Application 2025 & 2033
- Figure 21: Middle East & Africa New Energy Vehicles Lead Carbon Battery Revenue Share (%), by Application 2025 & 2033
- Figure 22: Middle East & Africa New Energy Vehicles Lead Carbon Battery Revenue (undefined), by Types 2025 & 2033
- Figure 23: Middle East & Africa New Energy Vehicles Lead Carbon Battery Revenue Share (%), by Types 2025 & 2033
- Figure 24: Middle East & Africa New Energy Vehicles Lead Carbon Battery Revenue (undefined), by Country 2025 & 2033
- Figure 25: Middle East & Africa New Energy Vehicles Lead Carbon Battery Revenue Share (%), by Country 2025 & 2033
- Figure 26: Asia Pacific New Energy Vehicles Lead Carbon Battery Revenue (undefined), by Application 2025 & 2033
- Figure 27: Asia Pacific New Energy Vehicles Lead Carbon Battery Revenue Share (%), by Application 2025 & 2033
- Figure 28: Asia Pacific New Energy Vehicles Lead Carbon Battery Revenue (undefined), by Types 2025 & 2033
- Figure 29: Asia Pacific New Energy Vehicles Lead Carbon Battery Revenue Share (%), by Types 2025 & 2033
- Figure 30: Asia Pacific New Energy Vehicles Lead Carbon Battery Revenue (undefined), by Country 2025 & 2033
- Figure 31: Asia Pacific New Energy Vehicles Lead Carbon Battery Revenue Share (%), by Country 2025 & 2033
List of Tables
- Table 1: Global New Energy Vehicles Lead Carbon Battery Revenue undefined Forecast, by Application 2020 & 2033
- Table 2: Global New Energy Vehicles Lead Carbon Battery Revenue undefined Forecast, by Types 2020 & 2033
- Table 3: Global New Energy Vehicles Lead Carbon Battery Revenue undefined Forecast, by Region 2020 & 2033
- Table 4: Global New Energy Vehicles Lead Carbon Battery Revenue undefined Forecast, by Application 2020 & 2033
- Table 5: Global New Energy Vehicles Lead Carbon Battery Revenue undefined Forecast, by Types 2020 & 2033
- Table 6: Global New Energy Vehicles Lead Carbon Battery Revenue undefined Forecast, by Country 2020 & 2033
- Table 7: United States New Energy Vehicles Lead Carbon Battery Revenue (undefined) Forecast, by Application 2020 & 2033
- Table 8: Canada New Energy Vehicles Lead Carbon Battery Revenue (undefined) Forecast, by Application 2020 & 2033
- Table 9: Mexico New Energy Vehicles Lead Carbon Battery Revenue (undefined) Forecast, by Application 2020 & 2033
- Table 10: Global New Energy Vehicles Lead Carbon Battery Revenue undefined Forecast, by Application 2020 & 2033
- Table 11: Global New Energy Vehicles Lead Carbon Battery Revenue undefined Forecast, by Types 2020 & 2033
- Table 12: Global New Energy Vehicles Lead Carbon Battery Revenue undefined Forecast, by Country 2020 & 2033
- Table 13: Brazil New Energy Vehicles Lead Carbon Battery Revenue (undefined) Forecast, by Application 2020 & 2033
- Table 14: Argentina New Energy Vehicles Lead Carbon Battery Revenue (undefined) Forecast, by Application 2020 & 2033
- Table 15: Rest of South America New Energy Vehicles Lead Carbon Battery Revenue (undefined) Forecast, by Application 2020 & 2033
- Table 16: Global New Energy Vehicles Lead Carbon Battery Revenue undefined Forecast, by Application 2020 & 2033
- Table 17: Global New Energy Vehicles Lead Carbon Battery Revenue undefined Forecast, by Types 2020 & 2033
- Table 18: Global New Energy Vehicles Lead Carbon Battery Revenue undefined Forecast, by Country 2020 & 2033
- Table 19: United Kingdom New Energy Vehicles Lead Carbon Battery Revenue (undefined) Forecast, by Application 2020 & 2033
- Table 20: Germany New Energy Vehicles Lead Carbon Battery Revenue (undefined) Forecast, by Application 2020 & 2033
- Table 21: France New Energy Vehicles Lead Carbon Battery Revenue (undefined) Forecast, by Application 2020 & 2033
- Table 22: Italy New Energy Vehicles Lead Carbon Battery Revenue (undefined) Forecast, by Application 2020 & 2033
- Table 23: Spain New Energy Vehicles Lead Carbon Battery Revenue (undefined) Forecast, by Application 2020 & 2033
- Table 24: Russia New Energy Vehicles Lead Carbon Battery Revenue (undefined) Forecast, by Application 2020 & 2033
- Table 25: Benelux New Energy Vehicles Lead Carbon Battery Revenue (undefined) Forecast, by Application 2020 & 2033
- Table 26: Nordics New Energy Vehicles Lead Carbon Battery Revenue (undefined) Forecast, by Application 2020 & 2033
- Table 27: Rest of Europe New Energy Vehicles Lead Carbon Battery Revenue (undefined) Forecast, by Application 2020 & 2033
- Table 28: Global New Energy Vehicles Lead Carbon Battery Revenue undefined Forecast, by Application 2020 & 2033
- Table 29: Global New Energy Vehicles Lead Carbon Battery Revenue undefined Forecast, by Types 2020 & 2033
- Table 30: Global New Energy Vehicles Lead Carbon Battery Revenue undefined Forecast, by Country 2020 & 2033
- Table 31: Turkey New Energy Vehicles Lead Carbon Battery Revenue (undefined) Forecast, by Application 2020 & 2033
- Table 32: Israel New Energy Vehicles Lead Carbon Battery Revenue (undefined) Forecast, by Application 2020 & 2033
- Table 33: GCC New Energy Vehicles Lead Carbon Battery Revenue (undefined) Forecast, by Application 2020 & 2033
- Table 34: North Africa New Energy Vehicles Lead Carbon Battery Revenue (undefined) Forecast, by Application 2020 & 2033
- Table 35: South Africa New Energy Vehicles Lead Carbon Battery Revenue (undefined) Forecast, by Application 2020 & 2033
- Table 36: Rest of Middle East & Africa New Energy Vehicles Lead Carbon Battery Revenue (undefined) Forecast, by Application 2020 & 2033
- Table 37: Global New Energy Vehicles Lead Carbon Battery Revenue undefined Forecast, by Application 2020 & 2033
- Table 38: Global New Energy Vehicles Lead Carbon Battery Revenue undefined Forecast, by Types 2020 & 2033
- Table 39: Global New Energy Vehicles Lead Carbon Battery Revenue undefined Forecast, by Country 2020 & 2033
- Table 40: China New Energy Vehicles Lead Carbon Battery Revenue (undefined) Forecast, by Application 2020 & 2033
- Table 41: India New Energy Vehicles Lead Carbon Battery Revenue (undefined) Forecast, by Application 2020 & 2033
- Table 42: Japan New Energy Vehicles Lead Carbon Battery Revenue (undefined) Forecast, by Application 2020 & 2033
- Table 43: South Korea New Energy Vehicles Lead Carbon Battery Revenue (undefined) Forecast, by Application 2020 & 2033
- Table 44: ASEAN New Energy Vehicles Lead Carbon Battery Revenue (undefined) Forecast, by Application 2020 & 2033
- Table 45: Oceania New Energy Vehicles Lead Carbon Battery Revenue (undefined) Forecast, by Application 2020 & 2033
- Table 46: Rest of Asia Pacific New Energy Vehicles Lead Carbon Battery Revenue (undefined) Forecast, by Application 2020 & 2033
Frequently Asked Questions
1. What is the projected Compound Annual Growth Rate (CAGR) of the New Energy Vehicles Lead Carbon Battery?
The projected CAGR is approximately 16.35%.
2. Which companies are prominent players in the New Energy Vehicles Lead Carbon Battery?
Key companies in the market include Furukawa, Eastpenn, Sacred Sun, Narada, KIJO, Huafu Energy Storage, Axion, ShuangDeng, China Tianneng.
3. What are the main segments of the New Energy Vehicles Lead Carbon Battery?
The market segments include Application, Types.
4. Can you provide details about the market size?
The market size is estimated to be USD XXX N/A as of 2022.
5. What are some drivers contributing to market growth?
N/A
6. What are the notable trends driving market growth?
N/A
7. Are there any restraints impacting market growth?
N/A
8. Can you provide examples of recent developments in the market?
N/A
9. What pricing options are available for accessing the report?
Pricing options include single-user, multi-user, and enterprise licenses priced at USD 4900.00, USD 7350.00, and USD 9800.00 respectively.
10. Is the market size provided in terms of value or volume?
The market size is provided in terms of value, measured in N/A.
11. Are there any specific market keywords associated with the report?
Yes, the market keyword associated with the report is "New Energy Vehicles Lead Carbon Battery," which aids in identifying and referencing the specific market segment covered.
12. How do I determine which pricing option suits my needs best?
The pricing options vary based on user requirements and access needs. Individual users may opt for single-user licenses, while businesses requiring broader access may choose multi-user or enterprise licenses for cost-effective access to the report.
13. Are there any additional resources or data provided in the New Energy Vehicles Lead Carbon Battery report?
While the report offers comprehensive insights, it's advisable to review the specific contents or supplementary materials provided to ascertain if additional resources or data are available.
14. How can I stay updated on further developments or reports in the New Energy Vehicles Lead Carbon Battery?
To stay informed about further developments, trends, and reports in the New Energy Vehicles Lead Carbon Battery, consider subscribing to industry newsletters, following relevant companies and organizations, or regularly checking reputable industry news sources and publications.
Methodology
Step 1 - Identification of Relevant Samples Size from Population Database


Step 2 - Approaches for Defining Global Market Size (Value, Volume* & Price*)

Note*: In applicable scenarios
Step 3 - Data Sources
Primary Research
- Web Analytics
- Survey Reports
- Research Institute
- Latest Research Reports
- Opinion Leaders
Secondary Research
- Annual Reports
- White Paper
- Latest Press Release
- Industry Association
- Paid Database
- Investor Presentations

Step 4 - Data Triangulation
Involves using different sources of information in order to increase the validity of a study
These sources are likely to be stakeholders in a program - participants, other researchers, program staff, other community members, and so on.
Then we put all data in single framework & apply various statistical tools to find out the dynamic on the market.
During the analysis stage, feedback from the stakeholder groups would be compared to determine areas of agreement as well as areas of divergence