

Key Insights
The B2B enterprise and industrial wearables market is experiencing robust growth, driven by the increasing need for enhanced worker safety, improved operational efficiency, and real-time data acquisition across various industries. The market's Compound Annual Growth Rate (CAGR) of 28.20% from 2019-2024 indicates significant expansion. This growth is fueled by several factors, including the rising adoption of smart glasses for hands-free operations in manufacturing and logistics, the integration of wearable sensors for predictive maintenance in industrial settings, and the increasing demand for real-time health monitoring solutions in hazardous environments. Key segments driving this growth include Head-Mounted Displays (HMDs) and smartwatches, used for data visualization and communication, and wearable sensors for monitoring vital signs and environmental conditions. Industries like healthcare, manufacturing, and logistics are early adopters, leveraging wearables for streamlining workflows, enhancing productivity, and improving worker safety. The market is witnessing the emergence of sophisticated, interconnected wearable solutions capable of analyzing vast amounts of data, leading to more informed decision-making.
The future of the B2B enterprise and industrial wearables market is bright, with projected continued strong growth through 2033. However, challenges remain. High initial investment costs for implementation and the need for robust data security and privacy protocols could hinder widespread adoption. Furthermore, ensuring seamless integration with existing enterprise systems and addressing concerns about worker comfort and usability are crucial for sustained growth. The competitive landscape is dynamic, with established tech giants and specialized startups vying for market share. This competition will likely accelerate innovation, leading to more advanced and affordable wearables solutions that further expand the market's reach across diverse industries and applications. Strategic partnerships between technology providers and industry leaders are likely to become increasingly important in driving adoption and shaping future market trends.
B2B Enterprise & Industrial Wearables Market Report: 2019-2033
This comprehensive report provides a detailed analysis of the B2B Enterprise & Industrial Wearables market, projecting a multi-million dollar valuation by 2033. We delve into market dynamics, growth drivers, leading players, and emerging opportunities, offering actionable insights for stakeholders across the industry. The study covers the period 2019-2033, with a base year of 2025 and a forecast period of 2025-2033. This report is essential for businesses involved in HMDs, wrist wearables (smartwatches and fitness bands), enterprise smart glasses, smart clothing, wearable cameras, and other innovative devices across diverse sectors like IT, healthcare, manufacturing, and retail.
B2B Enterprise & Industrial Wearables Industry Market Dynamics & Concentration
The B2B Enterprise & Industrial Wearables market is experiencing robust and sustained growth, propelled by relentless technological advancements and an accelerating adoption curve across a diverse spectrum of industries. The market exhibits a moderate to moderately concentrated structure, characterized by the presence of established key players who command substantial market share, while simultaneously offering fertile ground for agile, smaller innovators to carve out significant niches. This dynamic environment is a hotbed of continuous innovation, particularly in the realms of advanced sensor technology, sophisticated data analytics, and ubiquitous connectivity, continuously pushing the boundaries of what's achievable with wearable technology. Evolving regulatory frameworks, with a particular emphasis on data privacy and robust security protocols, are significantly shaping market dynamics and influencing strategic decision-making. The phenomenon of product substitution is primarily driven by the demonstrable superiority in functionality and the increasing cost-effectiveness offered by newer technological iterations. End-user trends underscore a pronounced preference for devices that facilitate seamless integration into existing enterprise workflows, coupled with an intuitive and enhanced user experience. The Mergers & Acquisitions (M&A) landscape is increasingly active, signifying a trend towards market consolidation and strategic expansion. In 2024, the industry saw approximately [Insert specific number] M&A deals, underscoring a vibrant and rapidly evolving market structure. Leading global technology giants such as Apple, Samsung, and Google continue to hold significant market influence. (Estimates for 2024: Apple - [Insert specific percentage]%, Samsung - [Insert specific percentage]%, Google - [Insert specific percentage]%).
B2B Enterprise & Industrial Wearables Industry Industry Trends & Analysis
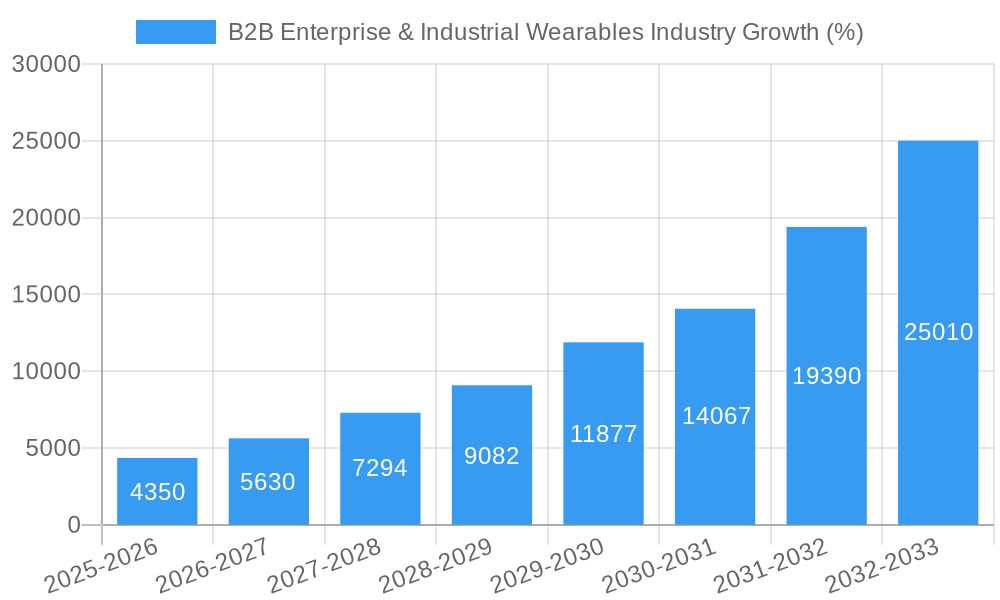
The B2B Enterprise & Industrial Wearables market is witnessing a Compound Annual Growth Rate (CAGR) of xx% during the forecast period (2025-2033). This growth is fueled by several key factors: increasing demand for enhanced workplace safety, improved operational efficiency, and the rise of remote monitoring solutions. Technological disruptions, such as the development of advanced sensors and AI-powered analytics, are revolutionizing the capabilities of wearable devices. Consumer preferences are shifting towards comfortable, durable, and aesthetically pleasing devices with robust functionalities and seamless data integration. The competitive dynamics are marked by intense innovation and the emergence of niche players targeting specific industry needs. Market penetration for wearable technology in the enterprise sector is currently at approximately xx% and is projected to reach xx% by 2033. This signifies significant untapped potential for growth.
Leading Markets & Segments in B2B Enterprise & Industrial Wearables Industry
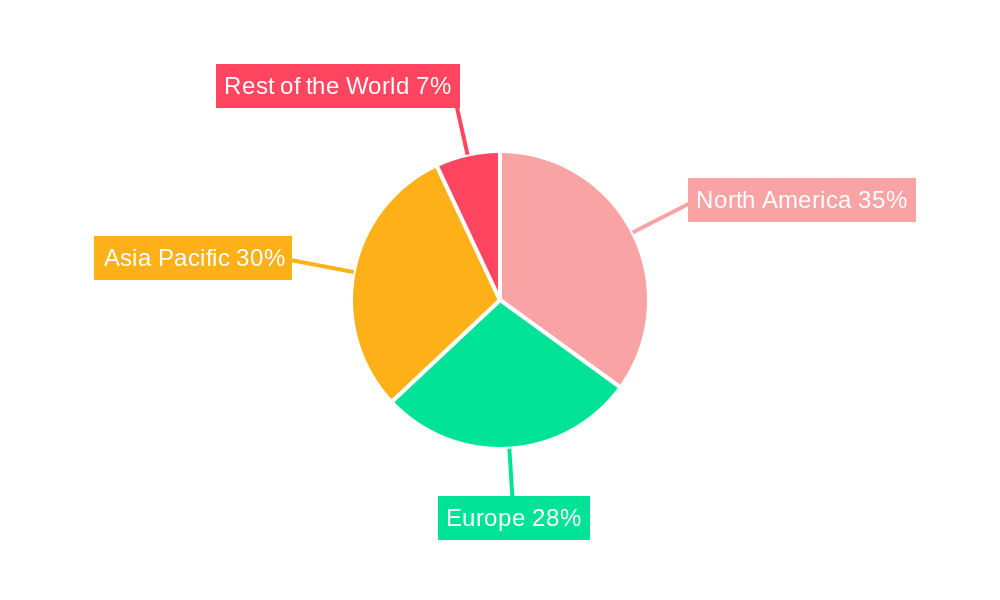
The North American region dominates the B2B Enterprise & Industrial Wearables market, driven by high technological adoption, robust economic conditions, and well-established supply chains. Within device types, wrist wearables (smartwatches and fitness bands) currently hold the largest market share, followed by enterprise smart glasses.
Key Drivers by Region:
- North America: Strong technological infrastructure, high disposable income, and early adoption of new technologies.
- Europe: Growing focus on workplace safety and efficiency in industries like manufacturing and healthcare.
- Asia-Pacific: Rapid industrialization, expanding tech-savvy workforce, and increasing government support for technological advancement.
Dominant Segments:
- By Device Type: Wrist wearables are leading due to their versatility and ease of use. Enterprise smart glasses are experiencing rapid growth due to their applications in field service and manufacturing.
- By End-user Industry: The manufacturing and healthcare sectors are key adopters, driven by the need for enhanced safety and productivity. The IT and Telecom sectors are also significant consumers, using wearables for improved communication and data access.
B2B Enterprise & Industrial Wearables Industry Product Developments
Recent product developments are keenly focused on achieving greater miniaturization, extending battery life to unprecedented levels, enhancing the precision and scope of sensor capabilities, and ensuring flawless integration with existing enterprise systems. Novel applications are rapidly emerging, demonstrating immense potential in critical areas such as predictive maintenance to avert costly downtime, remote patient monitoring for improved healthcare outcomes, and immersive augmented reality training simulations for enhanced workforce skill development. Competitive advantages are increasingly being forged through superior data analytics prowess, the development of highly intuitive and user-friendly interfaces, and the implementation of uncompromised security features. The overarching technological trend towards AI-powered predictive insights and the burgeoning field of edge computing are fundamentally reshaping the market, leading to the creation of smarter, more adaptable, and highly responsive wearable devices that are exceptionally well-suited to meet the demanding requirements of diverse enterprise environments.
Key Drivers of B2B Enterprise & Industrial Wearables Industry Growth
Several factors drive growth in the B2B enterprise and industrial wearables market:
- Technological advancements: Improved sensor technology, advanced data analytics, and more powerful processors are expanding the capabilities of wearable devices.
- Economic factors: Increased productivity and reduced operational costs are key incentives for businesses to adopt wearable technology.
- Regulatory support: Government initiatives promoting industrial automation and workplace safety are stimulating demand for wearable solutions.
Challenges in the B2B Enterprise & Industrial Wearables Industry Market
The B2B Enterprise & Industrial Wearables market is navigating a complex landscape of significant challenges, including:
- Substantial Initial Investment Requirements: The implementation of advanced wearable technologies necessitates considerable upfront capital investment from businesses, encompassing hardware acquisition, sophisticated software solutions, and comprehensive user training programs.
- Pervasive Data Privacy and Security Apprehensions: Safeguarding sensitive employee and operational data is paramount. This imperative demands the deployment of exceptionally robust and multi-layered security measures to mitigate risks effectively.
- Complex Interoperability Hurdles: Achieving seamless integration with an organization's existing IT infrastructure is a critical determinant of successful adoption. However, this can present significant technical complexities, potentially impacting adoption rates by approximately [Insert specific percentage]% annually.
Emerging Opportunities in B2B Enterprise & Industrial Wearables Industry
The long-term growth trajectory of this sector is being powerfully fueled by groundbreaking technological advancements, most notably in the development of flexible sensors and innovative energy harvesting technologies. Strategic collaborations and partnerships between pioneering technology providers and established industry leaders are instrumental in co-creating highly specialized and innovative solutions meticulously tailored to address specific enterprise needs. Furthermore, the expansion into untapped new markets, particularly within rapidly developing economies, presents a significant and largely unexploited potential for substantial growth in the B2B enterprise and industrial wearables sector.
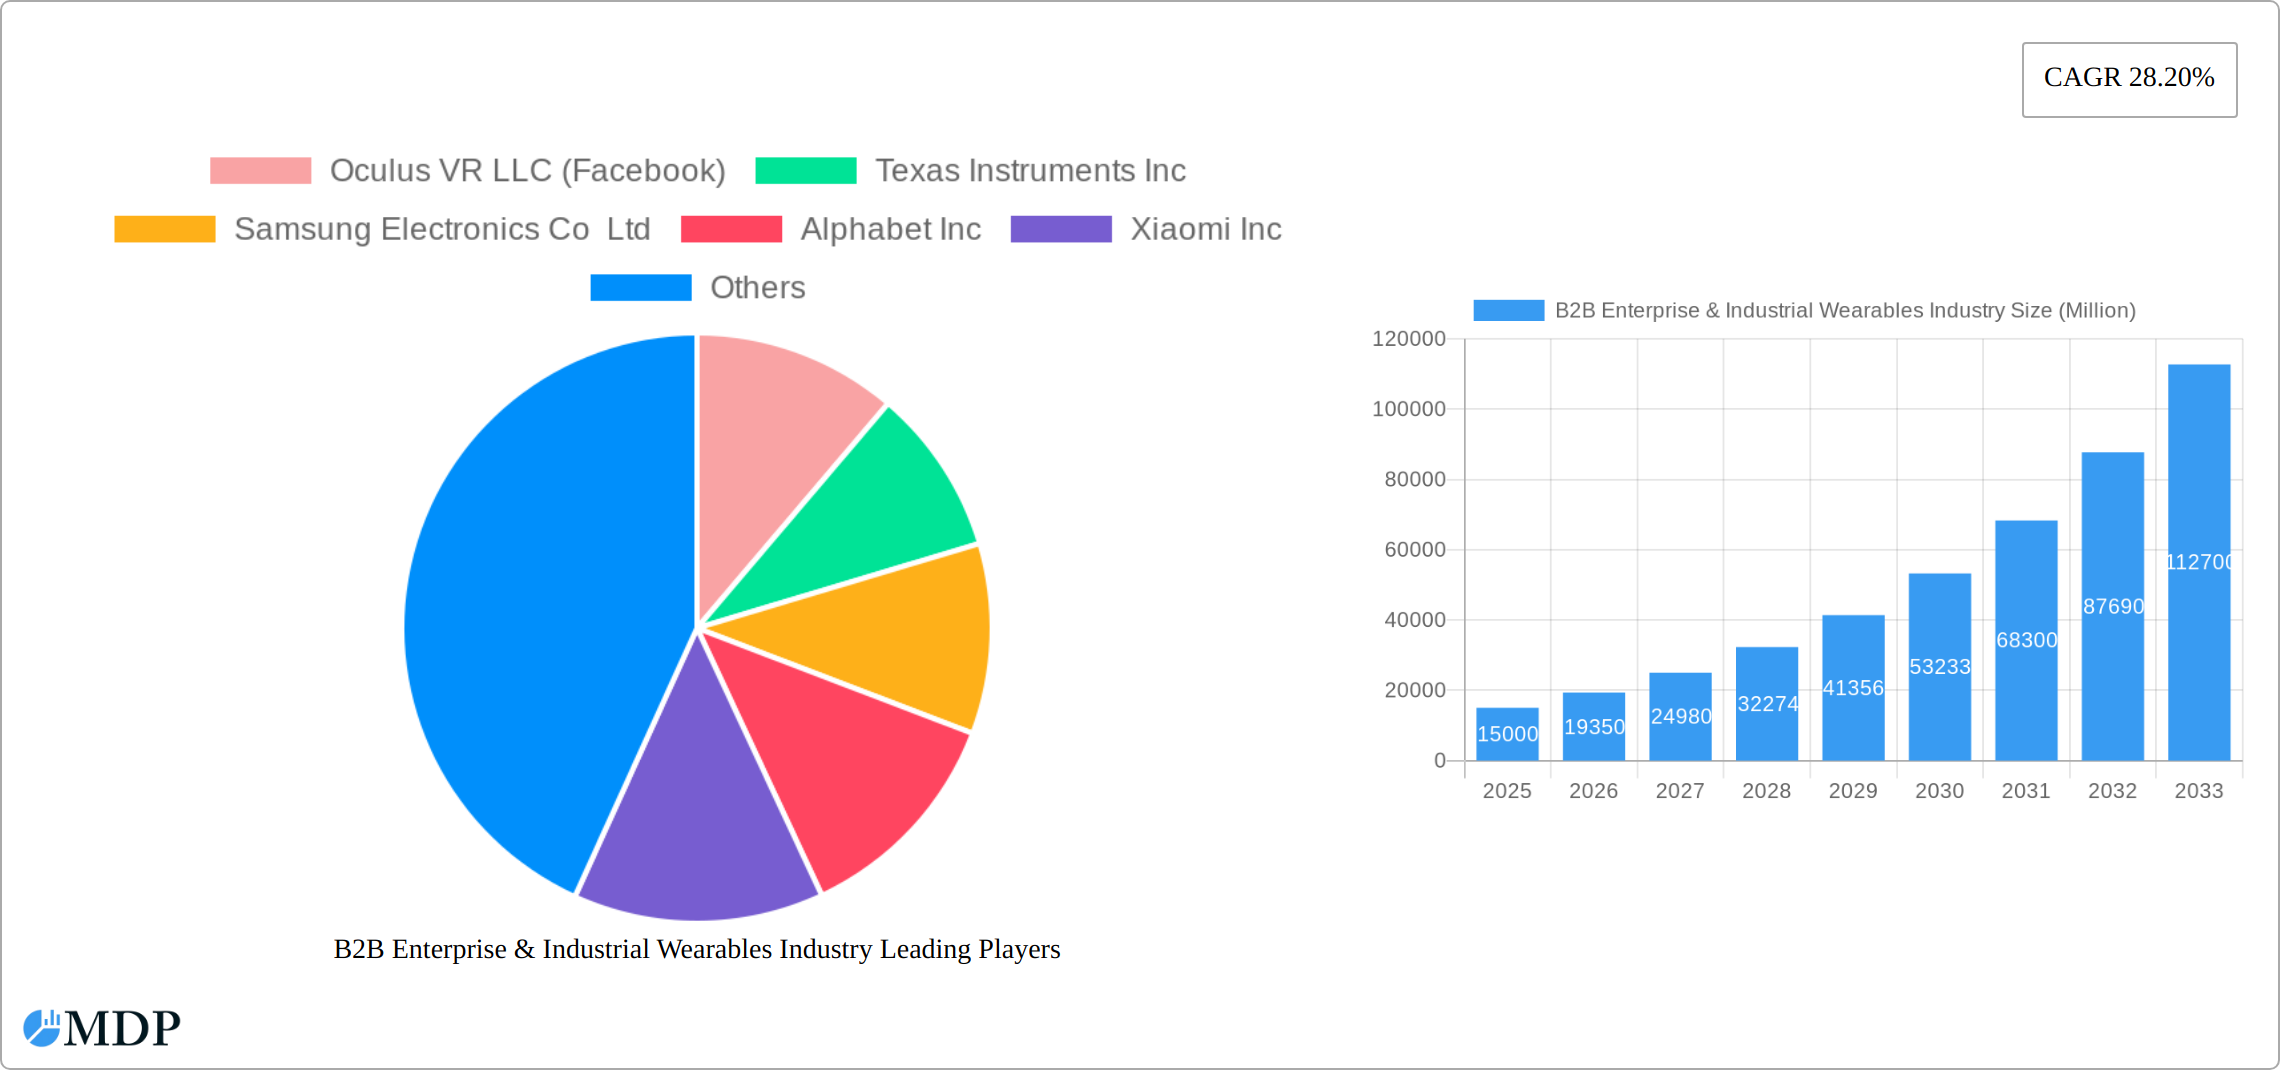
Leading Players in the B2B Enterprise & Industrial Wearables Industry Sector
- Oculus VR LLC (Facebook)
- Texas Instruments Inc
- Samsung Electronics Co Ltd
- Alphabet Inc
- Xiaomi Inc
- Microsoft Corporation
- Toshiba Corporation
- Seiko Epson Corporation
- Fitbit Inc
- Apple Inc
- HTC Corporation
- Sony Corporation
Key Milestones in B2B Enterprise & Industrial Wearables Industry Industry
- September 2022: Amazfit partnered with Adidas Runtastic to enhance workout tracking and sharing using advanced biometric sensor technology. This boosted the market's focus on health and fitness applications.
- June 2022: Mensa Brands acquired Pebble, an Indian smart wearable brand, expanding its reach in the Indian market and highlighting the ongoing consolidation in the industry.
Strategic Outlook for B2B Enterprise & Industrial Wearables Industry Market
The future outlook for the B2B Enterprise & Industrial Wearables market is exceptionally promising, propelled by continuous technological innovation and a growing industry-wide recognition of the profound value proposition offered by wearable technologies. Strategic alliances, targeted expansion into high-potential niche markets, and an unwavering commitment to robust data security will be indispensable pillars for sustained success. The market is projected to experience sustained and accelerated growth, driven by the increasing adoption of sophisticated functionalities and the strategic penetration into new and diverse industry verticals. A steadfast focus on developing user-centric, intuitive, and exceptionally robust solutions will be key to driving deeper and more widespread adoption within the enterprise sector.
B2B Enterprise & Industrial Wearables Industry Segmentation
-
1. Device Type
- 1.1. HMDs
- 1.2. Wrist Wears (Smart Watch and Fitness Bands)
- 1.3. Enterprise Smart Glass
- 1.4. Smart Clothing and Body Sensors
- 1.5. Wearable Cameras
- 1.6. Other Device Types
-
2. End-user Industry
- 2.1. IT and Telecom
- 2.2. Healthcare
- 2.3. Retail
- 2.4. Insurance
- 2.5. Manufacturing
- 2.6. Other End-user Industries
B2B Enterprise & Industrial Wearables Industry Segmentation By Geography
- 1. North America
- 2. Europe
- 3. Asia Pacific
- 4. Rest of the World
B2B Enterprise & Industrial Wearables Industry REPORT HIGHLIGHTS
| Aspects | Details |
|---|---|
| Study Period | 2019-2033 |
| Base Year | 2024 |
| Estimated Year | 2025 |
| Forecast Period | 2025-2033 |
| Historical Period | 2019-2024 |
| Growth Rate | CAGR of 28.20% from 2019-2033 |
| Segmentation |
|
Table of Contents
- 1. Introduction
- 1.1. Research Scope
- 1.2. Market Segmentation
- 1.3. Research Methodology
- 1.4. Definitions and Assumptions
- 2. Executive Summary
- 2.1. Introduction
- 3. Market Dynamics
- 3.1. Introduction
- 3.2. Market Drivers
- 3.2.1. Growing App Ecosystem Will Fuel Enterprise Adoption; Demand for Smart Factory Setups are Expected to Aid Growth of Wearables
- 3.3. Market Restrains
- 3.3.1. Lack of Business Applications is a Primary Challenge in Deploying Wearables; Perennial Concerns about Data Security and Existing Tech Integration Issues
- 3.4. Market Trends
- 3.4.1. Demand for Smart Factory Setups are Expected to Aid Growth of Wearables
- 4. Market Factor Analysis
- 4.1. Porters Five Forces
- 4.2. Supply/Value Chain
- 4.3. PESTEL analysis
- 4.4. Market Entropy
- 4.5. Patent/Trademark Analysis
- 5. Global B2B Enterprise & Industrial Wearables Industry Analysis, Insights and Forecast, 2019-2031
- 5.1. Market Analysis, Insights and Forecast - by Device Type
- 5.1.1. HMDs
- 5.1.2. Wrist Wears (Smart Watch and Fitness Bands)
- 5.1.3. Enterprise Smart Glass
- 5.1.4. Smart Clothing and Body Sensors
- 5.1.5. Wearable Cameras
- 5.1.6. Other Device Types
- 5.2. Market Analysis, Insights and Forecast - by End-user Industry
- 5.2.1. IT and Telecom
- 5.2.2. Healthcare
- 5.2.3. Retail
- 5.2.4. Insurance
- 5.2.5. Manufacturing
- 5.2.6. Other End-user Industries
- 5.3. Market Analysis, Insights and Forecast - by Region
- 5.3.1. North America
- 5.3.2. Europe
- 5.3.3. Asia Pacific
- 5.3.4. Rest of the World
- 5.1. Market Analysis, Insights and Forecast - by Device Type
- 6. North America B2B Enterprise & Industrial Wearables Industry Analysis, Insights and Forecast, 2019-2031
- 6.1. Market Analysis, Insights and Forecast - by Device Type
- 6.1.1. HMDs
- 6.1.2. Wrist Wears (Smart Watch and Fitness Bands)
- 6.1.3. Enterprise Smart Glass
- 6.1.4. Smart Clothing and Body Sensors
- 6.1.5. Wearable Cameras
- 6.1.6. Other Device Types
- 6.2. Market Analysis, Insights and Forecast - by End-user Industry
- 6.2.1. IT and Telecom
- 6.2.2. Healthcare
- 6.2.3. Retail
- 6.2.4. Insurance
- 6.2.5. Manufacturing
- 6.2.6. Other End-user Industries
- 6.1. Market Analysis, Insights and Forecast - by Device Type
- 7. Europe B2B Enterprise & Industrial Wearables Industry Analysis, Insights and Forecast, 2019-2031
- 7.1. Market Analysis, Insights and Forecast - by Device Type
- 7.1.1. HMDs
- 7.1.2. Wrist Wears (Smart Watch and Fitness Bands)
- 7.1.3. Enterprise Smart Glass
- 7.1.4. Smart Clothing and Body Sensors
- 7.1.5. Wearable Cameras
- 7.1.6. Other Device Types
- 7.2. Market Analysis, Insights and Forecast - by End-user Industry
- 7.2.1. IT and Telecom
- 7.2.2. Healthcare
- 7.2.3. Retail
- 7.2.4. Insurance
- 7.2.5. Manufacturing
- 7.2.6. Other End-user Industries
- 7.1. Market Analysis, Insights and Forecast - by Device Type
- 8. Asia Pacific B2B Enterprise & Industrial Wearables Industry Analysis, Insights and Forecast, 2019-2031
- 8.1. Market Analysis, Insights and Forecast - by Device Type
- 8.1.1. HMDs
- 8.1.2. Wrist Wears (Smart Watch and Fitness Bands)
- 8.1.3. Enterprise Smart Glass
- 8.1.4. Smart Clothing and Body Sensors
- 8.1.5. Wearable Cameras
- 8.1.6. Other Device Types
- 8.2. Market Analysis, Insights and Forecast - by End-user Industry
- 8.2.1. IT and Telecom
- 8.2.2. Healthcare
- 8.2.3. Retail
- 8.2.4. Insurance
- 8.2.5. Manufacturing
- 8.2.6. Other End-user Industries
- 8.1. Market Analysis, Insights and Forecast - by Device Type
- 9. Rest of the World B2B Enterprise & Industrial Wearables Industry Analysis, Insights and Forecast, 2019-2031
- 9.1. Market Analysis, Insights and Forecast - by Device Type
- 9.1.1. HMDs
- 9.1.2. Wrist Wears (Smart Watch and Fitness Bands)
- 9.1.3. Enterprise Smart Glass
- 9.1.4. Smart Clothing and Body Sensors
- 9.1.5. Wearable Cameras
- 9.1.6. Other Device Types
- 9.2. Market Analysis, Insights and Forecast - by End-user Industry
- 9.2.1. IT and Telecom
- 9.2.2. Healthcare
- 9.2.3. Retail
- 9.2.4. Insurance
- 9.2.5. Manufacturing
- 9.2.6. Other End-user Industries
- 9.1. Market Analysis, Insights and Forecast - by Device Type
- 10. North America B2B Enterprise & Industrial Wearables Industry Analysis, Insights and Forecast, 2019-2031
- 10.1. Market Analysis, Insights and Forecast - By Country/Sub-region
- 10.1.1.
- 11. Europe B2B Enterprise & Industrial Wearables Industry Analysis, Insights and Forecast, 2019-2031
- 11.1. Market Analysis, Insights and Forecast - By Country/Sub-region
- 11.1.1.
- 12. Asia Pacific B2B Enterprise & Industrial Wearables Industry Analysis, Insights and Forecast, 2019-2031
- 12.1. Market Analysis, Insights and Forecast - By Country/Sub-region
- 12.1.1.
- 13. Rest of the World B2B Enterprise & Industrial Wearables Industry Analysis, Insights and Forecast, 2019-2031
- 13.1. Market Analysis, Insights and Forecast - By Country/Sub-region
- 13.1.1.
- 14. Competitive Analysis
- 14.1. Global Market Share Analysis 2024
- 14.2. Company Profiles
- 14.2.1 Oculus VR LLC (Facebook)
- 14.2.1.1. Overview
- 14.2.1.2. Products
- 14.2.1.3. SWOT Analysis
- 14.2.1.4. Recent Developments
- 14.2.1.5. Financials (Based on Availability)
- 14.2.2 Texas Instruments Inc
- 14.2.2.1. Overview
- 14.2.2.2. Products
- 14.2.2.3. SWOT Analysis
- 14.2.2.4. Recent Developments
- 14.2.2.5. Financials (Based on Availability)
- 14.2.3 Samsung Electronics Co Ltd
- 14.2.3.1. Overview
- 14.2.3.2. Products
- 14.2.3.3. SWOT Analysis
- 14.2.3.4. Recent Developments
- 14.2.3.5. Financials (Based on Availability)
- 14.2.4 Alphabet Inc
- 14.2.4.1. Overview
- 14.2.4.2. Products
- 14.2.4.3. SWOT Analysis
- 14.2.4.4. Recent Developments
- 14.2.4.5. Financials (Based on Availability)
- 14.2.5 Xiaomi Inc
- 14.2.5.1. Overview
- 14.2.5.2. Products
- 14.2.5.3. SWOT Analysis
- 14.2.5.4. Recent Developments
- 14.2.5.5. Financials (Based on Availability)
- 14.2.6 Microsoft Corporation
- 14.2.6.1. Overview
- 14.2.6.2. Products
- 14.2.6.3. SWOT Analysis
- 14.2.6.4. Recent Developments
- 14.2.6.5. Financials (Based on Availability)
- 14.2.7 Toshiba Corporation*List Not Exhaustive
- 14.2.7.1. Overview
- 14.2.7.2. Products
- 14.2.7.3. SWOT Analysis
- 14.2.7.4. Recent Developments
- 14.2.7.5. Financials (Based on Availability)
- 14.2.8 Seiko Epson Corporation
- 14.2.8.1. Overview
- 14.2.8.2. Products
- 14.2.8.3. SWOT Analysis
- 14.2.8.4. Recent Developments
- 14.2.8.5. Financials (Based on Availability)
- 14.2.9 Fitbit Inc
- 14.2.9.1. Overview
- 14.2.9.2. Products
- 14.2.9.3. SWOT Analysis
- 14.2.9.4. Recent Developments
- 14.2.9.5. Financials (Based on Availability)
- 14.2.10 Apple Inc
- 14.2.10.1. Overview
- 14.2.10.2. Products
- 14.2.10.3. SWOT Analysis
- 14.2.10.4. Recent Developments
- 14.2.10.5. Financials (Based on Availability)
- 14.2.11 HTC Corporation
- 14.2.11.1. Overview
- 14.2.11.2. Products
- 14.2.11.3. SWOT Analysis
- 14.2.11.4. Recent Developments
- 14.2.11.5. Financials (Based on Availability)
- 14.2.12 Sony Corporation
- 14.2.12.1. Overview
- 14.2.12.2. Products
- 14.2.12.3. SWOT Analysis
- 14.2.12.4. Recent Developments
- 14.2.12.5. Financials (Based on Availability)
- 14.2.1 Oculus VR LLC (Facebook)
List of Figures
- Figure 1: Global B2B Enterprise & Industrial Wearables Industry Revenue Breakdown (Million, %) by Region 2024 & 2032
- Figure 2: North America B2B Enterprise & Industrial Wearables Industry Revenue (Million), by Country 2024 & 2032
- Figure 3: North America B2B Enterprise & Industrial Wearables Industry Revenue Share (%), by Country 2024 & 2032
- Figure 4: Europe B2B Enterprise & Industrial Wearables Industry Revenue (Million), by Country 2024 & 2032
- Figure 5: Europe B2B Enterprise & Industrial Wearables Industry Revenue Share (%), by Country 2024 & 2032
- Figure 6: Asia Pacific B2B Enterprise & Industrial Wearables Industry Revenue (Million), by Country 2024 & 2032
- Figure 7: Asia Pacific B2B Enterprise & Industrial Wearables Industry Revenue Share (%), by Country 2024 & 2032
- Figure 8: Rest of the World B2B Enterprise & Industrial Wearables Industry Revenue (Million), by Country 2024 & 2032
- Figure 9: Rest of the World B2B Enterprise & Industrial Wearables Industry Revenue Share (%), by Country 2024 & 2032
- Figure 10: North America B2B Enterprise & Industrial Wearables Industry Revenue (Million), by Device Type 2024 & 2032
- Figure 11: North America B2B Enterprise & Industrial Wearables Industry Revenue Share (%), by Device Type 2024 & 2032
- Figure 12: North America B2B Enterprise & Industrial Wearables Industry Revenue (Million), by End-user Industry 2024 & 2032
- Figure 13: North America B2B Enterprise & Industrial Wearables Industry Revenue Share (%), by End-user Industry 2024 & 2032
- Figure 14: North America B2B Enterprise & Industrial Wearables Industry Revenue (Million), by Country 2024 & 2032
- Figure 15: North America B2B Enterprise & Industrial Wearables Industry Revenue Share (%), by Country 2024 & 2032
- Figure 16: Europe B2B Enterprise & Industrial Wearables Industry Revenue (Million), by Device Type 2024 & 2032
- Figure 17: Europe B2B Enterprise & Industrial Wearables Industry Revenue Share (%), by Device Type 2024 & 2032
- Figure 18: Europe B2B Enterprise & Industrial Wearables Industry Revenue (Million), by End-user Industry 2024 & 2032
- Figure 19: Europe B2B Enterprise & Industrial Wearables Industry Revenue Share (%), by End-user Industry 2024 & 2032
- Figure 20: Europe B2B Enterprise & Industrial Wearables Industry Revenue (Million), by Country 2024 & 2032
- Figure 21: Europe B2B Enterprise & Industrial Wearables Industry Revenue Share (%), by Country 2024 & 2032
- Figure 22: Asia Pacific B2B Enterprise & Industrial Wearables Industry Revenue (Million), by Device Type 2024 & 2032
- Figure 23: Asia Pacific B2B Enterprise & Industrial Wearables Industry Revenue Share (%), by Device Type 2024 & 2032
- Figure 24: Asia Pacific B2B Enterprise & Industrial Wearables Industry Revenue (Million), by End-user Industry 2024 & 2032
- Figure 25: Asia Pacific B2B Enterprise & Industrial Wearables Industry Revenue Share (%), by End-user Industry 2024 & 2032
- Figure 26: Asia Pacific B2B Enterprise & Industrial Wearables Industry Revenue (Million), by Country 2024 & 2032
- Figure 27: Asia Pacific B2B Enterprise & Industrial Wearables Industry Revenue Share (%), by Country 2024 & 2032
- Figure 28: Rest of the World B2B Enterprise & Industrial Wearables Industry Revenue (Million), by Device Type 2024 & 2032
- Figure 29: Rest of the World B2B Enterprise & Industrial Wearables Industry Revenue Share (%), by Device Type 2024 & 2032
- Figure 30: Rest of the World B2B Enterprise & Industrial Wearables Industry Revenue (Million), by End-user Industry 2024 & 2032
- Figure 31: Rest of the World B2B Enterprise & Industrial Wearables Industry Revenue Share (%), by End-user Industry 2024 & 2032
- Figure 32: Rest of the World B2B Enterprise & Industrial Wearables Industry Revenue (Million), by Country 2024 & 2032
- Figure 33: Rest of the World B2B Enterprise & Industrial Wearables Industry Revenue Share (%), by Country 2024 & 2032
List of Tables
- Table 1: Global B2B Enterprise & Industrial Wearables Industry Revenue Million Forecast, by Region 2019 & 2032
- Table 2: Global B2B Enterprise & Industrial Wearables Industry Revenue Million Forecast, by Device Type 2019 & 2032
- Table 3: Global B2B Enterprise & Industrial Wearables Industry Revenue Million Forecast, by End-user Industry 2019 & 2032
- Table 4: Global B2B Enterprise & Industrial Wearables Industry Revenue Million Forecast, by Region 2019 & 2032
- Table 5: Global B2B Enterprise & Industrial Wearables Industry Revenue Million Forecast, by Country 2019 & 2032
- Table 6: B2B Enterprise & Industrial Wearables Industry Revenue (Million) Forecast, by Application 2019 & 2032
- Table 7: Global B2B Enterprise & Industrial Wearables Industry Revenue Million Forecast, by Country 2019 & 2032
- Table 8: B2B Enterprise & Industrial Wearables Industry Revenue (Million) Forecast, by Application 2019 & 2032
- Table 9: Global B2B Enterprise & Industrial Wearables Industry Revenue Million Forecast, by Country 2019 & 2032
- Table 10: B2B Enterprise & Industrial Wearables Industry Revenue (Million) Forecast, by Application 2019 & 2032
- Table 11: Global B2B Enterprise & Industrial Wearables Industry Revenue Million Forecast, by Country 2019 & 2032
- Table 12: B2B Enterprise & Industrial Wearables Industry Revenue (Million) Forecast, by Application 2019 & 2032
- Table 13: Global B2B Enterprise & Industrial Wearables Industry Revenue Million Forecast, by Device Type 2019 & 2032
- Table 14: Global B2B Enterprise & Industrial Wearables Industry Revenue Million Forecast, by End-user Industry 2019 & 2032
- Table 15: Global B2B Enterprise & Industrial Wearables Industry Revenue Million Forecast, by Country 2019 & 2032
- Table 16: Global B2B Enterprise & Industrial Wearables Industry Revenue Million Forecast, by Device Type 2019 & 2032
- Table 17: Global B2B Enterprise & Industrial Wearables Industry Revenue Million Forecast, by End-user Industry 2019 & 2032
- Table 18: Global B2B Enterprise & Industrial Wearables Industry Revenue Million Forecast, by Country 2019 & 2032
- Table 19: Global B2B Enterprise & Industrial Wearables Industry Revenue Million Forecast, by Device Type 2019 & 2032
- Table 20: Global B2B Enterprise & Industrial Wearables Industry Revenue Million Forecast, by End-user Industry 2019 & 2032
- Table 21: Global B2B Enterprise & Industrial Wearables Industry Revenue Million Forecast, by Country 2019 & 2032
- Table 22: Global B2B Enterprise & Industrial Wearables Industry Revenue Million Forecast, by Device Type 2019 & 2032
- Table 23: Global B2B Enterprise & Industrial Wearables Industry Revenue Million Forecast, by End-user Industry 2019 & 2032
- Table 24: Global B2B Enterprise & Industrial Wearables Industry Revenue Million Forecast, by Country 2019 & 2032
Frequently Asked Questions
1. What is the projected Compound Annual Growth Rate (CAGR) of the B2B Enterprise & Industrial Wearables Industry?
The projected CAGR is approximately 28.20%.
2. Which companies are prominent players in the B2B Enterprise & Industrial Wearables Industry?
Key companies in the market include Oculus VR LLC (Facebook), Texas Instruments Inc, Samsung Electronics Co Ltd, Alphabet Inc, Xiaomi Inc, Microsoft Corporation, Toshiba Corporation*List Not Exhaustive, Seiko Epson Corporation, Fitbit Inc, Apple Inc, HTC Corporation, Sony Corporation.
3. What are the main segments of the B2B Enterprise & Industrial Wearables Industry?
The market segments include Device Type, End-user Industry.
4. Can you provide details about the market size?
The market size is estimated to be USD XX Million as of 2022.
5. What are some drivers contributing to market growth?
Growing App Ecosystem Will Fuel Enterprise Adoption; Demand for Smart Factory Setups are Expected to Aid Growth of Wearables.
6. What are the notable trends driving market growth?
Demand for Smart Factory Setups are Expected to Aid Growth of Wearables.
7. Are there any restraints impacting market growth?
Lack of Business Applications is a Primary Challenge in Deploying Wearables; Perennial Concerns about Data Security and Existing Tech Integration Issues.
8. Can you provide examples of recent developments in the market?
Sept 2022: Amazfit, a leading global smart wearables brand of Zepp Health, teamed up with digital health partner Adidas Runtastic to motivate the diverse international athletic community through industry-leading workout tracking and sharing using Amazfit's proprietary multi-generation BioTracker PPG biometric tracking optical sensor technology, which allows users to monitor a comprehensive range of health and fitness metrics accurately.
9. What pricing options are available for accessing the report?
Pricing options include single-user, multi-user, and enterprise licenses priced at USD 4750, USD 5250, and USD 8750 respectively.
10. Is the market size provided in terms of value or volume?
The market size is provided in terms of value, measured in Million.
11. Are there any specific market keywords associated with the report?
Yes, the market keyword associated with the report is "B2B Enterprise & Industrial Wearables Industry," which aids in identifying and referencing the specific market segment covered.
12. How do I determine which pricing option suits my needs best?
The pricing options vary based on user requirements and access needs. Individual users may opt for single-user licenses, while businesses requiring broader access may choose multi-user or enterprise licenses for cost-effective access to the report.
13. Are there any additional resources or data provided in the B2B Enterprise & Industrial Wearables Industry report?
While the report offers comprehensive insights, it's advisable to review the specific contents or supplementary materials provided to ascertain if additional resources or data are available.
14. How can I stay updated on further developments or reports in the B2B Enterprise & Industrial Wearables Industry?
To stay informed about further developments, trends, and reports in the B2B Enterprise & Industrial Wearables Industry, consider subscribing to industry newsletters, following relevant companies and organizations, or regularly checking reputable industry news sources and publications.
Methodology
Step 1 - Identification of Relevant Samples Size from Population Database


Step 2 - Approaches for Defining Global Market Size (Value, Volume* & Price*)

Note*: In applicable scenarios
Step 3 - Data Sources
Primary Research
- Web Analytics
- Survey Reports
- Research Institute
- Latest Research Reports
- Opinion Leaders
Secondary Research
- Annual Reports
- White Paper
- Latest Press Release
- Industry Association
- Paid Database
- Investor Presentations

Step 4 - Data Triangulation
Involves using different sources of information in order to increase the validity of a study
These sources are likely to be stakeholders in a program - participants, other researchers, program staff, other community members, and so on.
Then we put all data in single framework & apply various statistical tools to find out the dynamic on the market.
During the analysis stage, feedback from the stakeholder groups would be compared to determine areas of agreement as well as areas of divergence
