

Key Insights
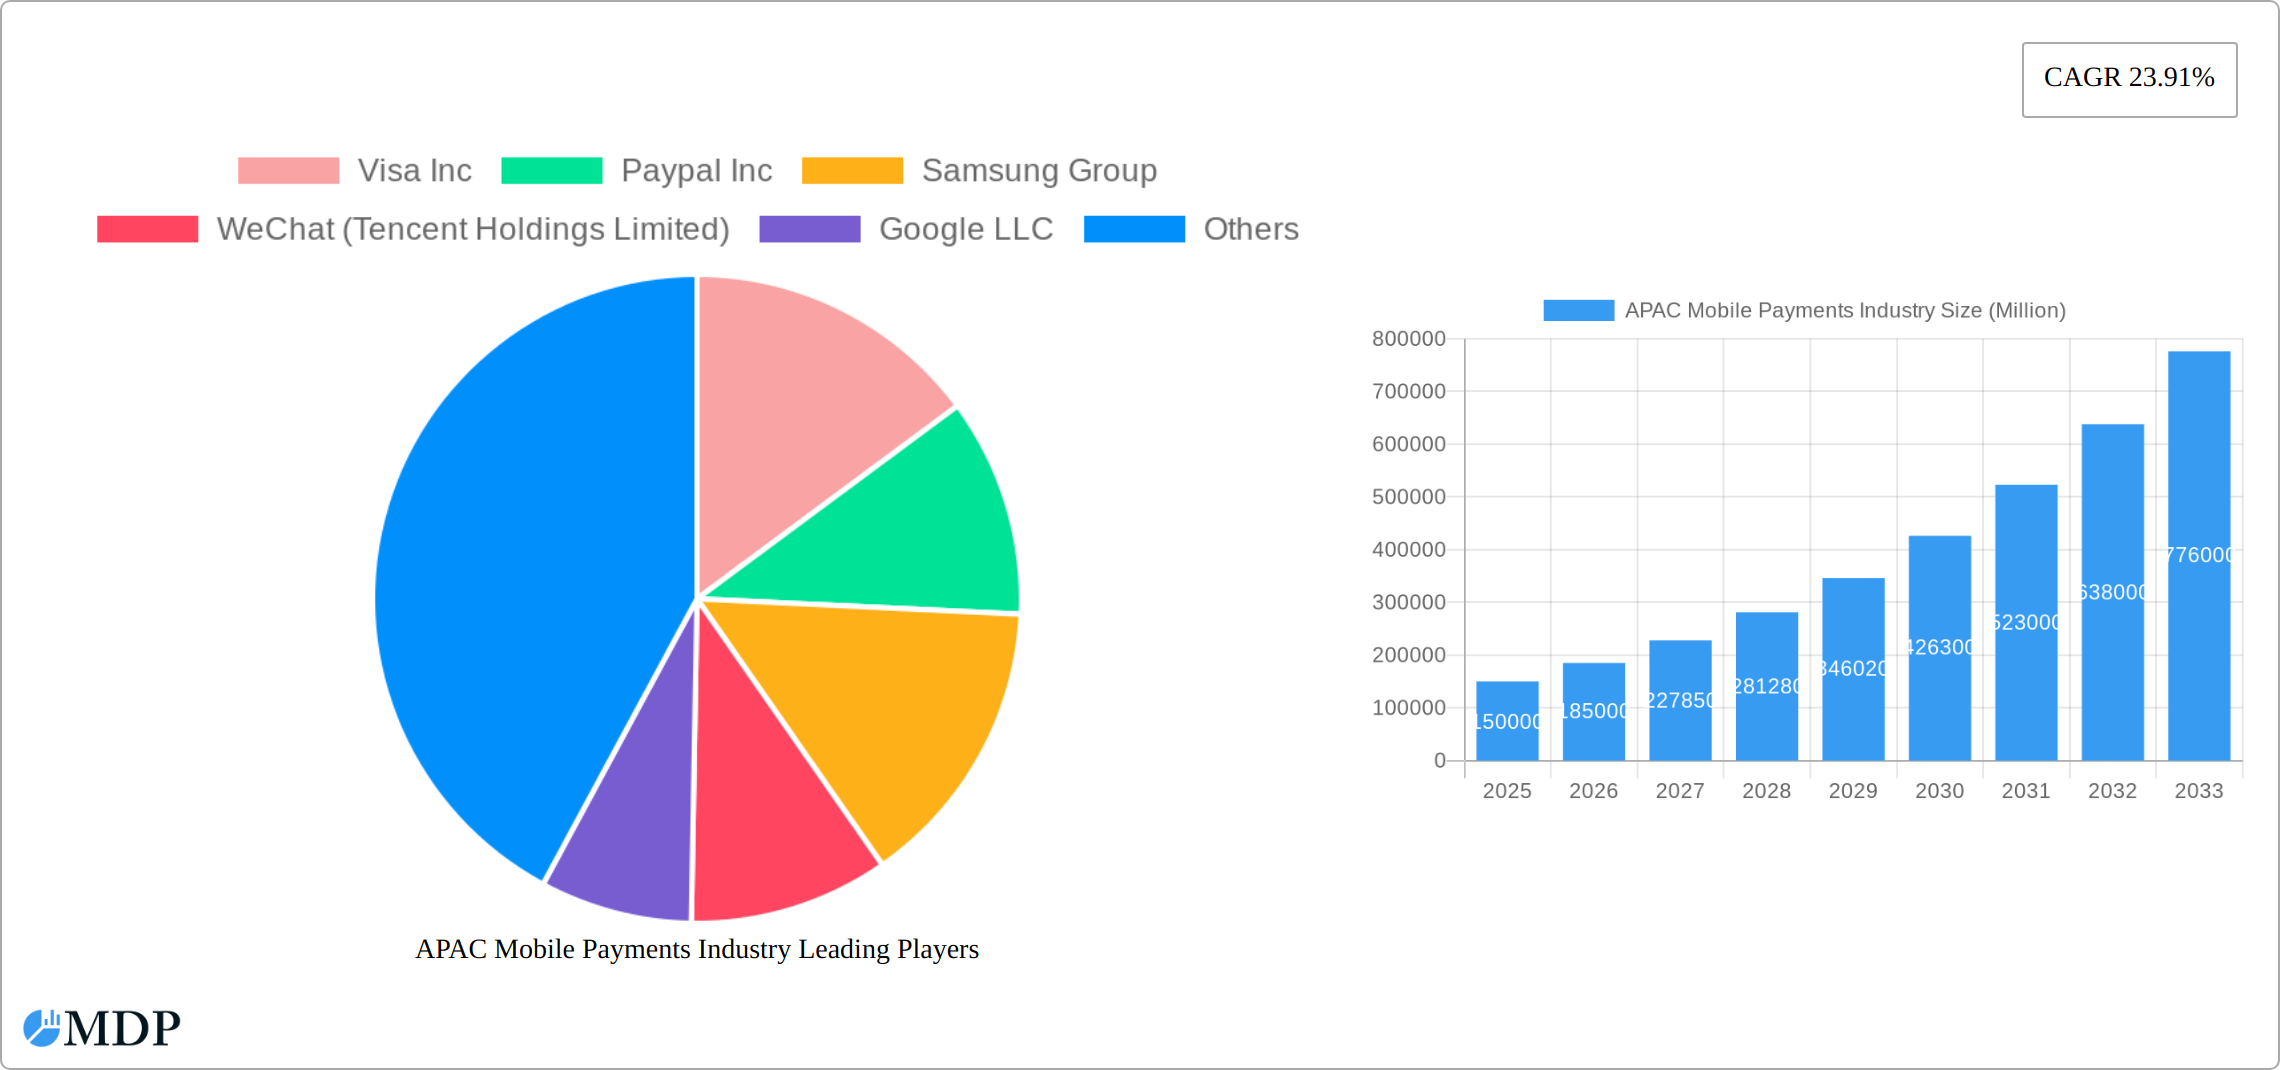
The Asia-Pacific (APAC) mobile payments market is experiencing explosive growth, driven by factors such as increasing smartphone penetration, rising internet and mobile data usage, a burgeoning e-commerce sector, and the expanding adoption of digital financial services, particularly in developing economies like India and China. The region's young and tech-savvy population readily embraces digital solutions, further fueling this expansion. Government initiatives promoting digitalization and financial inclusion across several APAC nations also contribute significantly to this market's upward trajectory. Competition is fierce, with established players like Visa, Mastercard, and PayPal vying for market share alongside rapidly expanding local giants such as Alipay, WeChat Pay, and Paytm. These local players often leverage their deep understanding of local markets and customer preferences, giving them a significant edge. The market is segmented by payment type (proximity and remote), end-user industry (BFSI, retail, healthcare, etc.), and country (China, India, Japan, South Korea, and others). While China and India dominate the market, other countries are showing significant growth potential, particularly in Southeast Asia. The high CAGR of 23.91% indicates substantial future growth opportunities, although challenges remain, including cybersecurity concerns, regulatory hurdles, and the need for improved digital literacy in some areas.
The future of the APAC mobile payments market looks incredibly promising. Continued infrastructure improvements, further penetration of mobile technology in rural areas, and the development of innovative payment solutions, such as biometric authentication and blockchain technology, will only accelerate growth. However, companies must navigate the complexities of diverse regulatory landscapes, ensure robust security measures to combat fraud, and address varying levels of digital literacy across the region. Furthermore, strategic partnerships and collaborations will be key to success in this rapidly evolving and competitive landscape. The forecast period of 2025-2033 suggests that the market will continue its robust growth, driven by the confluence of technological advancements, changing consumer behavior, and supportive government policies. This makes the APAC mobile payments market one of the most dynamic and attractive investment opportunities in the global fintech space.
APAC Mobile Payments Industry: A Comprehensive Market Report (2019-2033)
This in-depth report provides a comprehensive analysis of the Asia-Pacific (APAC) mobile payments industry, covering market dynamics, leading players, key trends, and future growth prospects. With a study period spanning 2019-2033, a base year of 2025, and a forecast period of 2025-2033, this report is an indispensable resource for industry stakeholders, investors, and businesses seeking to understand and capitalize on the opportunities within this rapidly evolving market. The report projects a market value exceeding xx Million by 2033, fueled by factors such as increasing smartphone penetration, rising digital literacy, and supportive government regulations.
APAC Mobile Payments Industry Market Dynamics & Concentration
The APAC mobile payments market is characterized by high growth and intense competition. Market concentration is relatively high, with a few dominant players controlling significant market share. Key players like Alipay, WeChat Pay, and others hold substantial market shares, driving consolidation through mergers and acquisitions (M&A) activities. The number of M&A deals in the sector has increased significantly in recent years, reaching xx in 2024, reflecting the strategic importance of market consolidation. Innovation is a crucial driver, with continuous advancements in technologies such as near-field communication (NFC), biometric authentication, and blockchain impacting market dynamics. Regulatory frameworks vary across APAC countries, influencing market development and posing challenges for companies operating across multiple jurisdictions. The emergence of new payment technologies and digital wallets acts as a significant substitute for traditional payment methods. Finally, evolving end-user preferences, driven by factors like convenience, security, and cost-effectiveness, continue to reshape the landscape.
- Market Concentration: High, with top players holding xx% of market share in 2024.
- M&A Activity: xx deals in 2024, indicating significant consolidation.
- Innovation Drivers: NFC, Biometrics, Blockchain.
- Regulatory Frameworks: Vary significantly across APAC countries.
- Product Substitutes: Emerging digital wallets and payment technologies.
- End-User Trends: Increasing preference for convenience, security, and cost-effectiveness.
APAC Mobile Payments Industry Industry Trends & Analysis
The APAC mobile payments market is experiencing explosive growth, fueled by the region's rapidly expanding digital economy and soaring smartphone penetration. While precise figures fluctuate based on the source and methodology, the Compound Annual Growth Rate (CAGR) is projected to remain robust throughout the forecast period (2025-2033), exceeding [Insert updated CAGR percentage]% in many analyses. Market penetration is anticipated to reach [Insert updated market penetration percentage]% by 2033, signifying a significant shift in consumer payment behavior. The emergence of "super apps," integrating payments with numerous other services, is fundamentally reshaping consumer habits and the competitive landscape. Consumers increasingly prioritize seamless, secure, and user-friendly mobile payment experiences, driving the adoption of innovative features like biometric authentication and tokenization. The competitive landscape is highly dynamic, with established players facing intense pressure from agile fintech startups. Strategic partnerships and mergers & acquisitions are becoming increasingly crucial for expanding service offerings and geographic reach, leading to a consolidation of the market in certain segments.
Leading Markets & Segments in APAC Mobile Payments Industry
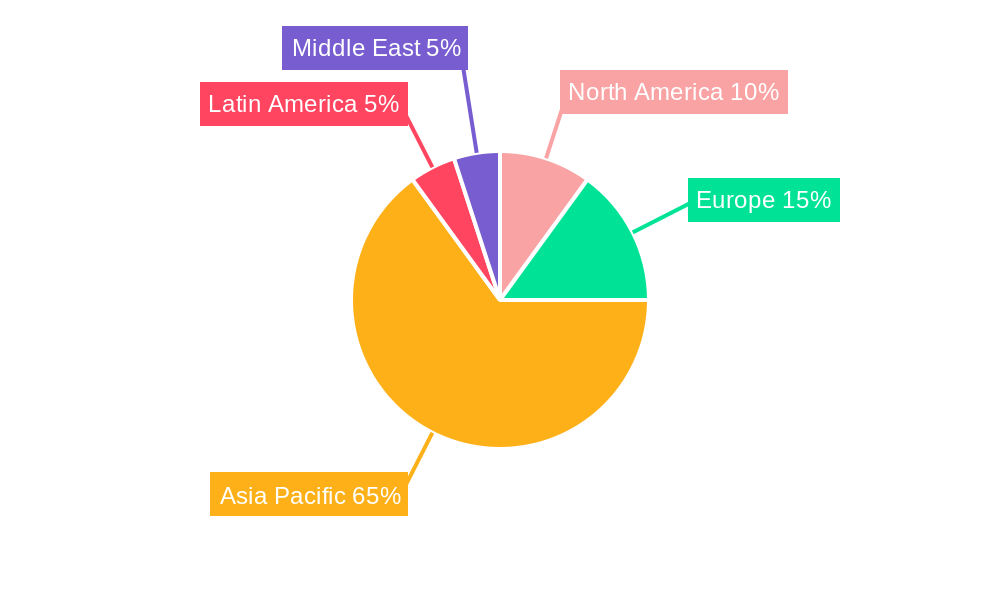
China and India dominate the APAC mobile payments market, driven by large populations, high smartphone penetration, and supportive government policies. However, other countries like South Korea and Japan are also witnessing significant growth. Within segments, remote payment systems hold a larger market share compared to proximity payments, reflecting increasing consumer demand for contactless and digital transactions. The BFSI (Banking, Financial Services, and Insurance) sector constitutes the largest end-user industry, followed by retail and e-commerce.
- Dominant Regions: China and India.
- Key Drivers (China): Large population, high smartphone penetration, robust e-commerce sector, supportive government initiatives.
- Key Drivers (India): Rapidly growing digital economy, increasing smartphone adoption, government's digital India push, expansion of UPI.
- Key Drivers (South Korea): High tech adoption, strong digital infrastructure, sophisticated consumer base.
- Key Drivers (Japan): Gradual adoption of mobile payments, strong e-commerce growth.
- Dominant Segments (By Type): Remote Payment.
- Dominant Segments (By End-User Industry): BFSI, Retail.
APAP Mobile Payments Industry Product Developments
Recent product innovations focus on enhancing security, improving user experience, and expanding payment functionalities. This includes the integration of biometric authentication, AI-powered fraud detection systems, and seamless cross-border payment capabilities. The market is witnessing a trend towards super apps that integrate multiple services, including payments, messaging, and ride-hailing, creating a holistic user experience. These innovations are crucial for enhancing competitiveness and capturing a larger market share.
Key Drivers of APAC Mobile Payments Industry Growth
The phenomenal growth of the APAC mobile payments industry is driven by a confluence of factors:
- Technological Advancements: The continuous development of faster, more secure, and interoperable payment technologies, including advancements in biometric authentication, tokenization, and real-time payments processing.
- Economic Growth and Rising Disposable Incomes: A burgeoning middle class with increasing disposable income fuels higher consumer spending, particularly via convenient digital channels.
- Government Support for Digitalization: Pro-active government policies in many APAC nations actively promote digital payments, financial inclusion, and the reduction of reliance on cash.
- Ubiquitous Smartphone Penetration: Nearly universal smartphone ownership across much of the region provides the essential infrastructure for mobile payments.
- Improved Digital Infrastructure: Significant investments in expanding high-speed internet and mobile network coverage are reducing the digital divide and making mobile payments more accessible.
- E-commerce Boom: The rapid growth of e-commerce platforms and online marketplaces creates a huge demand for convenient and secure online payment methods.
Challenges in the APAC Mobile Payments Industry Market
Despite the significant growth, several challenges persist:
- Regulatory Fragmentation: The diverse regulatory landscape across APAC nations creates complexity for businesses operating across multiple jurisdictions and can hinder standardization.
- Cybersecurity Threats: The increasing sophistication of cyberattacks necessitates robust security measures to protect sensitive financial data and maintain consumer trust.
- Digital Literacy Disparities: Addressing the digital literacy gap in certain segments of the population is crucial for ensuring inclusive access to mobile payment services.
- Infrastructure Gaps in Underserved Areas: While improving, reliable internet access remains a challenge in some remote or less developed regions.
- Intense Competition and Market Consolidation: The highly competitive market is driving consolidation as companies merge or are acquired to gain scale and market share.
Emerging Opportunities in APAC Mobile Payments Industry
The APAC mobile payments market presents exciting opportunities for innovation and expansion:
- Financial Inclusion in Underserved Markets: Expanding mobile payment services to previously unbanked or underbanked populations presents a significant opportunity for both social impact and commercial growth.
- Innovation in Payment Solutions: The development of innovative payment solutions, such as Buy Now Pay Later (BNPL) services, peer-to-peer (P2P) transfers, and embedded finance, are shaping the future of the market.
- Strategic Alliances and Partnerships: Collaboration between fintechs, traditional financial institutions, and technology companies fosters innovation and expands market reach.
- Leveraging Emerging Technologies: Integration of technologies like blockchain, Artificial Intelligence (AI), and the Internet of Things (IoT) can enhance security, efficiency, and user experience.
- Cross-border Payments: Streamlining and reducing costs for cross-border payments will unlock further growth within the region and internationally.
Leading Players in the APAC Mobile Payments Industry Sector
- Visa Inc
- Paypal Inc
- Samsung Group
- WeChat (Tencent Holdings Limited)
- Google LLC
- Comviva Technologies Limited (A Tech Mahindra Company)
- Amazon com Inc
- Alipay com Co Ltd
- Mastercard Inc
- Paytm (One97 Communications Limited)
- American Express Co
Key Milestones in APAC Mobile Payments Industry Industry
- June 2022: ComfortDelGro Taxi and Alipay+ partnership expands mobile payment acceptance in Malaysia and South Korea.
- March 2022: HDFC Bank launches PayZapp 2.0, a revamped mobile payment app with UPI integration.
Strategic Outlook for APAC Mobile Payments Industry Market
The APAC mobile payments market offers substantial long-term growth potential. Companies must adopt a strategic approach that leverages technological advancements, targets underserved markets, and forges strategic alliances to maximize market share. The continuous growth of e-commerce, ever-increasing smartphone penetration, and supportive government policies will continue to drive the expansion of the mobile payments sector in the years to come. Success hinges on adapting to dynamic consumer preferences, prioritizing robust security measures to mitigate risks, and delivering innovative, user-centric payment solutions. Those companies that can effectively navigate the competitive landscape and address the challenges while capitalizing on emerging opportunities are poised for significant success.
APAC Mobile Payments Industry Segmentation
-
1. Type
- 1.1. Proximity Payment
- 1.2. Remote Payment
-
2. End-User Industry
- 2.1. BFSI
- 2.2. IT and Telecommunication
- 2.3. Retail
- 2.4. Healthcare
- 2.5. Government
- 2.6. Media and Entertainment
- 2.7. Transportation and Logistics
- 2.8. Other End User
APAC Mobile Payments Industry Segmentation By Geography
-
1. North America
- 1.1. United States
- 1.2. Canada
- 1.3. Mexico
-
2. South America
- 2.1. Brazil
- 2.2. Argentina
- 2.3. Rest of South America
-
3. Europe
- 3.1. United Kingdom
- 3.2. Germany
- 3.3. France
- 3.4. Italy
- 3.5. Spain
- 3.6. Russia
- 3.7. Benelux
- 3.8. Nordics
- 3.9. Rest of Europe
-
4. Middle East & Africa
- 4.1. Turkey
- 4.2. Israel
- 4.3. GCC
- 4.4. North Africa
- 4.5. South Africa
- 4.6. Rest of Middle East & Africa
-
5. Asia Pacific
- 5.1. China
- 5.2. India
- 5.3. Japan
- 5.4. South Korea
- 5.5. ASEAN
- 5.6. Oceania
- 5.7. Rest of Asia Pacific
APAC Mobile Payments Industry REPORT HIGHLIGHTS
| Aspects | Details |
|---|---|
| Study Period | 2019-2033 |
| Base Year | 2024 |
| Estimated Year | 2025 |
| Forecast Period | 2025-2033 |
| Historical Period | 2019-2024 |
| Growth Rate | CAGR of 23.91% from 2019-2033 |
| Segmentation |
|
Table of Contents
- 1. Introduction
- 1.1. Research Scope
- 1.2. Market Segmentation
- 1.3. Research Methodology
- 1.4. Definitions and Assumptions
- 2. Executive Summary
- 2.1. Introduction
- 3. Market Dynamics
- 3.1. Introduction
- 3.2. Market Drivers
- 3.2.1. Increasing Internet Penetration and Growing M-commerce Market
- 3.3. Market Restrains
- 3.3.1. Security Issues Associated with Mobile Payments
- 3.4. Market Trends
- 3.4.1. Retail Industry is one of the Factor Driving the Market
- 4. Market Factor Analysis
- 4.1. Porters Five Forces
- 4.2. Supply/Value Chain
- 4.3. PESTEL analysis
- 4.4. Market Entropy
- 4.5. Patent/Trademark Analysis
- 5. Global APAC Mobile Payments Industry Analysis, Insights and Forecast, 2019-2031
- 5.1. Market Analysis, Insights and Forecast - by Type
- 5.1.1. Proximity Payment
- 5.1.2. Remote Payment
- 5.2. Market Analysis, Insights and Forecast - by End-User Industry
- 5.2.1. BFSI
- 5.2.2. IT and Telecommunication
- 5.2.3. Retail
- 5.2.4. Healthcare
- 5.2.5. Government
- 5.2.6. Media and Entertainment
- 5.2.7. Transportation and Logistics
- 5.2.8. Other End User
- 5.3. Market Analysis, Insights and Forecast - by Region
- 5.3.1. North America
- 5.3.2. South America
- 5.3.3. Europe
- 5.3.4. Middle East & Africa
- 5.3.5. Asia Pacific
- 5.1. Market Analysis, Insights and Forecast - by Type
- 6. North America APAC Mobile Payments Industry Analysis, Insights and Forecast, 2019-2031
- 6.1. Market Analysis, Insights and Forecast - by Type
- 6.1.1. Proximity Payment
- 6.1.2. Remote Payment
- 6.2. Market Analysis, Insights and Forecast - by End-User Industry
- 6.2.1. BFSI
- 6.2.2. IT and Telecommunication
- 6.2.3. Retail
- 6.2.4. Healthcare
- 6.2.5. Government
- 6.2.6. Media and Entertainment
- 6.2.7. Transportation and Logistics
- 6.2.8. Other End User
- 6.1. Market Analysis, Insights and Forecast - by Type
- 7. South America APAC Mobile Payments Industry Analysis, Insights and Forecast, 2019-2031
- 7.1. Market Analysis, Insights and Forecast - by Type
- 7.1.1. Proximity Payment
- 7.1.2. Remote Payment
- 7.2. Market Analysis, Insights and Forecast - by End-User Industry
- 7.2.1. BFSI
- 7.2.2. IT and Telecommunication
- 7.2.3. Retail
- 7.2.4. Healthcare
- 7.2.5. Government
- 7.2.6. Media and Entertainment
- 7.2.7. Transportation and Logistics
- 7.2.8. Other End User
- 7.1. Market Analysis, Insights and Forecast - by Type
- 8. Europe APAC Mobile Payments Industry Analysis, Insights and Forecast, 2019-2031
- 8.1. Market Analysis, Insights and Forecast - by Type
- 8.1.1. Proximity Payment
- 8.1.2. Remote Payment
- 8.2. Market Analysis, Insights and Forecast - by End-User Industry
- 8.2.1. BFSI
- 8.2.2. IT and Telecommunication
- 8.2.3. Retail
- 8.2.4. Healthcare
- 8.2.5. Government
- 8.2.6. Media and Entertainment
- 8.2.7. Transportation and Logistics
- 8.2.8. Other End User
- 8.1. Market Analysis, Insights and Forecast - by Type
- 9. Middle East & Africa APAC Mobile Payments Industry Analysis, Insights and Forecast, 2019-2031
- 9.1. Market Analysis, Insights and Forecast - by Type
- 9.1.1. Proximity Payment
- 9.1.2. Remote Payment
- 9.2. Market Analysis, Insights and Forecast - by End-User Industry
- 9.2.1. BFSI
- 9.2.2. IT and Telecommunication
- 9.2.3. Retail
- 9.2.4. Healthcare
- 9.2.5. Government
- 9.2.6. Media and Entertainment
- 9.2.7. Transportation and Logistics
- 9.2.8. Other End User
- 9.1. Market Analysis, Insights and Forecast - by Type
- 10. Asia Pacific APAC Mobile Payments Industry Analysis, Insights and Forecast, 2019-2031
- 10.1. Market Analysis, Insights and Forecast - by Type
- 10.1.1. Proximity Payment
- 10.1.2. Remote Payment
- 10.2. Market Analysis, Insights and Forecast - by End-User Industry
- 10.2.1. BFSI
- 10.2.2. IT and Telecommunication
- 10.2.3. Retail
- 10.2.4. Healthcare
- 10.2.5. Government
- 10.2.6. Media and Entertainment
- 10.2.7. Transportation and Logistics
- 10.2.8. Other End User
- 10.1. Market Analysis, Insights and Forecast - by Type
- 11. North America APAC Mobile Payments Industry Analysis, Insights and Forecast, 2019-2031
- 11.1. Market Analysis, Insights and Forecast - By Country/Sub-region
- 11.1.1.
- 12. Europe APAC Mobile Payments Industry Analysis, Insights and Forecast, 2019-2031
- 12.1. Market Analysis, Insights and Forecast - By Country/Sub-region
- 12.1.1.
- 13. Asia Pacific APAC Mobile Payments Industry Analysis, Insights and Forecast, 2019-2031
- 13.1. Market Analysis, Insights and Forecast - By Country/Sub-region
- 13.1.1.
- 14. Latin America APAC Mobile Payments Industry Analysis, Insights and Forecast, 2019-2031
- 14.1. Market Analysis, Insights and Forecast - By Country/Sub-region
- 14.1.1.
- 15. Middle East APAC Mobile Payments Industry Analysis, Insights and Forecast, 2019-2031
- 15.1. Market Analysis, Insights and Forecast - By Country/Sub-region
- 15.1.1.
- 16. Competitive Analysis
- 16.1. Global Market Share Analysis 2024
- 16.2. Company Profiles
- 16.2.1 Visa Inc
- 16.2.1.1. Overview
- 16.2.1.2. Products
- 16.2.1.3. SWOT Analysis
- 16.2.1.4. Recent Developments
- 16.2.1.5. Financials (Based on Availability)
- 16.2.2 Paypal Inc
- 16.2.2.1. Overview
- 16.2.2.2. Products
- 16.2.2.3. SWOT Analysis
- 16.2.2.4. Recent Developments
- 16.2.2.5. Financials (Based on Availability)
- 16.2.3 Samsung Group
- 16.2.3.1. Overview
- 16.2.3.2. Products
- 16.2.3.3. SWOT Analysis
- 16.2.3.4. Recent Developments
- 16.2.3.5. Financials (Based on Availability)
- 16.2.4 WeChat (Tencent Holdings Limited)
- 16.2.4.1. Overview
- 16.2.4.2. Products
- 16.2.4.3. SWOT Analysis
- 16.2.4.4. Recent Developments
- 16.2.4.5. Financials (Based on Availability)
- 16.2.5 Google LLC
- 16.2.5.1. Overview
- 16.2.5.2. Products
- 16.2.5.3. SWOT Analysis
- 16.2.5.4. Recent Developments
- 16.2.5.5. Financials (Based on Availability)
- 16.2.6 Comviva Technologies Limited (A Tech Mahindra Company)
- 16.2.6.1. Overview
- 16.2.6.2. Products
- 16.2.6.3. SWOT Analysis
- 16.2.6.4. Recent Developments
- 16.2.6.5. Financials (Based on Availability)
- 16.2.7 Amazon com Inc
- 16.2.7.1. Overview
- 16.2.7.2. Products
- 16.2.7.3. SWOT Analysis
- 16.2.7.4. Recent Developments
- 16.2.7.5. Financials (Based on Availability)
- 16.2.8 Alipay com Co Ltd
- 16.2.8.1. Overview
- 16.2.8.2. Products
- 16.2.8.3. SWOT Analysis
- 16.2.8.4. Recent Developments
- 16.2.8.5. Financials (Based on Availability)
- 16.2.9 Mastercard Inc
- 16.2.9.1. Overview
- 16.2.9.2. Products
- 16.2.9.3. SWOT Analysis
- 16.2.9.4. Recent Developments
- 16.2.9.5. Financials (Based on Availability)
- 16.2.10 Paytm (One97 Communications Limited)
- 16.2.10.1. Overview
- 16.2.10.2. Products
- 16.2.10.3. SWOT Analysis
- 16.2.10.4. Recent Developments
- 16.2.10.5. Financials (Based on Availability)
- 16.2.11 American Express Co
- 16.2.11.1. Overview
- 16.2.11.2. Products
- 16.2.11.3. SWOT Analysis
- 16.2.11.4. Recent Developments
- 16.2.11.5. Financials (Based on Availability)
- 16.2.1 Visa Inc
List of Figures
- Figure 1: Global APAC Mobile Payments Industry Revenue Breakdown (Million, %) by Region 2024 & 2032
- Figure 2: Global APAC Mobile Payments Industry Volume Breakdown (K Unit, %) by Region 2024 & 2032
- Figure 3: North America APAC Mobile Payments Industry Revenue (Million), by Country 2024 & 2032
- Figure 4: North America APAC Mobile Payments Industry Volume (K Unit), by Country 2024 & 2032
- Figure 5: North America APAC Mobile Payments Industry Revenue Share (%), by Country 2024 & 2032
- Figure 6: North America APAC Mobile Payments Industry Volume Share (%), by Country 2024 & 2032
- Figure 7: Europe APAC Mobile Payments Industry Revenue (Million), by Country 2024 & 2032
- Figure 8: Europe APAC Mobile Payments Industry Volume (K Unit), by Country 2024 & 2032
- Figure 9: Europe APAC Mobile Payments Industry Revenue Share (%), by Country 2024 & 2032
- Figure 10: Europe APAC Mobile Payments Industry Volume Share (%), by Country 2024 & 2032
- Figure 11: Asia Pacific APAC Mobile Payments Industry Revenue (Million), by Country 2024 & 2032
- Figure 12: Asia Pacific APAC Mobile Payments Industry Volume (K Unit), by Country 2024 & 2032
- Figure 13: Asia Pacific APAC Mobile Payments Industry Revenue Share (%), by Country 2024 & 2032
- Figure 14: Asia Pacific APAC Mobile Payments Industry Volume Share (%), by Country 2024 & 2032
- Figure 15: Latin America APAC Mobile Payments Industry Revenue (Million), by Country 2024 & 2032
- Figure 16: Latin America APAC Mobile Payments Industry Volume (K Unit), by Country 2024 & 2032
- Figure 17: Latin America APAC Mobile Payments Industry Revenue Share (%), by Country 2024 & 2032
- Figure 18: Latin America APAC Mobile Payments Industry Volume Share (%), by Country 2024 & 2032
- Figure 19: Middle East APAC Mobile Payments Industry Revenue (Million), by Country 2024 & 2032
- Figure 20: Middle East APAC Mobile Payments Industry Volume (K Unit), by Country 2024 & 2032
- Figure 21: Middle East APAC Mobile Payments Industry Revenue Share (%), by Country 2024 & 2032
- Figure 22: Middle East APAC Mobile Payments Industry Volume Share (%), by Country 2024 & 2032
- Figure 23: North America APAC Mobile Payments Industry Revenue (Million), by Type 2024 & 2032
- Figure 24: North America APAC Mobile Payments Industry Volume (K Unit), by Type 2024 & 2032
- Figure 25: North America APAC Mobile Payments Industry Revenue Share (%), by Type 2024 & 2032
- Figure 26: North America APAC Mobile Payments Industry Volume Share (%), by Type 2024 & 2032
- Figure 27: North America APAC Mobile Payments Industry Revenue (Million), by End-User Industry 2024 & 2032
- Figure 28: North America APAC Mobile Payments Industry Volume (K Unit), by End-User Industry 2024 & 2032
- Figure 29: North America APAC Mobile Payments Industry Revenue Share (%), by End-User Industry 2024 & 2032
- Figure 30: North America APAC Mobile Payments Industry Volume Share (%), by End-User Industry 2024 & 2032
- Figure 31: North America APAC Mobile Payments Industry Revenue (Million), by Country 2024 & 2032
- Figure 32: North America APAC Mobile Payments Industry Volume (K Unit), by Country 2024 & 2032
- Figure 33: North America APAC Mobile Payments Industry Revenue Share (%), by Country 2024 & 2032
- Figure 34: North America APAC Mobile Payments Industry Volume Share (%), by Country 2024 & 2032
- Figure 35: South America APAC Mobile Payments Industry Revenue (Million), by Type 2024 & 2032
- Figure 36: South America APAC Mobile Payments Industry Volume (K Unit), by Type 2024 & 2032
- Figure 37: South America APAC Mobile Payments Industry Revenue Share (%), by Type 2024 & 2032
- Figure 38: South America APAC Mobile Payments Industry Volume Share (%), by Type 2024 & 2032
- Figure 39: South America APAC Mobile Payments Industry Revenue (Million), by End-User Industry 2024 & 2032
- Figure 40: South America APAC Mobile Payments Industry Volume (K Unit), by End-User Industry 2024 & 2032
- Figure 41: South America APAC Mobile Payments Industry Revenue Share (%), by End-User Industry 2024 & 2032
- Figure 42: South America APAC Mobile Payments Industry Volume Share (%), by End-User Industry 2024 & 2032
- Figure 43: South America APAC Mobile Payments Industry Revenue (Million), by Country 2024 & 2032
- Figure 44: South America APAC Mobile Payments Industry Volume (K Unit), by Country 2024 & 2032
- Figure 45: South America APAC Mobile Payments Industry Revenue Share (%), by Country 2024 & 2032
- Figure 46: South America APAC Mobile Payments Industry Volume Share (%), by Country 2024 & 2032
- Figure 47: Europe APAC Mobile Payments Industry Revenue (Million), by Type 2024 & 2032
- Figure 48: Europe APAC Mobile Payments Industry Volume (K Unit), by Type 2024 & 2032
- Figure 49: Europe APAC Mobile Payments Industry Revenue Share (%), by Type 2024 & 2032
- Figure 50: Europe APAC Mobile Payments Industry Volume Share (%), by Type 2024 & 2032
- Figure 51: Europe APAC Mobile Payments Industry Revenue (Million), by End-User Industry 2024 & 2032
- Figure 52: Europe APAC Mobile Payments Industry Volume (K Unit), by End-User Industry 2024 & 2032
- Figure 53: Europe APAC Mobile Payments Industry Revenue Share (%), by End-User Industry 2024 & 2032
- Figure 54: Europe APAC Mobile Payments Industry Volume Share (%), by End-User Industry 2024 & 2032
- Figure 55: Europe APAC Mobile Payments Industry Revenue (Million), by Country 2024 & 2032
- Figure 56: Europe APAC Mobile Payments Industry Volume (K Unit), by Country 2024 & 2032
- Figure 57: Europe APAC Mobile Payments Industry Revenue Share (%), by Country 2024 & 2032
- Figure 58: Europe APAC Mobile Payments Industry Volume Share (%), by Country 2024 & 2032
- Figure 59: Middle East & Africa APAC Mobile Payments Industry Revenue (Million), by Type 2024 & 2032
- Figure 60: Middle East & Africa APAC Mobile Payments Industry Volume (K Unit), by Type 2024 & 2032
- Figure 61: Middle East & Africa APAC Mobile Payments Industry Revenue Share (%), by Type 2024 & 2032
- Figure 62: Middle East & Africa APAC Mobile Payments Industry Volume Share (%), by Type 2024 & 2032
- Figure 63: Middle East & Africa APAC Mobile Payments Industry Revenue (Million), by End-User Industry 2024 & 2032
- Figure 64: Middle East & Africa APAC Mobile Payments Industry Volume (K Unit), by End-User Industry 2024 & 2032
- Figure 65: Middle East & Africa APAC Mobile Payments Industry Revenue Share (%), by End-User Industry 2024 & 2032
- Figure 66: Middle East & Africa APAC Mobile Payments Industry Volume Share (%), by End-User Industry 2024 & 2032
- Figure 67: Middle East & Africa APAC Mobile Payments Industry Revenue (Million), by Country 2024 & 2032
- Figure 68: Middle East & Africa APAC Mobile Payments Industry Volume (K Unit), by Country 2024 & 2032
- Figure 69: Middle East & Africa APAC Mobile Payments Industry Revenue Share (%), by Country 2024 & 2032
- Figure 70: Middle East & Africa APAC Mobile Payments Industry Volume Share (%), by Country 2024 & 2032
- Figure 71: Asia Pacific APAC Mobile Payments Industry Revenue (Million), by Type 2024 & 2032
- Figure 72: Asia Pacific APAC Mobile Payments Industry Volume (K Unit), by Type 2024 & 2032
- Figure 73: Asia Pacific APAC Mobile Payments Industry Revenue Share (%), by Type 2024 & 2032
- Figure 74: Asia Pacific APAC Mobile Payments Industry Volume Share (%), by Type 2024 & 2032
- Figure 75: Asia Pacific APAC Mobile Payments Industry Revenue (Million), by End-User Industry 2024 & 2032
- Figure 76: Asia Pacific APAC Mobile Payments Industry Volume (K Unit), by End-User Industry 2024 & 2032
- Figure 77: Asia Pacific APAC Mobile Payments Industry Revenue Share (%), by End-User Industry 2024 & 2032
- Figure 78: Asia Pacific APAC Mobile Payments Industry Volume Share (%), by End-User Industry 2024 & 2032
- Figure 79: Asia Pacific APAC Mobile Payments Industry Revenue (Million), by Country 2024 & 2032
- Figure 80: Asia Pacific APAC Mobile Payments Industry Volume (K Unit), by Country 2024 & 2032
- Figure 81: Asia Pacific APAC Mobile Payments Industry Revenue Share (%), by Country 2024 & 2032
- Figure 82: Asia Pacific APAC Mobile Payments Industry Volume Share (%), by Country 2024 & 2032
List of Tables
- Table 1: Global APAC Mobile Payments Industry Revenue Million Forecast, by Region 2019 & 2032
- Table 2: Global APAC Mobile Payments Industry Volume K Unit Forecast, by Region 2019 & 2032
- Table 3: Global APAC Mobile Payments Industry Revenue Million Forecast, by Type 2019 & 2032
- Table 4: Global APAC Mobile Payments Industry Volume K Unit Forecast, by Type 2019 & 2032
- Table 5: Global APAC Mobile Payments Industry Revenue Million Forecast, by End-User Industry 2019 & 2032
- Table 6: Global APAC Mobile Payments Industry Volume K Unit Forecast, by End-User Industry 2019 & 2032
- Table 7: Global APAC Mobile Payments Industry Revenue Million Forecast, by Region 2019 & 2032
- Table 8: Global APAC Mobile Payments Industry Volume K Unit Forecast, by Region 2019 & 2032
- Table 9: Global APAC Mobile Payments Industry Revenue Million Forecast, by Country 2019 & 2032
- Table 10: Global APAC Mobile Payments Industry Volume K Unit Forecast, by Country 2019 & 2032
- Table 11: APAC Mobile Payments Industry Revenue (Million) Forecast, by Application 2019 & 2032
- Table 12: APAC Mobile Payments Industry Volume (K Unit) Forecast, by Application 2019 & 2032
- Table 13: Global APAC Mobile Payments Industry Revenue Million Forecast, by Country 2019 & 2032
- Table 14: Global APAC Mobile Payments Industry Volume K Unit Forecast, by Country 2019 & 2032
- Table 15: APAC Mobile Payments Industry Revenue (Million) Forecast, by Application 2019 & 2032
- Table 16: APAC Mobile Payments Industry Volume (K Unit) Forecast, by Application 2019 & 2032
- Table 17: Global APAC Mobile Payments Industry Revenue Million Forecast, by Country 2019 & 2032
- Table 18: Global APAC Mobile Payments Industry Volume K Unit Forecast, by Country 2019 & 2032
- Table 19: APAC Mobile Payments Industry Revenue (Million) Forecast, by Application 2019 & 2032
- Table 20: APAC Mobile Payments Industry Volume (K Unit) Forecast, by Application 2019 & 2032
- Table 21: Global APAC Mobile Payments Industry Revenue Million Forecast, by Country 2019 & 2032
- Table 22: Global APAC Mobile Payments Industry Volume K Unit Forecast, by Country 2019 & 2032
- Table 23: APAC Mobile Payments Industry Revenue (Million) Forecast, by Application 2019 & 2032
- Table 24: APAC Mobile Payments Industry Volume (K Unit) Forecast, by Application 2019 & 2032
- Table 25: Global APAC Mobile Payments Industry Revenue Million Forecast, by Country 2019 & 2032
- Table 26: Global APAC Mobile Payments Industry Volume K Unit Forecast, by Country 2019 & 2032
- Table 27: APAC Mobile Payments Industry Revenue (Million) Forecast, by Application 2019 & 2032
- Table 28: APAC Mobile Payments Industry Volume (K Unit) Forecast, by Application 2019 & 2032
- Table 29: Global APAC Mobile Payments Industry Revenue Million Forecast, by Type 2019 & 2032
- Table 30: Global APAC Mobile Payments Industry Volume K Unit Forecast, by Type 2019 & 2032
- Table 31: Global APAC Mobile Payments Industry Revenue Million Forecast, by End-User Industry 2019 & 2032
- Table 32: Global APAC Mobile Payments Industry Volume K Unit Forecast, by End-User Industry 2019 & 2032
- Table 33: Global APAC Mobile Payments Industry Revenue Million Forecast, by Country 2019 & 2032
- Table 34: Global APAC Mobile Payments Industry Volume K Unit Forecast, by Country 2019 & 2032
- Table 35: United States APAC Mobile Payments Industry Revenue (Million) Forecast, by Application 2019 & 2032
- Table 36: United States APAC Mobile Payments Industry Volume (K Unit) Forecast, by Application 2019 & 2032
- Table 37: Canada APAC Mobile Payments Industry Revenue (Million) Forecast, by Application 2019 & 2032
- Table 38: Canada APAC Mobile Payments Industry Volume (K Unit) Forecast, by Application 2019 & 2032
- Table 39: Mexico APAC Mobile Payments Industry Revenue (Million) Forecast, by Application 2019 & 2032
- Table 40: Mexico APAC Mobile Payments Industry Volume (K Unit) Forecast, by Application 2019 & 2032
- Table 41: Global APAC Mobile Payments Industry Revenue Million Forecast, by Type 2019 & 2032
- Table 42: Global APAC Mobile Payments Industry Volume K Unit Forecast, by Type 2019 & 2032
- Table 43: Global APAC Mobile Payments Industry Revenue Million Forecast, by End-User Industry 2019 & 2032
- Table 44: Global APAC Mobile Payments Industry Volume K Unit Forecast, by End-User Industry 2019 & 2032
- Table 45: Global APAC Mobile Payments Industry Revenue Million Forecast, by Country 2019 & 2032
- Table 46: Global APAC Mobile Payments Industry Volume K Unit Forecast, by Country 2019 & 2032
- Table 47: Brazil APAC Mobile Payments Industry Revenue (Million) Forecast, by Application 2019 & 2032
- Table 48: Brazil APAC Mobile Payments Industry Volume (K Unit) Forecast, by Application 2019 & 2032
- Table 49: Argentina APAC Mobile Payments Industry Revenue (Million) Forecast, by Application 2019 & 2032
- Table 50: Argentina APAC Mobile Payments Industry Volume (K Unit) Forecast, by Application 2019 & 2032
- Table 51: Rest of South America APAC Mobile Payments Industry Revenue (Million) Forecast, by Application 2019 & 2032
- Table 52: Rest of South America APAC Mobile Payments Industry Volume (K Unit) Forecast, by Application 2019 & 2032
- Table 53: Global APAC Mobile Payments Industry Revenue Million Forecast, by Type 2019 & 2032
- Table 54: Global APAC Mobile Payments Industry Volume K Unit Forecast, by Type 2019 & 2032
- Table 55: Global APAC Mobile Payments Industry Revenue Million Forecast, by End-User Industry 2019 & 2032
- Table 56: Global APAC Mobile Payments Industry Volume K Unit Forecast, by End-User Industry 2019 & 2032
- Table 57: Global APAC Mobile Payments Industry Revenue Million Forecast, by Country 2019 & 2032
- Table 58: Global APAC Mobile Payments Industry Volume K Unit Forecast, by Country 2019 & 2032
- Table 59: United Kingdom APAC Mobile Payments Industry Revenue (Million) Forecast, by Application 2019 & 2032
- Table 60: United Kingdom APAC Mobile Payments Industry Volume (K Unit) Forecast, by Application 2019 & 2032
- Table 61: Germany APAC Mobile Payments Industry Revenue (Million) Forecast, by Application 2019 & 2032
- Table 62: Germany APAC Mobile Payments Industry Volume (K Unit) Forecast, by Application 2019 & 2032
- Table 63: France APAC Mobile Payments Industry Revenue (Million) Forecast, by Application 2019 & 2032
- Table 64: France APAC Mobile Payments Industry Volume (K Unit) Forecast, by Application 2019 & 2032
- Table 65: Italy APAC Mobile Payments Industry Revenue (Million) Forecast, by Application 2019 & 2032
- Table 66: Italy APAC Mobile Payments Industry Volume (K Unit) Forecast, by Application 2019 & 2032
- Table 67: Spain APAC Mobile Payments Industry Revenue (Million) Forecast, by Application 2019 & 2032
- Table 68: Spain APAC Mobile Payments Industry Volume (K Unit) Forecast, by Application 2019 & 2032
- Table 69: Russia APAC Mobile Payments Industry Revenue (Million) Forecast, by Application 2019 & 2032
- Table 70: Russia APAC Mobile Payments Industry Volume (K Unit) Forecast, by Application 2019 & 2032
- Table 71: Benelux APAC Mobile Payments Industry Revenue (Million) Forecast, by Application 2019 & 2032
- Table 72: Benelux APAC Mobile Payments Industry Volume (K Unit) Forecast, by Application 2019 & 2032
- Table 73: Nordics APAC Mobile Payments Industry Revenue (Million) Forecast, by Application 2019 & 2032
- Table 74: Nordics APAC Mobile Payments Industry Volume (K Unit) Forecast, by Application 2019 & 2032
- Table 75: Rest of Europe APAC Mobile Payments Industry Revenue (Million) Forecast, by Application 2019 & 2032
- Table 76: Rest of Europe APAC Mobile Payments Industry Volume (K Unit) Forecast, by Application 2019 & 2032
- Table 77: Global APAC Mobile Payments Industry Revenue Million Forecast, by Type 2019 & 2032
- Table 78: Global APAC Mobile Payments Industry Volume K Unit Forecast, by Type 2019 & 2032
- Table 79: Global APAC Mobile Payments Industry Revenue Million Forecast, by End-User Industry 2019 & 2032
- Table 80: Global APAC Mobile Payments Industry Volume K Unit Forecast, by End-User Industry 2019 & 2032
- Table 81: Global APAC Mobile Payments Industry Revenue Million Forecast, by Country 2019 & 2032
- Table 82: Global APAC Mobile Payments Industry Volume K Unit Forecast, by Country 2019 & 2032
- Table 83: Turkey APAC Mobile Payments Industry Revenue (Million) Forecast, by Application 2019 & 2032
- Table 84: Turkey APAC Mobile Payments Industry Volume (K Unit) Forecast, by Application 2019 & 2032
- Table 85: Israel APAC Mobile Payments Industry Revenue (Million) Forecast, by Application 2019 & 2032
- Table 86: Israel APAC Mobile Payments Industry Volume (K Unit) Forecast, by Application 2019 & 2032
- Table 87: GCC APAC Mobile Payments Industry Revenue (Million) Forecast, by Application 2019 & 2032
- Table 88: GCC APAC Mobile Payments Industry Volume (K Unit) Forecast, by Application 2019 & 2032
- Table 89: North Africa APAC Mobile Payments Industry Revenue (Million) Forecast, by Application 2019 & 2032
- Table 90: North Africa APAC Mobile Payments Industry Volume (K Unit) Forecast, by Application 2019 & 2032
- Table 91: South Africa APAC Mobile Payments Industry Revenue (Million) Forecast, by Application 2019 & 2032
- Table 92: South Africa APAC Mobile Payments Industry Volume (K Unit) Forecast, by Application 2019 & 2032
- Table 93: Rest of Middle East & Africa APAC Mobile Payments Industry Revenue (Million) Forecast, by Application 2019 & 2032
- Table 94: Rest of Middle East & Africa APAC Mobile Payments Industry Volume (K Unit) Forecast, by Application 2019 & 2032
- Table 95: Global APAC Mobile Payments Industry Revenue Million Forecast, by Type 2019 & 2032
- Table 96: Global APAC Mobile Payments Industry Volume K Unit Forecast, by Type 2019 & 2032
- Table 97: Global APAC Mobile Payments Industry Revenue Million Forecast, by End-User Industry 2019 & 2032
- Table 98: Global APAC Mobile Payments Industry Volume K Unit Forecast, by End-User Industry 2019 & 2032
- Table 99: Global APAC Mobile Payments Industry Revenue Million Forecast, by Country 2019 & 2032
- Table 100: Global APAC Mobile Payments Industry Volume K Unit Forecast, by Country 2019 & 2032
- Table 101: China APAC Mobile Payments Industry Revenue (Million) Forecast, by Application 2019 & 2032
- Table 102: China APAC Mobile Payments Industry Volume (K Unit) Forecast, by Application 2019 & 2032
- Table 103: India APAC Mobile Payments Industry Revenue (Million) Forecast, by Application 2019 & 2032
- Table 104: India APAC Mobile Payments Industry Volume (K Unit) Forecast, by Application 2019 & 2032
- Table 105: Japan APAC Mobile Payments Industry Revenue (Million) Forecast, by Application 2019 & 2032
- Table 106: Japan APAC Mobile Payments Industry Volume (K Unit) Forecast, by Application 2019 & 2032
- Table 107: South Korea APAC Mobile Payments Industry Revenue (Million) Forecast, by Application 2019 & 2032
- Table 108: South Korea APAC Mobile Payments Industry Volume (K Unit) Forecast, by Application 2019 & 2032
- Table 109: ASEAN APAC Mobile Payments Industry Revenue (Million) Forecast, by Application 2019 & 2032
- Table 110: ASEAN APAC Mobile Payments Industry Volume (K Unit) Forecast, by Application 2019 & 2032
- Table 111: Oceania APAC Mobile Payments Industry Revenue (Million) Forecast, by Application 2019 & 2032
- Table 112: Oceania APAC Mobile Payments Industry Volume (K Unit) Forecast, by Application 2019 & 2032
- Table 113: Rest of Asia Pacific APAC Mobile Payments Industry Revenue (Million) Forecast, by Application 2019 & 2032
- Table 114: Rest of Asia Pacific APAC Mobile Payments Industry Volume (K Unit) Forecast, by Application 2019 & 2032
Frequently Asked Questions
1. What is the projected Compound Annual Growth Rate (CAGR) of the APAC Mobile Payments Industry?
The projected CAGR is approximately 23.91%.
2. Which companies are prominent players in the APAC Mobile Payments Industry?
Key companies in the market include Visa Inc, Paypal Inc, Samsung Group, WeChat (Tencent Holdings Limited), Google LLC, Comviva Technologies Limited (A Tech Mahindra Company), Amazon com Inc, Alipay com Co Ltd, Mastercard Inc, Paytm (One97 Communications Limited), American Express Co.
3. What are the main segments of the APAC Mobile Payments Industry?
The market segments include Type, End-User Industry.
4. Can you provide details about the market size?
The market size is estimated to be USD XX Million as of 2022.
5. What are some drivers contributing to market growth?
Increasing Internet Penetration and Growing M-commerce Market.
6. What are the notable trends driving market growth?
Retail Industry is one of the Factor Driving the Market.
7. Are there any restraints impacting market growth?
Security Issues Associated with Mobile Payments.
8. Can you provide examples of recent developments in the market?
June 2022 - ComfortDelGro Taxi and Alipay+ announced a partnership that enables mobile payments from Malaysia and South Korea, namely the Touch 'n Go eWallet and Kakao Pay, to be accepted as cashless payment options in all its Comfort and CityCab taxis. Users of these mobile wallets can pay for the cab fare simply through the wallet apps without needing to exchange currency.
9. What pricing options are available for accessing the report?
Pricing options include single-user, multi-user, and enterprise licenses priced at USD 4750, USD 4950, and USD 6800 respectively.
10. Is the market size provided in terms of value or volume?
The market size is provided in terms of value, measured in Million and volume, measured in K Unit.
11. Are there any specific market keywords associated with the report?
Yes, the market keyword associated with the report is "APAC Mobile Payments Industry," which aids in identifying and referencing the specific market segment covered.
12. How do I determine which pricing option suits my needs best?
The pricing options vary based on user requirements and access needs. Individual users may opt for single-user licenses, while businesses requiring broader access may choose multi-user or enterprise licenses for cost-effective access to the report.
13. Are there any additional resources or data provided in the APAC Mobile Payments Industry report?
While the report offers comprehensive insights, it's advisable to review the specific contents or supplementary materials provided to ascertain if additional resources or data are available.
14. How can I stay updated on further developments or reports in the APAC Mobile Payments Industry?
To stay informed about further developments, trends, and reports in the APAC Mobile Payments Industry, consider subscribing to industry newsletters, following relevant companies and organizations, or regularly checking reputable industry news sources and publications.
Methodology
Step 1 - Identification of Relevant Samples Size from Population Database


Step 2 - Approaches for Defining Global Market Size (Value, Volume* & Price*)

Note*: In applicable scenarios
Step 3 - Data Sources
Primary Research
- Web Analytics
- Survey Reports
- Research Institute
- Latest Research Reports
- Opinion Leaders
Secondary Research
- Annual Reports
- White Paper
- Latest Press Release
- Industry Association
- Paid Database
- Investor Presentations

Step 4 - Data Triangulation
Involves using different sources of information in order to increase the validity of a study
These sources are likely to be stakeholders in a program - participants, other researchers, program staff, other community members, and so on.
Then we put all data in single framework & apply various statistical tools to find out the dynamic on the market.
During the analysis stage, feedback from the stakeholder groups would be compared to determine areas of agreement as well as areas of divergence
