

Key Insights
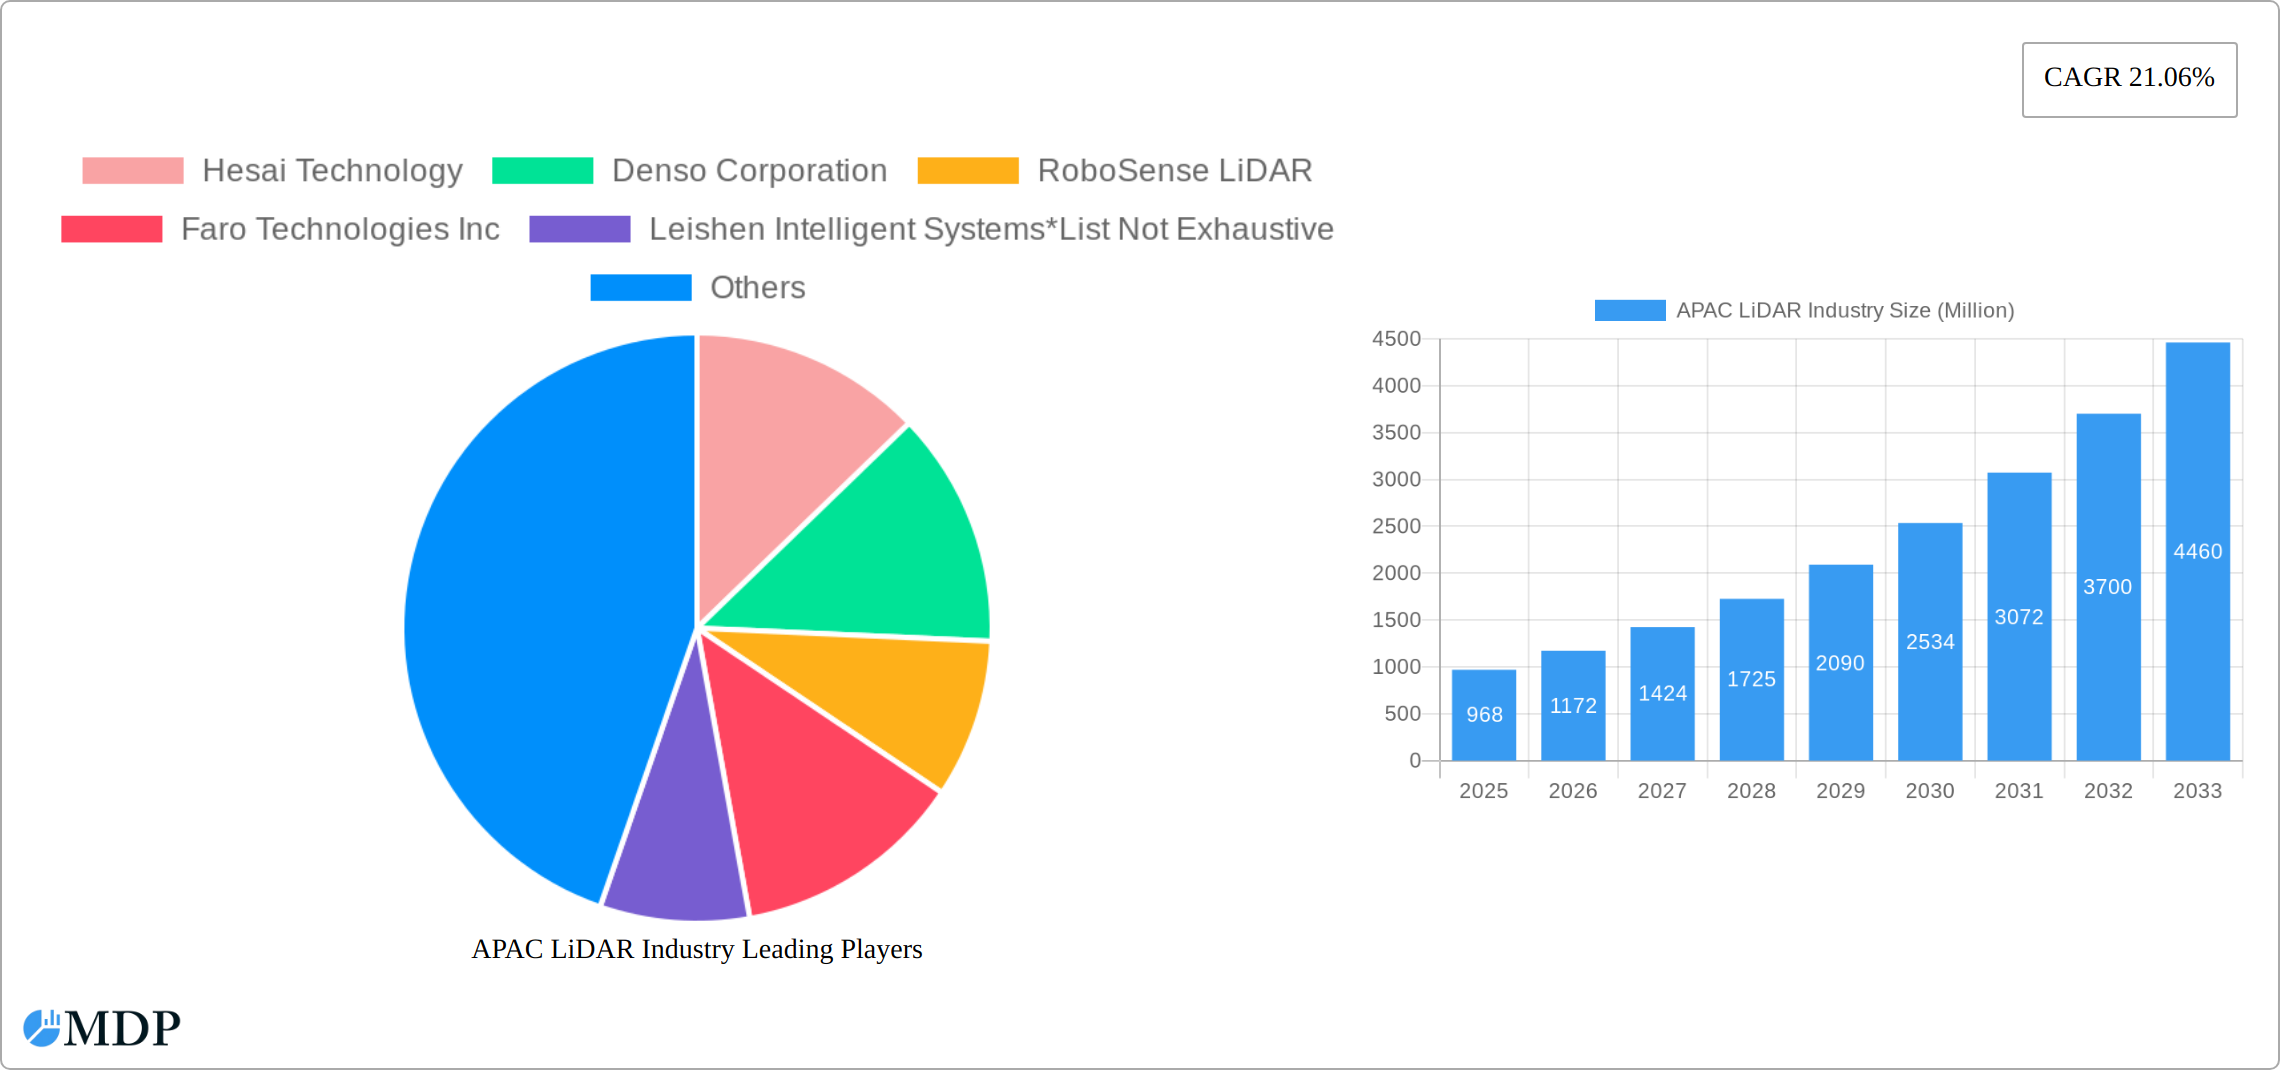
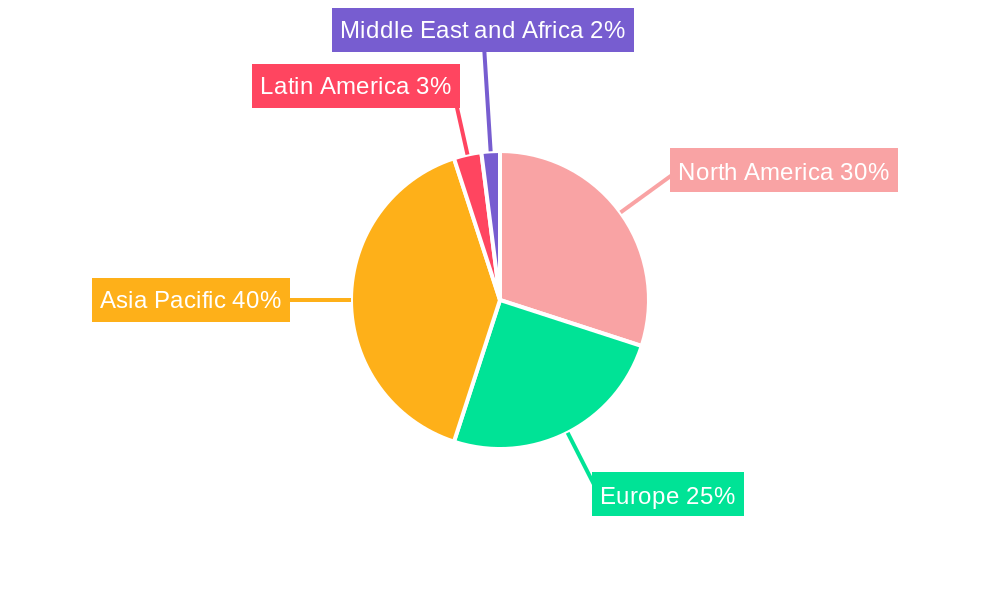
The Asia-Pacific (APAC) LiDAR market is experiencing robust growth, driven by increasing adoption across diverse sectors. The region's burgeoning automotive industry, particularly in China, Japan, and South Korea, is a significant catalyst, fueling demand for advanced driver-assistance systems (ADAS) and autonomous vehicles. Furthermore, the expanding infrastructure development initiatives across APAC nations are creating substantial opportunities for ground-based LiDAR applications in surveying, mapping, and construction. Precision agriculture is another emerging application area, with LiDAR technology enhancing crop monitoring and yield optimization. While the lack of specific regional data prevents precise quantification, considering the global CAGR of 21.06% and the APAC region's significant contribution to global economic growth, it's reasonable to project a substantial share of the global market. For example, if we assume APAC holds approximately 40% of the global LiDAR market (a conservative estimate given its size and growth potential), and the global market size in 2025 is $2.42 billion, the APAC market size in 2025 would be approximately $968 million. This figure would grow significantly over the forecast period, with a projected compound annual growth rate mirroring or exceeding the global average due to the region's unique growth drivers. The increasing availability of high-quality, cost-effective LiDAR sensors is further bolstering market expansion.
However, challenges remain. High initial investment costs for LiDAR systems can be a barrier to entry for smaller companies and developing nations. Furthermore, data processing and analysis require specialized expertise, creating a potential bottleneck in broader adoption. Despite these challenges, the long-term outlook for the APAC LiDAR market remains exceptionally positive. Continuous technological advancements, including the development of smaller, more efficient sensors, and decreasing production costs, are poised to drive wider penetration across diverse applications, making the APAC region a focal point for LiDAR industry growth in the coming decade. Government initiatives supporting technological advancements and autonomous driving further strengthen the market's future trajectory.
APAC LiDAR Industry Report: 2019-2033 - Unlocking Growth in a Transforming Market
This comprehensive report provides an in-depth analysis of the Asia-Pacific (APAC) LiDAR industry, covering market dynamics, leading players, technological advancements, and future growth opportunities. With a study period spanning 2019-2033, a base year of 2025, and a forecast period of 2025-2033, this report is an indispensable resource for industry stakeholders, investors, and strategic decision-makers. The report leverages extensive data analysis to offer actionable insights into this rapidly evolving sector. The market is projected to reach xx Million by 2033, demonstrating significant growth potential.
APAC LiDAR Industry Market Dynamics & Concentration
The APAC LiDAR market exhibits a moderately concentrated landscape, with key players like Hesai Technology, Denso Corporation, and RoboSense LiDAR holding significant market share. However, the presence of numerous smaller players and ongoing M&A activity indicates a dynamic competitive environment. Innovation is a key driver, with continuous advancements in sensor technology, processing power, and software algorithms pushing the boundaries of LiDAR applications. Stringent regulatory frameworks concerning data privacy and safety standards influence market development, particularly within the automotive sector. The market also faces competition from alternative technologies like radar and cameras, but LiDAR’s unique capabilities in high-resolution 3D imaging continue to drive its adoption. End-user trends show a growing demand across automotive, engineering, and industrial sectors, with aerospace and defense applications emerging as promising growth areas. The number of M&A deals in the APAC LiDAR market averaged xx per year during the historical period (2019-2024), indicating consolidation and strategic expansion by major players. Market share distribution in 2025 is estimated as follows: Hesai Technology (xx%), Denso Corporation (xx%), RoboSense LiDAR (xx%), Others (xx%).
APAC LiDAR Industry Industry Trends & Analysis
The APAC LiDAR industry is experiencing a period of dynamic and robust expansion, propelled by escalating demand across a diverse array of sectors. The automotive industry's unwavering commitment to advancing autonomous driving technologies serves as a paramount catalyst, complemented by the accelerating integration of LiDAR in critical domains such as high-precision mapping, advanced surveying, and sophisticated industrial automation. Significant technological disruptions, most notably the groundbreaking development of solid-state LiDAR and remarkable advancements in AI-powered data processing, are fundamentally revolutionizing the market's trajectory. Concurrently, evolving consumer preferences are increasingly gravitating towards LiDAR solutions that offer superior accuracy, extended operational range, and greater cost-effectiveness. The competitive landscape is being actively shaped by a continuous stream of innovation, strategic alliances, and impactful mergers and acquisitions. The market is on track to exhibit a Compound Annual Growth Rate (CAGR) of approximately 25-30% during the forecast period (2025-2033), with market penetration in the automotive sector anticipated to reach an impressive 60-70% by 2033.
Leading Markets & Segments in APAC LiDAR Industry
China is the dominant market in the APAC region, driven by substantial government investments in infrastructure development and autonomous vehicle technology. Other key markets include Japan, South Korea, and Singapore. Within end-user segments, the automotive sector holds the largest market share, followed by engineering and industrial applications. Regarding product types, ground-based LiDAR currently dominates, driven by its extensive use in surveying and mapping. However, the aerial LiDAR segment is expected to experience significant growth due to its increasing application in precision agriculture and urban planning. In terms of components, laser scanners are the leading segment, while the demand for GPS and Inertial Measurement Units (IMUs) is also significant.
- Key Drivers in China: Government initiatives promoting autonomous driving and smart city development; robust domestic manufacturing base; expanding infrastructure projects.
- Key Drivers in Japan: Strong automotive industry; advancements in robotics and automation; investment in high-precision mapping.
- Key Drivers in South Korea: Government support for technological innovation; advancements in semiconductor manufacturing; growth in the electronics sector.
APAP LiDAR Industry Product Developments
Recent product innovations include the development of more compact, cost-effective, and robust LiDAR sensors. Advancements in solid-state technology, higher point cloud density, and improved data processing capabilities are enhancing the performance and application range of LiDAR systems. These innovations are enabling broader adoption across various sectors, strengthening LiDAR's competitive advantage over other sensing technologies by providing greater accuracy and detail in 3D mapping and object recognition. Several companies are focusing on developing LiDAR solutions tailored to specific applications, optimizing performance and cost-effectiveness.
Key Drivers of APAC LiDAR Industry Growth
A confluence of powerful factors is propelling the APAC LiDAR industry forward. Foremost among these are groundbreaking technological advancements, including the maturation of solid-state LiDAR technology which promises increased reliability and reduced costs, alongside sophisticated improvements in processing algorithms that unlock deeper insights from collected data. Furthermore, proactive government initiatives aimed at fostering autonomous driving ecosystems and the development of smart city infrastructure are significantly stimulating demand across the region. The continuous and expansive development of infrastructure projects throughout the APAC region, from transportation networks to urban planning, inherently fuels the need for precise spatial data, thus acting as a strong market growth engine. Beyond these, the increasing adoption of LiDAR in a widening array of industries, such as advanced robotics for manufacturing and logistics, and precision agriculture for optimized crop management, further contributes substantially to its overall market expansion and diversification.
Challenges in the APAC LiDAR Industry Market
High initial investment costs for LiDAR systems can hinder broader adoption, especially in smaller businesses. Supply chain disruptions can impact the availability and cost of crucial components. Intense competition among existing and new players creates pricing pressures. Regulatory uncertainties and safety standards pose challenges, particularly in the automotive sector. These factors may slow the market's growth rate to a certain extent.
Emerging Opportunities in APAC LiDAR Industry
The APAC LiDAR industry is brimming with exciting emerging opportunities, primarily driven by the synergistic integration of LiDAR technology with cutting-edge Artificial Intelligence (AI) and machine learning capabilities. This fusion is paving the way for highly sophisticated and transformative applications, ranging from real-time object recognition and predictive analytics to enhanced environmental monitoring. Strategic partnerships and collaborative ventures between leading LiDAR manufacturers and innovative technology companies are poised to accelerate the pace of innovation, unlock new market segments, and drive significant overall market expansion. The burgeoning adoption of LiDAR in novel and rapidly growing sectors such as advanced robotics, enabling more intelligent and autonomous systems, and precision agriculture, facilitating optimized resource management and yield improvements, presents substantial long-term growth potential. Moreover, a concerted effort to expand market presence and tailor solutions for underserved or emerging markets within the vast APAC region will undoubtedly unlock further untapped growth avenues.
Leading Players in the APAC LiDAR Industry Sector
- Hesai Technology
- Denso Corporation
- RoboSense LiDAR
- Faro Technologies Inc
- Leishen Intelligent Systems
- Benewake
- Leica Geosystems AG
- Sick AG
- Trimble Inc
- Topcon Corporation
- Neptec Technologies Corp
Key Milestones in APAC LiDAR Industry Industry
- September 2023: Toshiba Corporation announced a breakthrough in LiDAR technology, achieving 99.9% accuracy in object tracking and 98.9% accuracy in object recognition using LiDAR data alone. This significantly enhances environmental robustness and expands potential applications.
- April 2023: Innoviz Technologies Ltd. signed a distribution agreement with Ascendtek Electronics Inc. to expand sales of its LiDAR solutions in Greater China.
Strategic Outlook for APAC LiDAR Industry Market
The APAC LiDAR market is strategically positioned for substantial and sustained growth, underpinned by a potent combination of rapid technological advancements, ever-increasing demand across a wide spectrum of industries, and the supportive influence of government policies and initiatives. To effectively capitalize on the immense and expanding market potential, industry players must prioritize the cultivation of strategic partnerships, invest in focused and impactful Research & Development (R&D) efforts, and proactively explore and penetrate new application areas. The continuous development and refinement of LiDAR solutions that offer enhanced performance, superior reliability, and greater cost-effectiveness will be absolutely critical in driving widespread adoption across all market segments and ultimately unlocking the full, transformative potential of this pivotal technology in shaping the future of numerous industries within the APAC region and beyond.
APAC LiDAR Industry Segmentation
-
1. Product
- 1.1. Aerial LiDAR
- 1.2. Ground-based LiDAR
-
2. Components
- 2.1. GPS
- 2.2. Laser Scanners
- 2.3. Inertial Measurement Unit
- 2.4. Other Components
-
3. End User
- 3.1. Engineering
- 3.2. Automotive
- 3.3. Industrial
- 3.4. Aerospace and Defense
APAC LiDAR Industry Segmentation By Geography
-
1. North America
- 1.1. United States
- 1.2. Canada
- 1.3. Mexico
-
2. South America
- 2.1. Brazil
- 2.2. Argentina
- 2.3. Rest of South America
-
3. Europe
- 3.1. United Kingdom
- 3.2. Germany
- 3.3. France
- 3.4. Italy
- 3.5. Spain
- 3.6. Russia
- 3.7. Benelux
- 3.8. Nordics
- 3.9. Rest of Europe
-
4. Middle East & Africa
- 4.1. Turkey
- 4.2. Israel
- 4.3. GCC
- 4.4. North Africa
- 4.5. South Africa
- 4.6. Rest of Middle East & Africa
-
5. Asia Pacific
- 5.1. China
- 5.2. India
- 5.3. Japan
- 5.4. South Korea
- 5.5. ASEAN
- 5.6. Oceania
- 5.7. Rest of Asia Pacific
APAC LiDAR Industry REPORT HIGHLIGHTS
| Aspects | Details |
|---|---|
| Study Period | 2019-2033 |
| Base Year | 2024 |
| Estimated Year | 2025 |
| Forecast Period | 2025-2033 |
| Historical Period | 2019-2024 |
| Growth Rate | CAGR of 21.06% from 2019-2033 |
| Segmentation |
|
Table of Contents
- 1. Introduction
- 1.1. Research Scope
- 1.2. Market Segmentation
- 1.3. Research Methodology
- 1.4. Definitions and Assumptions
- 2. Executive Summary
- 2.1. Introduction
- 3. Market Dynamics
- 3.1. Introduction
- 3.2. Market Drivers
- 3.2.1. Growing Applications in the Government Sector; Increasing Adoption in the Automotive Industry
- 3.3. Market Restrains
- 3.3.1. High Cost of the LiDAR Systems
- 3.4. Market Trends
- 3.4.1. Ground-based LiDAR Expected to Witness The Highest Growth
- 4. Market Factor Analysis
- 4.1. Porters Five Forces
- 4.2. Supply/Value Chain
- 4.3. PESTEL analysis
- 4.4. Market Entropy
- 4.5. Patent/Trademark Analysis
- 5. Global APAC LiDAR Industry Analysis, Insights and Forecast, 2019-2031
- 5.1. Market Analysis, Insights and Forecast - by Product
- 5.1.1. Aerial LiDAR
- 5.1.2. Ground-based LiDAR
- 5.2. Market Analysis, Insights and Forecast - by Components
- 5.2.1. GPS
- 5.2.2. Laser Scanners
- 5.2.3. Inertial Measurement Unit
- 5.2.4. Other Components
- 5.3. Market Analysis, Insights and Forecast - by End User
- 5.3.1. Engineering
- 5.3.2. Automotive
- 5.3.3. Industrial
- 5.3.4. Aerospace and Defense
- 5.4. Market Analysis, Insights and Forecast - by Region
- 5.4.1. North America
- 5.4.2. South America
- 5.4.3. Europe
- 5.4.4. Middle East & Africa
- 5.4.5. Asia Pacific
- 5.1. Market Analysis, Insights and Forecast - by Product
- 6. North America APAC LiDAR Industry Analysis, Insights and Forecast, 2019-2031
- 6.1. Market Analysis, Insights and Forecast - by Product
- 6.1.1. Aerial LiDAR
- 6.1.2. Ground-based LiDAR
- 6.2. Market Analysis, Insights and Forecast - by Components
- 6.2.1. GPS
- 6.2.2. Laser Scanners
- 6.2.3. Inertial Measurement Unit
- 6.2.4. Other Components
- 6.3. Market Analysis, Insights and Forecast - by End User
- 6.3.1. Engineering
- 6.3.2. Automotive
- 6.3.3. Industrial
- 6.3.4. Aerospace and Defense
- 6.1. Market Analysis, Insights and Forecast - by Product
- 7. South America APAC LiDAR Industry Analysis, Insights and Forecast, 2019-2031
- 7.1. Market Analysis, Insights and Forecast - by Product
- 7.1.1. Aerial LiDAR
- 7.1.2. Ground-based LiDAR
- 7.2. Market Analysis, Insights and Forecast - by Components
- 7.2.1. GPS
- 7.2.2. Laser Scanners
- 7.2.3. Inertial Measurement Unit
- 7.2.4. Other Components
- 7.3. Market Analysis, Insights and Forecast - by End User
- 7.3.1. Engineering
- 7.3.2. Automotive
- 7.3.3. Industrial
- 7.3.4. Aerospace and Defense
- 7.1. Market Analysis, Insights and Forecast - by Product
- 8. Europe APAC LiDAR Industry Analysis, Insights and Forecast, 2019-2031
- 8.1. Market Analysis, Insights and Forecast - by Product
- 8.1.1. Aerial LiDAR
- 8.1.2. Ground-based LiDAR
- 8.2. Market Analysis, Insights and Forecast - by Components
- 8.2.1. GPS
- 8.2.2. Laser Scanners
- 8.2.3. Inertial Measurement Unit
- 8.2.4. Other Components
- 8.3. Market Analysis, Insights and Forecast - by End User
- 8.3.1. Engineering
- 8.3.2. Automotive
- 8.3.3. Industrial
- 8.3.4. Aerospace and Defense
- 8.1. Market Analysis, Insights and Forecast - by Product
- 9. Middle East & Africa APAC LiDAR Industry Analysis, Insights and Forecast, 2019-2031
- 9.1. Market Analysis, Insights and Forecast - by Product
- 9.1.1. Aerial LiDAR
- 9.1.2. Ground-based LiDAR
- 9.2. Market Analysis, Insights and Forecast - by Components
- 9.2.1. GPS
- 9.2.2. Laser Scanners
- 9.2.3. Inertial Measurement Unit
- 9.2.4. Other Components
- 9.3. Market Analysis, Insights and Forecast - by End User
- 9.3.1. Engineering
- 9.3.2. Automotive
- 9.3.3. Industrial
- 9.3.4. Aerospace and Defense
- 9.1. Market Analysis, Insights and Forecast - by Product
- 10. Asia Pacific APAC LiDAR Industry Analysis, Insights and Forecast, 2019-2031
- 10.1. Market Analysis, Insights and Forecast - by Product
- 10.1.1. Aerial LiDAR
- 10.1.2. Ground-based LiDAR
- 10.2. Market Analysis, Insights and Forecast - by Components
- 10.2.1. GPS
- 10.2.2. Laser Scanners
- 10.2.3. Inertial Measurement Unit
- 10.2.4. Other Components
- 10.3. Market Analysis, Insights and Forecast - by End User
- 10.3.1. Engineering
- 10.3.2. Automotive
- 10.3.3. Industrial
- 10.3.4. Aerospace and Defense
- 10.1. Market Analysis, Insights and Forecast - by Product
- 11. North America APAC LiDAR Industry Analysis, Insights and Forecast, 2019-2031
- 11.1. Market Analysis, Insights and Forecast - By Country/Sub-region
- 11.1.1.
- 12. Europe APAC LiDAR Industry Analysis, Insights and Forecast, 2019-2031
- 12.1. Market Analysis, Insights and Forecast - By Country/Sub-region
- 12.1.1.
- 13. Asia Pacific APAC LiDAR Industry Analysis, Insights and Forecast, 2019-2031
- 13.1. Market Analysis, Insights and Forecast - By Country/Sub-region
- 13.1.1.
- 14. Latin America APAC LiDAR Industry Analysis, Insights and Forecast, 2019-2031
- 14.1. Market Analysis, Insights and Forecast - By Country/Sub-region
- 14.1.1.
- 15. Middle East and Africa APAC LiDAR Industry Analysis, Insights and Forecast, 2019-2031
- 15.1. Market Analysis, Insights and Forecast - By Country/Sub-region
- 15.1.1.
- 16. Competitive Analysis
- 16.1. Global Market Share Analysis 2024
- 16.2. Company Profiles
- 16.2.1 Hesai Technology
- 16.2.1.1. Overview
- 16.2.1.2. Products
- 16.2.1.3. SWOT Analysis
- 16.2.1.4. Recent Developments
- 16.2.1.5. Financials (Based on Availability)
- 16.2.2 Denso Corporation
- 16.2.2.1. Overview
- 16.2.2.2. Products
- 16.2.2.3. SWOT Analysis
- 16.2.2.4. Recent Developments
- 16.2.2.5. Financials (Based on Availability)
- 16.2.3 RoboSense LiDAR
- 16.2.3.1. Overview
- 16.2.3.2. Products
- 16.2.3.3. SWOT Analysis
- 16.2.3.4. Recent Developments
- 16.2.3.5. Financials (Based on Availability)
- 16.2.4 Faro Technologies Inc
- 16.2.4.1. Overview
- 16.2.4.2. Products
- 16.2.4.3. SWOT Analysis
- 16.2.4.4. Recent Developments
- 16.2.4.5. Financials (Based on Availability)
- 16.2.5 Leishen Intelligent Systems*List Not Exhaustive
- 16.2.5.1. Overview
- 16.2.5.2. Products
- 16.2.5.3. SWOT Analysis
- 16.2.5.4. Recent Developments
- 16.2.5.5. Financials (Based on Availability)
- 16.2.6 Benewake
- 16.2.6.1. Overview
- 16.2.6.2. Products
- 16.2.6.3. SWOT Analysis
- 16.2.6.4. Recent Developments
- 16.2.6.5. Financials (Based on Availability)
- 16.2.7 Leica Geosystems AG
- 16.2.7.1. Overview
- 16.2.7.2. Products
- 16.2.7.3. SWOT Analysis
- 16.2.7.4. Recent Developments
- 16.2.7.5. Financials (Based on Availability)
- 16.2.8 Sick AG
- 16.2.8.1. Overview
- 16.2.8.2. Products
- 16.2.8.3. SWOT Analysis
- 16.2.8.4. Recent Developments
- 16.2.8.5. Financials (Based on Availability)
- 16.2.9 Trimble Inc
- 16.2.9.1. Overview
- 16.2.9.2. Products
- 16.2.9.3. SWOT Analysis
- 16.2.9.4. Recent Developments
- 16.2.9.5. Financials (Based on Availability)
- 16.2.10 Topcon Corporation
- 16.2.10.1. Overview
- 16.2.10.2. Products
- 16.2.10.3. SWOT Analysis
- 16.2.10.4. Recent Developments
- 16.2.10.5. Financials (Based on Availability)
- 16.2.11 Neptec Technologies Corp
- 16.2.11.1. Overview
- 16.2.11.2. Products
- 16.2.11.3. SWOT Analysis
- 16.2.11.4. Recent Developments
- 16.2.11.5. Financials (Based on Availability)
- 16.2.1 Hesai Technology
List of Figures
- Figure 1: Global APAC LiDAR Industry Revenue Breakdown (Million, %) by Region 2024 & 2032
- Figure 2: North America APAC LiDAR Industry Revenue (Million), by Country 2024 & 2032
- Figure 3: North America APAC LiDAR Industry Revenue Share (%), by Country 2024 & 2032
- Figure 4: Europe APAC LiDAR Industry Revenue (Million), by Country 2024 & 2032
- Figure 5: Europe APAC LiDAR Industry Revenue Share (%), by Country 2024 & 2032
- Figure 6: Asia Pacific APAC LiDAR Industry Revenue (Million), by Country 2024 & 2032
- Figure 7: Asia Pacific APAC LiDAR Industry Revenue Share (%), by Country 2024 & 2032
- Figure 8: Latin America APAC LiDAR Industry Revenue (Million), by Country 2024 & 2032
- Figure 9: Latin America APAC LiDAR Industry Revenue Share (%), by Country 2024 & 2032
- Figure 10: Middle East and Africa APAC LiDAR Industry Revenue (Million), by Country 2024 & 2032
- Figure 11: Middle East and Africa APAC LiDAR Industry Revenue Share (%), by Country 2024 & 2032
- Figure 12: North America APAC LiDAR Industry Revenue (Million), by Product 2024 & 2032
- Figure 13: North America APAC LiDAR Industry Revenue Share (%), by Product 2024 & 2032
- Figure 14: North America APAC LiDAR Industry Revenue (Million), by Components 2024 & 2032
- Figure 15: North America APAC LiDAR Industry Revenue Share (%), by Components 2024 & 2032
- Figure 16: North America APAC LiDAR Industry Revenue (Million), by End User 2024 & 2032
- Figure 17: North America APAC LiDAR Industry Revenue Share (%), by End User 2024 & 2032
- Figure 18: North America APAC LiDAR Industry Revenue (Million), by Country 2024 & 2032
- Figure 19: North America APAC LiDAR Industry Revenue Share (%), by Country 2024 & 2032
- Figure 20: South America APAC LiDAR Industry Revenue (Million), by Product 2024 & 2032
- Figure 21: South America APAC LiDAR Industry Revenue Share (%), by Product 2024 & 2032
- Figure 22: South America APAC LiDAR Industry Revenue (Million), by Components 2024 & 2032
- Figure 23: South America APAC LiDAR Industry Revenue Share (%), by Components 2024 & 2032
- Figure 24: South America APAC LiDAR Industry Revenue (Million), by End User 2024 & 2032
- Figure 25: South America APAC LiDAR Industry Revenue Share (%), by End User 2024 & 2032
- Figure 26: South America APAC LiDAR Industry Revenue (Million), by Country 2024 & 2032
- Figure 27: South America APAC LiDAR Industry Revenue Share (%), by Country 2024 & 2032
- Figure 28: Europe APAC LiDAR Industry Revenue (Million), by Product 2024 & 2032
- Figure 29: Europe APAC LiDAR Industry Revenue Share (%), by Product 2024 & 2032
- Figure 30: Europe APAC LiDAR Industry Revenue (Million), by Components 2024 & 2032
- Figure 31: Europe APAC LiDAR Industry Revenue Share (%), by Components 2024 & 2032
- Figure 32: Europe APAC LiDAR Industry Revenue (Million), by End User 2024 & 2032
- Figure 33: Europe APAC LiDAR Industry Revenue Share (%), by End User 2024 & 2032
- Figure 34: Europe APAC LiDAR Industry Revenue (Million), by Country 2024 & 2032
- Figure 35: Europe APAC LiDAR Industry Revenue Share (%), by Country 2024 & 2032
- Figure 36: Middle East & Africa APAC LiDAR Industry Revenue (Million), by Product 2024 & 2032
- Figure 37: Middle East & Africa APAC LiDAR Industry Revenue Share (%), by Product 2024 & 2032
- Figure 38: Middle East & Africa APAC LiDAR Industry Revenue (Million), by Components 2024 & 2032
- Figure 39: Middle East & Africa APAC LiDAR Industry Revenue Share (%), by Components 2024 & 2032
- Figure 40: Middle East & Africa APAC LiDAR Industry Revenue (Million), by End User 2024 & 2032
- Figure 41: Middle East & Africa APAC LiDAR Industry Revenue Share (%), by End User 2024 & 2032
- Figure 42: Middle East & Africa APAC LiDAR Industry Revenue (Million), by Country 2024 & 2032
- Figure 43: Middle East & Africa APAC LiDAR Industry Revenue Share (%), by Country 2024 & 2032
- Figure 44: Asia Pacific APAC LiDAR Industry Revenue (Million), by Product 2024 & 2032
- Figure 45: Asia Pacific APAC LiDAR Industry Revenue Share (%), by Product 2024 & 2032
- Figure 46: Asia Pacific APAC LiDAR Industry Revenue (Million), by Components 2024 & 2032
- Figure 47: Asia Pacific APAC LiDAR Industry Revenue Share (%), by Components 2024 & 2032
- Figure 48: Asia Pacific APAC LiDAR Industry Revenue (Million), by End User 2024 & 2032
- Figure 49: Asia Pacific APAC LiDAR Industry Revenue Share (%), by End User 2024 & 2032
- Figure 50: Asia Pacific APAC LiDAR Industry Revenue (Million), by Country 2024 & 2032
- Figure 51: Asia Pacific APAC LiDAR Industry Revenue Share (%), by Country 2024 & 2032
List of Tables
- Table 1: Global APAC LiDAR Industry Revenue Million Forecast, by Region 2019 & 2032
- Table 2: Global APAC LiDAR Industry Revenue Million Forecast, by Product 2019 & 2032
- Table 3: Global APAC LiDAR Industry Revenue Million Forecast, by Components 2019 & 2032
- Table 4: Global APAC LiDAR Industry Revenue Million Forecast, by End User 2019 & 2032
- Table 5: Global APAC LiDAR Industry Revenue Million Forecast, by Region 2019 & 2032
- Table 6: Global APAC LiDAR Industry Revenue Million Forecast, by Country 2019 & 2032
- Table 7: APAC LiDAR Industry Revenue (Million) Forecast, by Application 2019 & 2032
- Table 8: Global APAC LiDAR Industry Revenue Million Forecast, by Country 2019 & 2032
- Table 9: APAC LiDAR Industry Revenue (Million) Forecast, by Application 2019 & 2032
- Table 10: Global APAC LiDAR Industry Revenue Million Forecast, by Country 2019 & 2032
- Table 11: APAC LiDAR Industry Revenue (Million) Forecast, by Application 2019 & 2032
- Table 12: Global APAC LiDAR Industry Revenue Million Forecast, by Country 2019 & 2032
- Table 13: APAC LiDAR Industry Revenue (Million) Forecast, by Application 2019 & 2032
- Table 14: Global APAC LiDAR Industry Revenue Million Forecast, by Country 2019 & 2032
- Table 15: APAC LiDAR Industry Revenue (Million) Forecast, by Application 2019 & 2032
- Table 16: Global APAC LiDAR Industry Revenue Million Forecast, by Product 2019 & 2032
- Table 17: Global APAC LiDAR Industry Revenue Million Forecast, by Components 2019 & 2032
- Table 18: Global APAC LiDAR Industry Revenue Million Forecast, by End User 2019 & 2032
- Table 19: Global APAC LiDAR Industry Revenue Million Forecast, by Country 2019 & 2032
- Table 20: United States APAC LiDAR Industry Revenue (Million) Forecast, by Application 2019 & 2032
- Table 21: Canada APAC LiDAR Industry Revenue (Million) Forecast, by Application 2019 & 2032
- Table 22: Mexico APAC LiDAR Industry Revenue (Million) Forecast, by Application 2019 & 2032
- Table 23: Global APAC LiDAR Industry Revenue Million Forecast, by Product 2019 & 2032
- Table 24: Global APAC LiDAR Industry Revenue Million Forecast, by Components 2019 & 2032
- Table 25: Global APAC LiDAR Industry Revenue Million Forecast, by End User 2019 & 2032
- Table 26: Global APAC LiDAR Industry Revenue Million Forecast, by Country 2019 & 2032
- Table 27: Brazil APAC LiDAR Industry Revenue (Million) Forecast, by Application 2019 & 2032
- Table 28: Argentina APAC LiDAR Industry Revenue (Million) Forecast, by Application 2019 & 2032
- Table 29: Rest of South America APAC LiDAR Industry Revenue (Million) Forecast, by Application 2019 & 2032
- Table 30: Global APAC LiDAR Industry Revenue Million Forecast, by Product 2019 & 2032
- Table 31: Global APAC LiDAR Industry Revenue Million Forecast, by Components 2019 & 2032
- Table 32: Global APAC LiDAR Industry Revenue Million Forecast, by End User 2019 & 2032
- Table 33: Global APAC LiDAR Industry Revenue Million Forecast, by Country 2019 & 2032
- Table 34: United Kingdom APAC LiDAR Industry Revenue (Million) Forecast, by Application 2019 & 2032
- Table 35: Germany APAC LiDAR Industry Revenue (Million) Forecast, by Application 2019 & 2032
- Table 36: France APAC LiDAR Industry Revenue (Million) Forecast, by Application 2019 & 2032
- Table 37: Italy APAC LiDAR Industry Revenue (Million) Forecast, by Application 2019 & 2032
- Table 38: Spain APAC LiDAR Industry Revenue (Million) Forecast, by Application 2019 & 2032
- Table 39: Russia APAC LiDAR Industry Revenue (Million) Forecast, by Application 2019 & 2032
- Table 40: Benelux APAC LiDAR Industry Revenue (Million) Forecast, by Application 2019 & 2032
- Table 41: Nordics APAC LiDAR Industry Revenue (Million) Forecast, by Application 2019 & 2032
- Table 42: Rest of Europe APAC LiDAR Industry Revenue (Million) Forecast, by Application 2019 & 2032
- Table 43: Global APAC LiDAR Industry Revenue Million Forecast, by Product 2019 & 2032
- Table 44: Global APAC LiDAR Industry Revenue Million Forecast, by Components 2019 & 2032
- Table 45: Global APAC LiDAR Industry Revenue Million Forecast, by End User 2019 & 2032
- Table 46: Global APAC LiDAR Industry Revenue Million Forecast, by Country 2019 & 2032
- Table 47: Turkey APAC LiDAR Industry Revenue (Million) Forecast, by Application 2019 & 2032
- Table 48: Israel APAC LiDAR Industry Revenue (Million) Forecast, by Application 2019 & 2032
- Table 49: GCC APAC LiDAR Industry Revenue (Million) Forecast, by Application 2019 & 2032
- Table 50: North Africa APAC LiDAR Industry Revenue (Million) Forecast, by Application 2019 & 2032
- Table 51: South Africa APAC LiDAR Industry Revenue (Million) Forecast, by Application 2019 & 2032
- Table 52: Rest of Middle East & Africa APAC LiDAR Industry Revenue (Million) Forecast, by Application 2019 & 2032
- Table 53: Global APAC LiDAR Industry Revenue Million Forecast, by Product 2019 & 2032
- Table 54: Global APAC LiDAR Industry Revenue Million Forecast, by Components 2019 & 2032
- Table 55: Global APAC LiDAR Industry Revenue Million Forecast, by End User 2019 & 2032
- Table 56: Global APAC LiDAR Industry Revenue Million Forecast, by Country 2019 & 2032
- Table 57: China APAC LiDAR Industry Revenue (Million) Forecast, by Application 2019 & 2032
- Table 58: India APAC LiDAR Industry Revenue (Million) Forecast, by Application 2019 & 2032
- Table 59: Japan APAC LiDAR Industry Revenue (Million) Forecast, by Application 2019 & 2032
- Table 60: South Korea APAC LiDAR Industry Revenue (Million) Forecast, by Application 2019 & 2032
- Table 61: ASEAN APAC LiDAR Industry Revenue (Million) Forecast, by Application 2019 & 2032
- Table 62: Oceania APAC LiDAR Industry Revenue (Million) Forecast, by Application 2019 & 2032
- Table 63: Rest of Asia Pacific APAC LiDAR Industry Revenue (Million) Forecast, by Application 2019 & 2032
Frequently Asked Questions
1. What is the projected Compound Annual Growth Rate (CAGR) of the APAC LiDAR Industry?
The projected CAGR is approximately 21.06%.
2. Which companies are prominent players in the APAC LiDAR Industry?
Key companies in the market include Hesai Technology, Denso Corporation, RoboSense LiDAR, Faro Technologies Inc, Leishen Intelligent Systems*List Not Exhaustive, Benewake, Leica Geosystems AG, Sick AG, Trimble Inc, Topcon Corporation, Neptec Technologies Corp.
3. What are the main segments of the APAC LiDAR Industry?
The market segments include Product, Components, End User.
4. Can you provide details about the market size?
The market size is estimated to be USD 2.42 Million as of 2022.
5. What are some drivers contributing to market growth?
Growing Applications in the Government Sector; Increasing Adoption in the Automotive Industry.
6. What are the notable trends driving market growth?
Ground-based LiDAR Expected to Witness The Highest Growth.
7. Are there any restraints impacting market growth?
High Cost of the LiDAR Systems.
8. Can you provide examples of recent developments in the market?
September 2023: Toshiba Corporation announced the development of world-first advances in LiDAR technologies that secure an unmatched accuracy of 99.9% in object tracking and object recognition of 98.9% with data acquired by the LiDAR alone. The technologies also significantly improve the environmental robustness and the potential for LiDAR in many applications.
9. What pricing options are available for accessing the report?
Pricing options include single-user, multi-user, and enterprise licenses priced at USD 3800, USD 4500, and USD 5800 respectively.
10. Is the market size provided in terms of value or volume?
The market size is provided in terms of value, measured in Million.
11. Are there any specific market keywords associated with the report?
Yes, the market keyword associated with the report is "APAC LiDAR Industry," which aids in identifying and referencing the specific market segment covered.
12. How do I determine which pricing option suits my needs best?
The pricing options vary based on user requirements and access needs. Individual users may opt for single-user licenses, while businesses requiring broader access may choose multi-user or enterprise licenses for cost-effective access to the report.
13. Are there any additional resources or data provided in the APAC LiDAR Industry report?
While the report offers comprehensive insights, it's advisable to review the specific contents or supplementary materials provided to ascertain if additional resources or data are available.
14. How can I stay updated on further developments or reports in the APAC LiDAR Industry?
To stay informed about further developments, trends, and reports in the APAC LiDAR Industry, consider subscribing to industry newsletters, following relevant companies and organizations, or regularly checking reputable industry news sources and publications.
Methodology
Step 1 - Identification of Relevant Samples Size from Population Database


Step 2 - Approaches for Defining Global Market Size (Value, Volume* & Price*)

Note*: In applicable scenarios
Step 3 - Data Sources
Primary Research
- Web Analytics
- Survey Reports
- Research Institute
- Latest Research Reports
- Opinion Leaders
Secondary Research
- Annual Reports
- White Paper
- Latest Press Release
- Industry Association
- Paid Database
- Investor Presentations

Step 4 - Data Triangulation
Involves using different sources of information in order to increase the validity of a study
These sources are likely to be stakeholders in a program - participants, other researchers, program staff, other community members, and so on.
Then we put all data in single framework & apply various statistical tools to find out the dynamic on the market.
During the analysis stage, feedback from the stakeholder groups would be compared to determine areas of agreement as well as areas of divergence
