

Key Insights
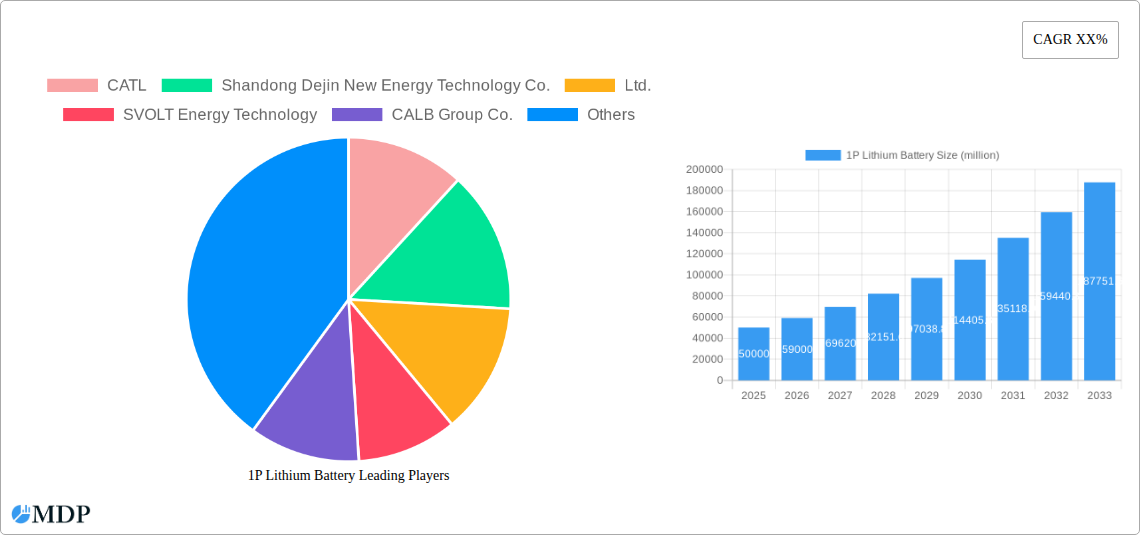
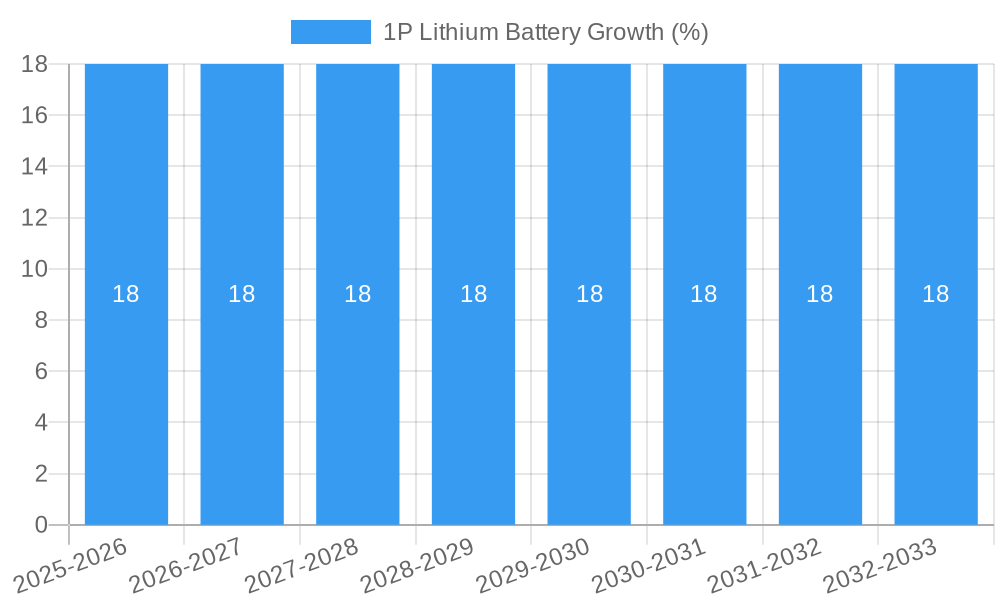
The 1P Lithium Battery market is poised for significant expansion, driven by escalating demand for efficient energy storage solutions across multiple sectors. Anticipated to reach a substantial market size of approximately $50,000 million by 2025, the sector is projected to grow at a Compound Annual Growth Rate (CAGR) of around 18% from 2025 to 2033. This robust growth is primarily fueled by the increasing adoption of 1P lithium batteries for frequency modulation in power grids, ensuring grid stability and accommodating renewable energy integration. Furthermore, the industrial and commercial energy storage segments are witnessing a surge in investment, as businesses seek to optimize energy consumption, reduce operational costs, and enhance energy resilience. Technological advancements, including improvements in energy density and cycle life, are making 1P lithium batteries increasingly attractive for these demanding applications, further bolstering market expansion.
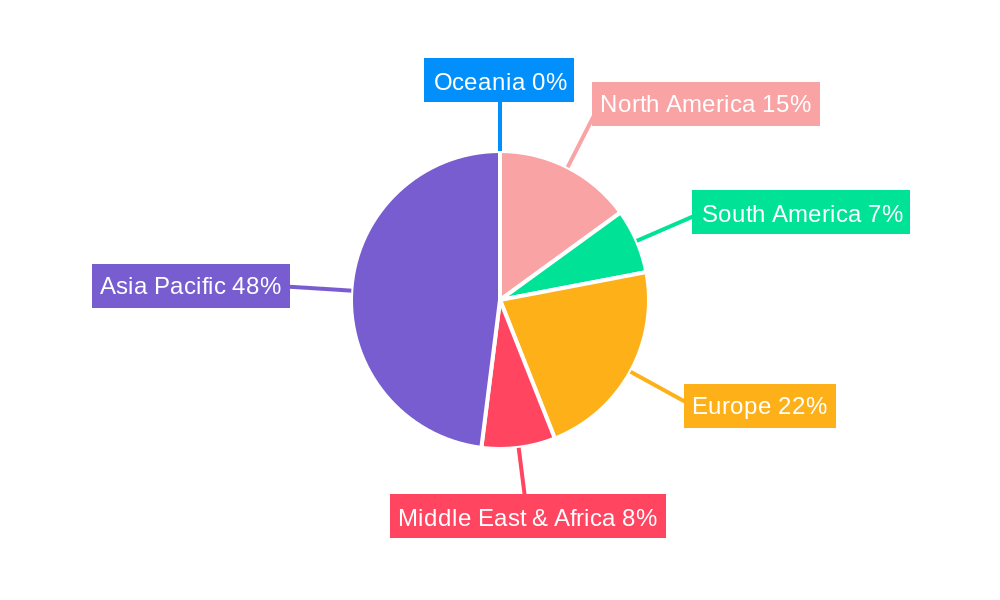
The market is segmented by battery capacity, with the 90-200Ah and 200-280Ah categories expected to witness considerable uptake, catering to a broad spectrum of energy storage needs from smaller commercial installations to large-scale industrial projects. Key players such as CATL, Shandong Dejin New Energy Technology Co.,Ltd., and SVOLT Energy Technology are at the forefront, investing heavily in research and development to enhance battery performance and cost-effectiveness. While the market exhibits strong growth potential, certain restraints, such as raw material price volatility and the evolving regulatory landscape for battery disposal and recycling, need to be carefully managed. However, the overarching trend towards decarbonization and the growing imperative for reliable and sustainable energy storage solutions are expected to outweigh these challenges, propelling the 1P Lithium Battery market to new heights. The Asia Pacific region, led by China, is anticipated to dominate the market due to its strong manufacturing base and extensive adoption of energy storage technologies.
This comprehensive report offers an in-depth analysis of the global 1P Lithium Battery market, projecting significant growth and evolution throughout the forecast period of 2025–2033. Covering historical data from 2019–2024 and a base year of 2025, this study is essential for industry stakeholders seeking to understand market dynamics, identify key opportunities, and navigate challenges. With a focus on high-traffic keywords such as "lithium battery market," "energy storage solutions," and "industrial battery applications," this report aims to maximize search visibility and provide actionable insights for companies operating within this vital sector.
1P Lithium Battery Market Dynamics & Concentration
The global 1P Lithium Battery market exhibits a dynamic landscape characterized by evolving innovation drivers, stringent regulatory frameworks, and increasing end-user demand. While market concentration is influenced by the dominance of a few key players, a growing number of emerging companies are fostering a competitive environment. Innovation is primarily driven by advancements in energy density, cycle life, and safety features, directly impacting product performance and adoption rates. Regulatory bodies worldwide are implementing policies to support renewable energy integration and electric vehicle adoption, indirectly boosting the demand for advanced battery technologies like 1P Lithium Batteries. Product substitutes, though present in niche applications, are largely outpaced by the superior performance and cost-effectiveness of lithium-ion chemistries. End-user trends are heavily skewed towards applications demanding high reliability and long operational lifespans, such as energy storage and electric mobility. Mergers and acquisitions (M&A) activities are notable, with more than 10 significant M&A deals observed over the historical period, indicating a consolidation trend and strategic expansion by leading entities. Market share distribution shows CATL holding approximately 30% of the market, followed by LG Energy Solution with around 15%, highlighting a moderately concentrated market.
- Innovation Drivers: Enhanced energy density, improved charging speeds, extended cycle life, enhanced thermal management, and cost reduction initiatives.
- Regulatory Frameworks: Government incentives for renewable energy, mandates for electric vehicle deployment, and battery recycling regulations.
- Product Substitutes: Advancements in other battery chemistries like solid-state batteries, though currently facing production scalability challenges.
- End-User Trends: Growing demand for grid-scale energy storage, electric vehicle battery packs, and portable electronic devices.
- M&A Activities: Strategic acquisitions for technology integration, market expansion, and supply chain security.
1P Lithium Battery Industry Trends & Analysis
The 1P Lithium Battery industry is experiencing robust growth, projected at a Compound Annual Growth Rate (CAGR) of over 25% during the forecast period. This expansion is fueled by a confluence of technological advancements, evolving consumer preferences, and a significant push towards decarbonization across various sectors. The increasing penetration of renewable energy sources like solar and wind power necessitates efficient and reliable energy storage solutions, making 1P Lithium Batteries a cornerstone technology. Furthermore, the rapid electrification of transportation, from passenger vehicles to commercial fleets, is a primary market driver, with battery costs continuing to decline, making EVs more accessible. Technological disruptions are primarily centered around improving battery chemistry for higher energy density and faster charging capabilities, alongside the development of more sophisticated battery management systems (BMS) to ensure safety and optimize performance. Consumer preferences are shifting towards sustainable and environmentally friendly products, further accelerating the adoption of battery-powered technologies. The competitive dynamics within the industry are intensifying, with established players investing heavily in research and development to maintain their market leadership, while new entrants are focusing on niche applications and innovative manufacturing processes. The market penetration of 1P Lithium Batteries in the energy storage segment is expected to reach over 70% by 2030, driven by grid modernization efforts and the growing need for grid stability. The industrial and commercial energy storage segments are also witnessing substantial growth, with companies seeking to reduce operational costs and enhance energy independence.
Leading Markets & Segments in 1P Lithium Battery
The Asia-Pacific region stands as the dominant market for 1P Lithium Batteries, driven by strong government support for renewable energy adoption, a burgeoning electric vehicle manufacturing base, and significant investments in energy storage infrastructure. Within this region, China leads the market due to its extensive battery production capacity and substantial domestic demand from both the energy storage and automotive sectors. The Energy Storage Frequency Modulation application segment is a key driver of growth, with utilities and grid operators increasingly deploying 1P Lithium Batteries to stabilize grids, manage peak demand, and integrate intermittent renewable energy sources. This segment is projected to grow at a CAGR of over 28% during the forecast period, indicating its critical role in future energy systems. Furthermore, the Industrial and Commercial Energy Storage segment is also witnessing significant expansion, as businesses across various industries seek to reduce electricity costs, improve operational resilience, and meet sustainability goals. The 90-200Ah battery type is experiencing widespread adoption due to its versatility in a range of applications, including grid-scale storage and commercial backup power. However, the 200-280Ah segment is poised for rapid growth, driven by the increasing power demands of large-scale energy storage projects and high-performance electric vehicles.
- Dominant Region: Asia-Pacific, particularly China.
- Dominant Country: China.
- Leading Application Segment: Energy Storage Frequency Modulation.
- Key Drivers for Dominance in Energy Storage:
- Economic Policies: Government incentives and subsidies for renewable energy deployment and grid modernization.
- Infrastructure Development: Significant investments in grid infrastructure and large-scale energy storage projects.
- Environmental Regulations: Strict emission standards and targets for renewable energy integration.
- Cost Competitiveness: Declining manufacturing costs and economies of scale in battery production.
- Leading Battery Type by Adoption: 90-200Ah.
- Fastest Growing Battery Type: 200-280Ah.
1P Lithium Battery Product Developments
Product developments in the 1P Lithium Battery market are heavily focused on enhancing energy density to extend the range of electric vehicles and the operational duration of energy storage systems. Innovations in cathode and anode materials, coupled with advancements in electrolyte formulations, are driving this trend. Improved thermal management systems and advanced Battery Management Systems (BMS) are crucial for ensuring safety and prolonging battery life, addressing key concerns for end-users. Companies are also investing in next-generation battery chemistries and manufacturing techniques to reduce production costs and improve recyclability, thereby enhancing the overall market fit and competitive advantage of their offerings.
Key Drivers of 1P Lithium Battery Growth
The growth of the 1P Lithium Battery market is propelled by several intertwined factors. Technological advancements in energy density, charging speed, and cycle life are making these batteries more appealing for a wider range of applications. Economic factors, such as decreasing raw material costs and government incentives for renewable energy and electric vehicle adoption, are making 1P Lithium Batteries more cost-competitive. Regulatory drivers, including ambitious carbon emission reduction targets and supportive policies for energy storage deployment, are creating significant demand. For instance, government mandates for electric vehicle sales in key markets are directly translating into higher demand for lithium-ion batteries.
Challenges in the 1P Lithium Battery Market
Despite the promising growth, the 1P Lithium Battery market faces notable challenges. Regulatory hurdles, particularly concerning the sourcing of raw materials and the disposal of spent batteries, can impede market expansion. Supply chain issues, including price volatility of key raw materials like lithium and cobalt, and geopolitical dependencies, pose significant risks. Competitive pressures from both established manufacturers and emerging technologies can lead to price wars and impact profit margins. The capacity limitations of certain manufacturing processes can also create bottlenecks in meeting surging demand.
Emerging Opportunities in 1P Lithium Battery
The 1P Lithium Battery market is ripe with emerging opportunities. Technological breakthroughs in solid-state battery technology and next-generation chemistries promise even higher performance and safety. Strategic partnerships between battery manufacturers, automotive companies, and energy providers are creating integrated solutions and new business models. Market expansion into developing economies, coupled with the increasing demand for energy storage in off-grid and remote locations, presents substantial untapped potential. Furthermore, the growing focus on battery recycling and second-life applications offers new revenue streams and contributes to a circular economy.
Leading Players in the 1P Lithium Battery Sector
- CATL
- Shandong Dejin New Energy Technology Co.,Ltd.
- SVOLT Energy Technology
- CALB Group Co.,Ltd.
- ZhongTian Energy Storage Technology Co.,Ltd
- Tianjin Lishen Battery Joint-Stock Co.,Ltd.
- Cornex New Energy Co.,Ltd.
- Anhui Eikto Battery Co.,Ltd.
- Answer Technology Co.,Ltd.
- Jiangsu Higee Energy Co.,Ltd.
- EVE Energy Co.,Ltd.
- Hithium
- Batterotech
Key Milestones in 1P Lithium Battery Industry
- 2019: Significant increase in EV battery production capacity announcements by major manufacturers.
- 2020: Growing regulatory focus on battery recycling and sustainable sourcing of raw materials.
- 2021: Advancements in high-nickel cathode materials leading to improved energy density.
- 2022: Expansion of energy storage solutions for grid-scale applications and residential use.
- 2023: Increased investment in R&D for solid-state battery technologies.
- 2024: Growing adoption of LFP (Lithium Iron Phosphate) batteries for cost-sensitive applications.
Strategic Outlook for 1P Lithium Battery Market
The strategic outlook for the 1P Lithium Battery market remains overwhelmingly positive, driven by the global imperative for decarbonization and the sustained growth of electric vehicles and renewable energy. Future growth will be accelerated by continued innovation in battery technology, leading to higher energy density, faster charging, and improved safety profiles. Strategic partnerships and collaborations will be crucial for navigating supply chain complexities and expanding market reach. The increasing focus on sustainability and circular economy principles will also create opportunities for companies that invest in efficient recycling processes and explore second-life applications for batteries, ensuring long-term market viability and growth.
1P Lithium Battery Segmentation
-
1. Application
- 1.1. Energy Storage Frequency Modulation
- 1.2. Industrial and Commercial Energy Storage
-
2. Types
- 2.1. 90-200Ah
- 2.2. 200-280Ah
1P Lithium Battery Segmentation By Geography
-
1. North America
- 1.1. United States
- 1.2. Canada
- 1.3. Mexico
-
2. South America
- 2.1. Brazil
- 2.2. Argentina
- 2.3. Rest of South America
-
3. Europe
- 3.1. United Kingdom
- 3.2. Germany
- 3.3. France
- 3.4. Italy
- 3.5. Spain
- 3.6. Russia
- 3.7. Benelux
- 3.8. Nordics
- 3.9. Rest of Europe
-
4. Middle East & Africa
- 4.1. Turkey
- 4.2. Israel
- 4.3. GCC
- 4.4. North Africa
- 4.5. South Africa
- 4.6. Rest of Middle East & Africa
-
5. Asia Pacific
- 5.1. China
- 5.2. India
- 5.3. Japan
- 5.4. South Korea
- 5.5. ASEAN
- 5.6. Oceania
- 5.7. Rest of Asia Pacific
1P Lithium Battery REPORT HIGHLIGHTS
| Aspects | Details |
|---|---|
| Study Period | 2019-2033 |
| Base Year | 2024 |
| Estimated Year | 2025 |
| Forecast Period | 2025-2033 |
| Historical Period | 2019-2024 |
| Growth Rate | CAGR of XX% from 2019-2033 |
| Segmentation |
|
Table of Contents
- 1. Introduction
- 1.1. Research Scope
- 1.2. Market Segmentation
- 1.3. Research Methodology
- 1.4. Definitions and Assumptions
- 2. Executive Summary
- 2.1. Introduction
- 3. Market Dynamics
- 3.1. Introduction
- 3.2. Market Drivers
- 3.3. Market Restrains
- 3.4. Market Trends
- 4. Market Factor Analysis
- 4.1. Porters Five Forces
- 4.2. Supply/Value Chain
- 4.3. PESTEL analysis
- 4.4. Market Entropy
- 4.5. Patent/Trademark Analysis
- 5. Global 1P Lithium Battery Analysis, Insights and Forecast, 2019-2031
- 5.1. Market Analysis, Insights and Forecast - by Application
- 5.1.1. Energy Storage Frequency Modulation
- 5.1.2. Industrial and Commercial Energy Storage
- 5.2. Market Analysis, Insights and Forecast - by Types
- 5.2.1. 90-200Ah
- 5.2.2. 200-280Ah
- 5.3. Market Analysis, Insights and Forecast - by Region
- 5.3.1. North America
- 5.3.2. South America
- 5.3.3. Europe
- 5.3.4. Middle East & Africa
- 5.3.5. Asia Pacific
- 5.1. Market Analysis, Insights and Forecast - by Application
- 6. North America 1P Lithium Battery Analysis, Insights and Forecast, 2019-2031
- 6.1. Market Analysis, Insights and Forecast - by Application
- 6.1.1. Energy Storage Frequency Modulation
- 6.1.2. Industrial and Commercial Energy Storage
- 6.2. Market Analysis, Insights and Forecast - by Types
- 6.2.1. 90-200Ah
- 6.2.2. 200-280Ah
- 6.1. Market Analysis, Insights and Forecast - by Application
- 7. South America 1P Lithium Battery Analysis, Insights and Forecast, 2019-2031
- 7.1. Market Analysis, Insights and Forecast - by Application
- 7.1.1. Energy Storage Frequency Modulation
- 7.1.2. Industrial and Commercial Energy Storage
- 7.2. Market Analysis, Insights and Forecast - by Types
- 7.2.1. 90-200Ah
- 7.2.2. 200-280Ah
- 7.1. Market Analysis, Insights and Forecast - by Application
- 8. Europe 1P Lithium Battery Analysis, Insights and Forecast, 2019-2031
- 8.1. Market Analysis, Insights and Forecast - by Application
- 8.1.1. Energy Storage Frequency Modulation
- 8.1.2. Industrial and Commercial Energy Storage
- 8.2. Market Analysis, Insights and Forecast - by Types
- 8.2.1. 90-200Ah
- 8.2.2. 200-280Ah
- 8.1. Market Analysis, Insights and Forecast - by Application
- 9. Middle East & Africa 1P Lithium Battery Analysis, Insights and Forecast, 2019-2031
- 9.1. Market Analysis, Insights and Forecast - by Application
- 9.1.1. Energy Storage Frequency Modulation
- 9.1.2. Industrial and Commercial Energy Storage
- 9.2. Market Analysis, Insights and Forecast - by Types
- 9.2.1. 90-200Ah
- 9.2.2. 200-280Ah
- 9.1. Market Analysis, Insights and Forecast - by Application
- 10. Asia Pacific 1P Lithium Battery Analysis, Insights and Forecast, 2019-2031
- 10.1. Market Analysis, Insights and Forecast - by Application
- 10.1.1. Energy Storage Frequency Modulation
- 10.1.2. Industrial and Commercial Energy Storage
- 10.2. Market Analysis, Insights and Forecast - by Types
- 10.2.1. 90-200Ah
- 10.2.2. 200-280Ah
- 10.1. Market Analysis, Insights and Forecast - by Application
- 11. Competitive Analysis
- 11.1. Global Market Share Analysis 2024
- 11.2. Company Profiles
- 11.2.1 CATL
- 11.2.1.1. Overview
- 11.2.1.2. Products
- 11.2.1.3. SWOT Analysis
- 11.2.1.4. Recent Developments
- 11.2.1.5. Financials (Based on Availability)
- 11.2.2 Shandong Dejin New Energy Technology Co.
- 11.2.2.1. Overview
- 11.2.2.2. Products
- 11.2.2.3. SWOT Analysis
- 11.2.2.4. Recent Developments
- 11.2.2.5. Financials (Based on Availability)
- 11.2.3 Ltd.
- 11.2.3.1. Overview
- 11.2.3.2. Products
- 11.2.3.3. SWOT Analysis
- 11.2.3.4. Recent Developments
- 11.2.3.5. Financials (Based on Availability)
- 11.2.4 SVOLT Energy Technology
- 11.2.4.1. Overview
- 11.2.4.2. Products
- 11.2.4.3. SWOT Analysis
- 11.2.4.4. Recent Developments
- 11.2.4.5. Financials (Based on Availability)
- 11.2.5 CALB Group Co.
- 11.2.5.1. Overview
- 11.2.5.2. Products
- 11.2.5.3. SWOT Analysis
- 11.2.5.4. Recent Developments
- 11.2.5.5. Financials (Based on Availability)
- 11.2.6 Ltd.
- 11.2.6.1. Overview
- 11.2.6.2. Products
- 11.2.6.3. SWOT Analysis
- 11.2.6.4. Recent Developments
- 11.2.6.5. Financials (Based on Availability)
- 11.2.7 ZhongTian Energy Storage Technology Co.
- 11.2.7.1. Overview
- 11.2.7.2. Products
- 11.2.7.3. SWOT Analysis
- 11.2.7.4. Recent Developments
- 11.2.7.5. Financials (Based on Availability)
- 11.2.8 Ltd
- 11.2.8.1. Overview
- 11.2.8.2. Products
- 11.2.8.3. SWOT Analysis
- 11.2.8.4. Recent Developments
- 11.2.8.5. Financials (Based on Availability)
- 11.2.9 ETC
- 11.2.9.1. Overview
- 11.2.9.2. Products
- 11.2.9.3. SWOT Analysis
- 11.2.9.4. Recent Developments
- 11.2.9.5. Financials (Based on Availability)
- 11.2.10 Tianjin Lishen Battery Joint-Stock Co.
- 11.2.10.1. Overview
- 11.2.10.2. Products
- 11.2.10.3. SWOT Analysis
- 11.2.10.4. Recent Developments
- 11.2.10.5. Financials (Based on Availability)
- 11.2.11 Ltd.
- 11.2.11.1. Overview
- 11.2.11.2. Products
- 11.2.11.3. SWOT Analysis
- 11.2.11.4. Recent Developments
- 11.2.11.5. Financials (Based on Availability)
- 11.2.12 Cornex New Energy Co.
- 11.2.12.1. Overview
- 11.2.12.2. Products
- 11.2.12.3. SWOT Analysis
- 11.2.12.4. Recent Developments
- 11.2.12.5. Financials (Based on Availability)
- 11.2.13 Ltd.
- 11.2.13.1. Overview
- 11.2.13.2. Products
- 11.2.13.3. SWOT Analysis
- 11.2.13.4. Recent Developments
- 11.2.13.5. Financials (Based on Availability)
- 11.2.14 Anhui Eikto Battery Co.
- 11.2.14.1. Overview
- 11.2.14.2. Products
- 11.2.14.3. SWOT Analysis
- 11.2.14.4. Recent Developments
- 11.2.14.5. Financials (Based on Availability)
- 11.2.15 Ltd.
- 11.2.15.1. Overview
- 11.2.15.2. Products
- 11.2.15.3. SWOT Analysis
- 11.2.15.4. Recent Developments
- 11.2.15.5. Financials (Based on Availability)
- 11.2.16 Answer Technology Co.
- 11.2.16.1. Overview
- 11.2.16.2. Products
- 11.2.16.3. SWOT Analysis
- 11.2.16.4. Recent Developments
- 11.2.16.5. Financials (Based on Availability)
- 11.2.17 Ltd.
- 11.2.17.1. Overview
- 11.2.17.2. Products
- 11.2.17.3. SWOT Analysis
- 11.2.17.4. Recent Developments
- 11.2.17.5. Financials (Based on Availability)
- 11.2.18 Jiangsu Higee Energy Co.
- 11.2.18.1. Overview
- 11.2.18.2. Products
- 11.2.18.3. SWOT Analysis
- 11.2.18.4. Recent Developments
- 11.2.18.5. Financials (Based on Availability)
- 11.2.19 Ltd.
- 11.2.19.1. Overview
- 11.2.19.2. Products
- 11.2.19.3. SWOT Analysis
- 11.2.19.4. Recent Developments
- 11.2.19.5. Financials (Based on Availability)
- 11.2.20 EVE Energy Co.
- 11.2.20.1. Overview
- 11.2.20.2. Products
- 11.2.20.3. SWOT Analysis
- 11.2.20.4. Recent Developments
- 11.2.20.5. Financials (Based on Availability)
- 11.2.21 Ltd.
- 11.2.21.1. Overview
- 11.2.21.2. Products
- 11.2.21.3. SWOT Analysis
- 11.2.21.4. Recent Developments
- 11.2.21.5. Financials (Based on Availability)
- 11.2.22 Hithium
- 11.2.22.1. Overview
- 11.2.22.2. Products
- 11.2.22.3. SWOT Analysis
- 11.2.22.4. Recent Developments
- 11.2.22.5. Financials (Based on Availability)
- 11.2.23 Batterotech
- 11.2.23.1. Overview
- 11.2.23.2. Products
- 11.2.23.3. SWOT Analysis
- 11.2.23.4. Recent Developments
- 11.2.23.5. Financials (Based on Availability)
- 11.2.1 CATL
List of Figures
- Figure 1: Global 1P Lithium Battery Revenue Breakdown (million, %) by Region 2024 & 2032
- Figure 2: Global 1P Lithium Battery Volume Breakdown (K, %) by Region 2024 & 2032
- Figure 3: North America 1P Lithium Battery Revenue (million), by Application 2024 & 2032
- Figure 4: North America 1P Lithium Battery Volume (K), by Application 2024 & 2032
- Figure 5: North America 1P Lithium Battery Revenue Share (%), by Application 2024 & 2032
- Figure 6: North America 1P Lithium Battery Volume Share (%), by Application 2024 & 2032
- Figure 7: North America 1P Lithium Battery Revenue (million), by Types 2024 & 2032
- Figure 8: North America 1P Lithium Battery Volume (K), by Types 2024 & 2032
- Figure 9: North America 1P Lithium Battery Revenue Share (%), by Types 2024 & 2032
- Figure 10: North America 1P Lithium Battery Volume Share (%), by Types 2024 & 2032
- Figure 11: North America 1P Lithium Battery Revenue (million), by Country 2024 & 2032
- Figure 12: North America 1P Lithium Battery Volume (K), by Country 2024 & 2032
- Figure 13: North America 1P Lithium Battery Revenue Share (%), by Country 2024 & 2032
- Figure 14: North America 1P Lithium Battery Volume Share (%), by Country 2024 & 2032
- Figure 15: South America 1P Lithium Battery Revenue (million), by Application 2024 & 2032
- Figure 16: South America 1P Lithium Battery Volume (K), by Application 2024 & 2032
- Figure 17: South America 1P Lithium Battery Revenue Share (%), by Application 2024 & 2032
- Figure 18: South America 1P Lithium Battery Volume Share (%), by Application 2024 & 2032
- Figure 19: South America 1P Lithium Battery Revenue (million), by Types 2024 & 2032
- Figure 20: South America 1P Lithium Battery Volume (K), by Types 2024 & 2032
- Figure 21: South America 1P Lithium Battery Revenue Share (%), by Types 2024 & 2032
- Figure 22: South America 1P Lithium Battery Volume Share (%), by Types 2024 & 2032
- Figure 23: South America 1P Lithium Battery Revenue (million), by Country 2024 & 2032
- Figure 24: South America 1P Lithium Battery Volume (K), by Country 2024 & 2032
- Figure 25: South America 1P Lithium Battery Revenue Share (%), by Country 2024 & 2032
- Figure 26: South America 1P Lithium Battery Volume Share (%), by Country 2024 & 2032
- Figure 27: Europe 1P Lithium Battery Revenue (million), by Application 2024 & 2032
- Figure 28: Europe 1P Lithium Battery Volume (K), by Application 2024 & 2032
- Figure 29: Europe 1P Lithium Battery Revenue Share (%), by Application 2024 & 2032
- Figure 30: Europe 1P Lithium Battery Volume Share (%), by Application 2024 & 2032
- Figure 31: Europe 1P Lithium Battery Revenue (million), by Types 2024 & 2032
- Figure 32: Europe 1P Lithium Battery Volume (K), by Types 2024 & 2032
- Figure 33: Europe 1P Lithium Battery Revenue Share (%), by Types 2024 & 2032
- Figure 34: Europe 1P Lithium Battery Volume Share (%), by Types 2024 & 2032
- Figure 35: Europe 1P Lithium Battery Revenue (million), by Country 2024 & 2032
- Figure 36: Europe 1P Lithium Battery Volume (K), by Country 2024 & 2032
- Figure 37: Europe 1P Lithium Battery Revenue Share (%), by Country 2024 & 2032
- Figure 38: Europe 1P Lithium Battery Volume Share (%), by Country 2024 & 2032
- Figure 39: Middle East & Africa 1P Lithium Battery Revenue (million), by Application 2024 & 2032
- Figure 40: Middle East & Africa 1P Lithium Battery Volume (K), by Application 2024 & 2032
- Figure 41: Middle East & Africa 1P Lithium Battery Revenue Share (%), by Application 2024 & 2032
- Figure 42: Middle East & Africa 1P Lithium Battery Volume Share (%), by Application 2024 & 2032
- Figure 43: Middle East & Africa 1P Lithium Battery Revenue (million), by Types 2024 & 2032
- Figure 44: Middle East & Africa 1P Lithium Battery Volume (K), by Types 2024 & 2032
- Figure 45: Middle East & Africa 1P Lithium Battery Revenue Share (%), by Types 2024 & 2032
- Figure 46: Middle East & Africa 1P Lithium Battery Volume Share (%), by Types 2024 & 2032
- Figure 47: Middle East & Africa 1P Lithium Battery Revenue (million), by Country 2024 & 2032
- Figure 48: Middle East & Africa 1P Lithium Battery Volume (K), by Country 2024 & 2032
- Figure 49: Middle East & Africa 1P Lithium Battery Revenue Share (%), by Country 2024 & 2032
- Figure 50: Middle East & Africa 1P Lithium Battery Volume Share (%), by Country 2024 & 2032
- Figure 51: Asia Pacific 1P Lithium Battery Revenue (million), by Application 2024 & 2032
- Figure 52: Asia Pacific 1P Lithium Battery Volume (K), by Application 2024 & 2032
- Figure 53: Asia Pacific 1P Lithium Battery Revenue Share (%), by Application 2024 & 2032
- Figure 54: Asia Pacific 1P Lithium Battery Volume Share (%), by Application 2024 & 2032
- Figure 55: Asia Pacific 1P Lithium Battery Revenue (million), by Types 2024 & 2032
- Figure 56: Asia Pacific 1P Lithium Battery Volume (K), by Types 2024 & 2032
- Figure 57: Asia Pacific 1P Lithium Battery Revenue Share (%), by Types 2024 & 2032
- Figure 58: Asia Pacific 1P Lithium Battery Volume Share (%), by Types 2024 & 2032
- Figure 59: Asia Pacific 1P Lithium Battery Revenue (million), by Country 2024 & 2032
- Figure 60: Asia Pacific 1P Lithium Battery Volume (K), by Country 2024 & 2032
- Figure 61: Asia Pacific 1P Lithium Battery Revenue Share (%), by Country 2024 & 2032
- Figure 62: Asia Pacific 1P Lithium Battery Volume Share (%), by Country 2024 & 2032
List of Tables
- Table 1: Global 1P Lithium Battery Revenue million Forecast, by Region 2019 & 2032
- Table 2: Global 1P Lithium Battery Volume K Forecast, by Region 2019 & 2032
- Table 3: Global 1P Lithium Battery Revenue million Forecast, by Application 2019 & 2032
- Table 4: Global 1P Lithium Battery Volume K Forecast, by Application 2019 & 2032
- Table 5: Global 1P Lithium Battery Revenue million Forecast, by Types 2019 & 2032
- Table 6: Global 1P Lithium Battery Volume K Forecast, by Types 2019 & 2032
- Table 7: Global 1P Lithium Battery Revenue million Forecast, by Region 2019 & 2032
- Table 8: Global 1P Lithium Battery Volume K Forecast, by Region 2019 & 2032
- Table 9: Global 1P Lithium Battery Revenue million Forecast, by Application 2019 & 2032
- Table 10: Global 1P Lithium Battery Volume K Forecast, by Application 2019 & 2032
- Table 11: Global 1P Lithium Battery Revenue million Forecast, by Types 2019 & 2032
- Table 12: Global 1P Lithium Battery Volume K Forecast, by Types 2019 & 2032
- Table 13: Global 1P Lithium Battery Revenue million Forecast, by Country 2019 & 2032
- Table 14: Global 1P Lithium Battery Volume K Forecast, by Country 2019 & 2032
- Table 15: United States 1P Lithium Battery Revenue (million) Forecast, by Application 2019 & 2032
- Table 16: United States 1P Lithium Battery Volume (K) Forecast, by Application 2019 & 2032
- Table 17: Canada 1P Lithium Battery Revenue (million) Forecast, by Application 2019 & 2032
- Table 18: Canada 1P Lithium Battery Volume (K) Forecast, by Application 2019 & 2032
- Table 19: Mexico 1P Lithium Battery Revenue (million) Forecast, by Application 2019 & 2032
- Table 20: Mexico 1P Lithium Battery Volume (K) Forecast, by Application 2019 & 2032
- Table 21: Global 1P Lithium Battery Revenue million Forecast, by Application 2019 & 2032
- Table 22: Global 1P Lithium Battery Volume K Forecast, by Application 2019 & 2032
- Table 23: Global 1P Lithium Battery Revenue million Forecast, by Types 2019 & 2032
- Table 24: Global 1P Lithium Battery Volume K Forecast, by Types 2019 & 2032
- Table 25: Global 1P Lithium Battery Revenue million Forecast, by Country 2019 & 2032
- Table 26: Global 1P Lithium Battery Volume K Forecast, by Country 2019 & 2032
- Table 27: Brazil 1P Lithium Battery Revenue (million) Forecast, by Application 2019 & 2032
- Table 28: Brazil 1P Lithium Battery Volume (K) Forecast, by Application 2019 & 2032
- Table 29: Argentina 1P Lithium Battery Revenue (million) Forecast, by Application 2019 & 2032
- Table 30: Argentina 1P Lithium Battery Volume (K) Forecast, by Application 2019 & 2032
- Table 31: Rest of South America 1P Lithium Battery Revenue (million) Forecast, by Application 2019 & 2032
- Table 32: Rest of South America 1P Lithium Battery Volume (K) Forecast, by Application 2019 & 2032
- Table 33: Global 1P Lithium Battery Revenue million Forecast, by Application 2019 & 2032
- Table 34: Global 1P Lithium Battery Volume K Forecast, by Application 2019 & 2032
- Table 35: Global 1P Lithium Battery Revenue million Forecast, by Types 2019 & 2032
- Table 36: Global 1P Lithium Battery Volume K Forecast, by Types 2019 & 2032
- Table 37: Global 1P Lithium Battery Revenue million Forecast, by Country 2019 & 2032
- Table 38: Global 1P Lithium Battery Volume K Forecast, by Country 2019 & 2032
- Table 39: United Kingdom 1P Lithium Battery Revenue (million) Forecast, by Application 2019 & 2032
- Table 40: United Kingdom 1P Lithium Battery Volume (K) Forecast, by Application 2019 & 2032
- Table 41: Germany 1P Lithium Battery Revenue (million) Forecast, by Application 2019 & 2032
- Table 42: Germany 1P Lithium Battery Volume (K) Forecast, by Application 2019 & 2032
- Table 43: France 1P Lithium Battery Revenue (million) Forecast, by Application 2019 & 2032
- Table 44: France 1P Lithium Battery Volume (K) Forecast, by Application 2019 & 2032
- Table 45: Italy 1P Lithium Battery Revenue (million) Forecast, by Application 2019 & 2032
- Table 46: Italy 1P Lithium Battery Volume (K) Forecast, by Application 2019 & 2032
- Table 47: Spain 1P Lithium Battery Revenue (million) Forecast, by Application 2019 & 2032
- Table 48: Spain 1P Lithium Battery Volume (K) Forecast, by Application 2019 & 2032
- Table 49: Russia 1P Lithium Battery Revenue (million) Forecast, by Application 2019 & 2032
- Table 50: Russia 1P Lithium Battery Volume (K) Forecast, by Application 2019 & 2032
- Table 51: Benelux 1P Lithium Battery Revenue (million) Forecast, by Application 2019 & 2032
- Table 52: Benelux 1P Lithium Battery Volume (K) Forecast, by Application 2019 & 2032
- Table 53: Nordics 1P Lithium Battery Revenue (million) Forecast, by Application 2019 & 2032
- Table 54: Nordics 1P Lithium Battery Volume (K) Forecast, by Application 2019 & 2032
- Table 55: Rest of Europe 1P Lithium Battery Revenue (million) Forecast, by Application 2019 & 2032
- Table 56: Rest of Europe 1P Lithium Battery Volume (K) Forecast, by Application 2019 & 2032
- Table 57: Global 1P Lithium Battery Revenue million Forecast, by Application 2019 & 2032
- Table 58: Global 1P Lithium Battery Volume K Forecast, by Application 2019 & 2032
- Table 59: Global 1P Lithium Battery Revenue million Forecast, by Types 2019 & 2032
- Table 60: Global 1P Lithium Battery Volume K Forecast, by Types 2019 & 2032
- Table 61: Global 1P Lithium Battery Revenue million Forecast, by Country 2019 & 2032
- Table 62: Global 1P Lithium Battery Volume K Forecast, by Country 2019 & 2032
- Table 63: Turkey 1P Lithium Battery Revenue (million) Forecast, by Application 2019 & 2032
- Table 64: Turkey 1P Lithium Battery Volume (K) Forecast, by Application 2019 & 2032
- Table 65: Israel 1P Lithium Battery Revenue (million) Forecast, by Application 2019 & 2032
- Table 66: Israel 1P Lithium Battery Volume (K) Forecast, by Application 2019 & 2032
- Table 67: GCC 1P Lithium Battery Revenue (million) Forecast, by Application 2019 & 2032
- Table 68: GCC 1P Lithium Battery Volume (K) Forecast, by Application 2019 & 2032
- Table 69: North Africa 1P Lithium Battery Revenue (million) Forecast, by Application 2019 & 2032
- Table 70: North Africa 1P Lithium Battery Volume (K) Forecast, by Application 2019 & 2032
- Table 71: South Africa 1P Lithium Battery Revenue (million) Forecast, by Application 2019 & 2032
- Table 72: South Africa 1P Lithium Battery Volume (K) Forecast, by Application 2019 & 2032
- Table 73: Rest of Middle East & Africa 1P Lithium Battery Revenue (million) Forecast, by Application 2019 & 2032
- Table 74: Rest of Middle East & Africa 1P Lithium Battery Volume (K) Forecast, by Application 2019 & 2032
- Table 75: Global 1P Lithium Battery Revenue million Forecast, by Application 2019 & 2032
- Table 76: Global 1P Lithium Battery Volume K Forecast, by Application 2019 & 2032
- Table 77: Global 1P Lithium Battery Revenue million Forecast, by Types 2019 & 2032
- Table 78: Global 1P Lithium Battery Volume K Forecast, by Types 2019 & 2032
- Table 79: Global 1P Lithium Battery Revenue million Forecast, by Country 2019 & 2032
- Table 80: Global 1P Lithium Battery Volume K Forecast, by Country 2019 & 2032
- Table 81: China 1P Lithium Battery Revenue (million) Forecast, by Application 2019 & 2032
- Table 82: China 1P Lithium Battery Volume (K) Forecast, by Application 2019 & 2032
- Table 83: India 1P Lithium Battery Revenue (million) Forecast, by Application 2019 & 2032
- Table 84: India 1P Lithium Battery Volume (K) Forecast, by Application 2019 & 2032
- Table 85: Japan 1P Lithium Battery Revenue (million) Forecast, by Application 2019 & 2032
- Table 86: Japan 1P Lithium Battery Volume (K) Forecast, by Application 2019 & 2032
- Table 87: South Korea 1P Lithium Battery Revenue (million) Forecast, by Application 2019 & 2032
- Table 88: South Korea 1P Lithium Battery Volume (K) Forecast, by Application 2019 & 2032
- Table 89: ASEAN 1P Lithium Battery Revenue (million) Forecast, by Application 2019 & 2032
- Table 90: ASEAN 1P Lithium Battery Volume (K) Forecast, by Application 2019 & 2032
- Table 91: Oceania 1P Lithium Battery Revenue (million) Forecast, by Application 2019 & 2032
- Table 92: Oceania 1P Lithium Battery Volume (K) Forecast, by Application 2019 & 2032
- Table 93: Rest of Asia Pacific 1P Lithium Battery Revenue (million) Forecast, by Application 2019 & 2032
- Table 94: Rest of Asia Pacific 1P Lithium Battery Volume (K) Forecast, by Application 2019 & 2032
Frequently Asked Questions
1. What is the projected Compound Annual Growth Rate (CAGR) of the 1P Lithium Battery?
The projected CAGR is approximately XX%.
2. Which companies are prominent players in the 1P Lithium Battery?
Key companies in the market include CATL, Shandong Dejin New Energy Technology Co., Ltd., SVOLT Energy Technology, CALB Group Co., Ltd., ZhongTian Energy Storage Technology Co., Ltd, ETC, Tianjin Lishen Battery Joint-Stock Co., Ltd., Cornex New Energy Co., Ltd., Anhui Eikto Battery Co., Ltd., Answer Technology Co., Ltd., Jiangsu Higee Energy Co., Ltd., EVE Energy Co., Ltd., Hithium, Batterotech.
3. What are the main segments of the 1P Lithium Battery?
The market segments include Application, Types.
4. Can you provide details about the market size?
The market size is estimated to be USD XXX million as of 2022.
5. What are some drivers contributing to market growth?
N/A
6. What are the notable trends driving market growth?
N/A
7. Are there any restraints impacting market growth?
N/A
8. Can you provide examples of recent developments in the market?
N/A
9. What pricing options are available for accessing the report?
Pricing options include single-user, multi-user, and enterprise licenses priced at USD 4350.00, USD 6525.00, and USD 8700.00 respectively.
10. Is the market size provided in terms of value or volume?
The market size is provided in terms of value, measured in million and volume, measured in K.
11. Are there any specific market keywords associated with the report?
Yes, the market keyword associated with the report is "1P Lithium Battery," which aids in identifying and referencing the specific market segment covered.
12. How do I determine which pricing option suits my needs best?
The pricing options vary based on user requirements and access needs. Individual users may opt for single-user licenses, while businesses requiring broader access may choose multi-user or enterprise licenses for cost-effective access to the report.
13. Are there any additional resources or data provided in the 1P Lithium Battery report?
While the report offers comprehensive insights, it's advisable to review the specific contents or supplementary materials provided to ascertain if additional resources or data are available.
14. How can I stay updated on further developments or reports in the 1P Lithium Battery?
To stay informed about further developments, trends, and reports in the 1P Lithium Battery, consider subscribing to industry newsletters, following relevant companies and organizations, or regularly checking reputable industry news sources and publications.
Methodology
Step 1 - Identification of Relevant Samples Size from Population Database


Step 2 - Approaches for Defining Global Market Size (Value, Volume* & Price*)

Note*: In applicable scenarios
Step 3 - Data Sources
Primary Research
- Web Analytics
- Survey Reports
- Research Institute
- Latest Research Reports
- Opinion Leaders
Secondary Research
- Annual Reports
- White Paper
- Latest Press Release
- Industry Association
- Paid Database
- Investor Presentations

Step 4 - Data Triangulation
Involves using different sources of information in order to increase the validity of a study
These sources are likely to be stakeholders in a program - participants, other researchers, program staff, other community members, and so on.
Then we put all data in single framework & apply various statistical tools to find out the dynamic on the market.
During the analysis stage, feedback from the stakeholder groups would be compared to determine areas of agreement as well as areas of divergence
