

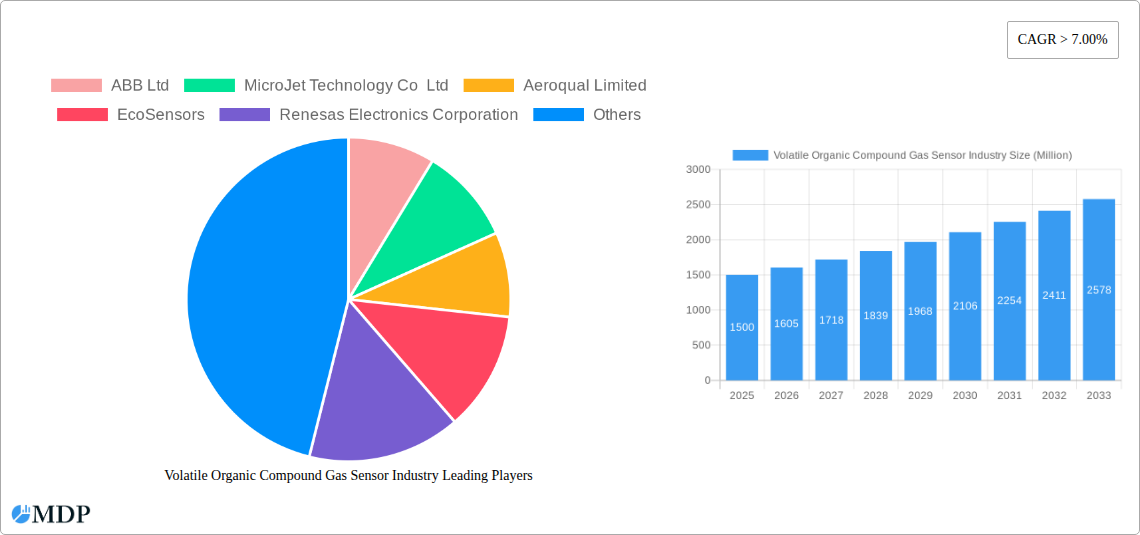
Key Insights
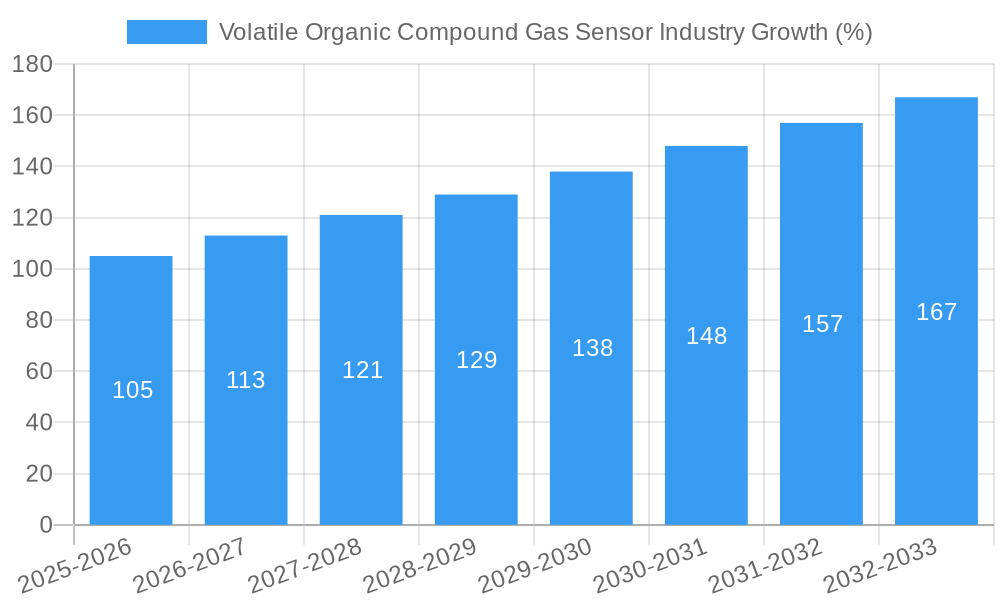
The Volatile Organic Compound (VOC) gas sensor market is experiencing robust growth, driven by increasing environmental regulations, heightened safety concerns across various industries, and the expanding adoption of smart technologies. The market's Compound Annual Growth Rate (CAGR) exceeding 7% signifies a promising trajectory, projected to reach a substantial market value within the forecast period (2025-2033). Key drivers include the imperative for accurate VOC detection in industrial processes (e.g., manufacturing, oil & gas) to ensure worker safety and environmental compliance, the rising demand for improved indoor air quality monitoring in commercial and residential settings, and the proliferation of portable and wearable sensing devices fueled by advancements in miniaturization and sensor technology. The market is segmented by product type (combustible, non-combustible, and specific VOC sensors) and end-use (industrial, commercial, residential), with the industrial sector currently dominating due to stringent regulatory requirements and the need for real-time monitoring of hazardous VOC emissions. Growth within the residential segment is anticipated to accelerate, driven by increasing consumer awareness of indoor air quality and the availability of affordable, user-friendly VOC sensors. Despite the positive outlook, market growth may be tempered by factors such as the high initial cost of sensor deployment and maintenance, as well as the need for continuous calibration to ensure accuracy. However, ongoing technological innovations aimed at reducing costs and enhancing sensor lifespan are expected to mitigate these restraints.
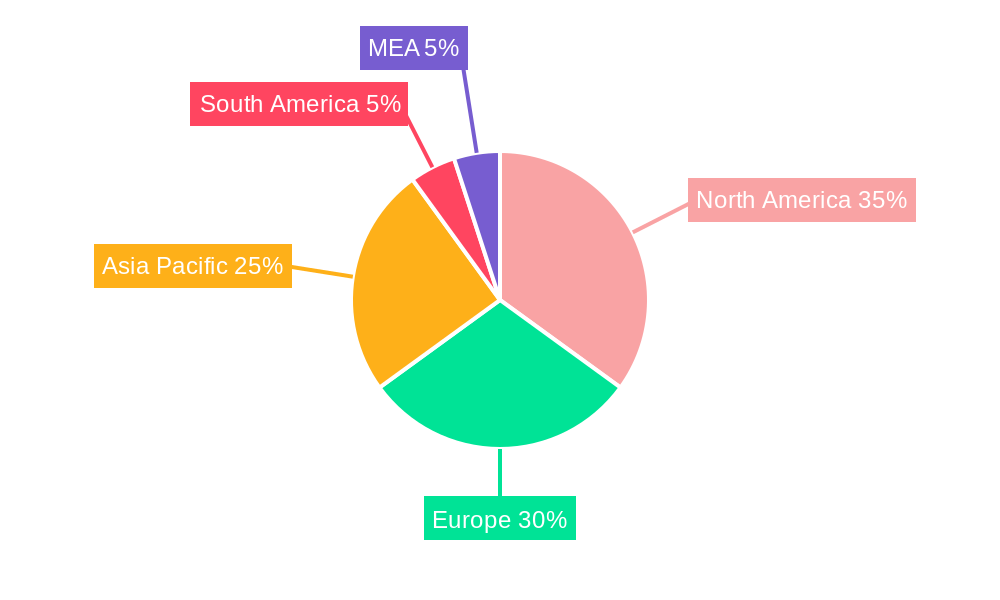
Leading players in the VOC gas sensor market, including ABB Ltd, MicroJet Technology Co Ltd, and others, are investing heavily in research and development to improve sensor sensitivity, selectivity, and durability. This competitive landscape fosters innovation and drives the market towards greater efficiency and affordability. Regional market analysis indicates that North America and Europe currently hold significant market shares, driven by advanced infrastructure and stringent environmental regulations. However, the Asia-Pacific region is projected to witness substantial growth in the coming years, fueled by rapid industrialization and increasing environmental awareness. This growth will be particularly strong in countries like China and India, presenting significant opportunities for market expansion and investment. The continued development of sophisticated sensor technologies, coupled with supportive government policies and growing environmental consciousness, is poised to propel the VOC gas sensor market to even greater heights in the coming decade.
Volatile Organic Compound (VOC) Gas Sensor Market Report: 2019-2033
Dive deep into the dynamic Volatile Organic Compound (VOC) Gas Sensor market with this comprehensive report, projecting a market value exceeding $XX Million by 2033. This in-depth analysis covers market dynamics, leading players like ABB Ltd, MicroJet Technology Co Ltd, and Aeroqual Limited, and key segments to provide actionable insights for strategic decision-making. The report utilizes data from the historical period (2019-2024), base year (2025), and estimated year (2025) to forecast market trends until 2033.
Volatile Organic Compound Gas Sensor Industry Market Dynamics & Concentration
The VOC gas sensor market, valued at $XX Million in 2025, is experiencing [positive/negative - choose one based on your analysis] growth driven by [mention specific drivers, e.g., stringent environmental regulations, increasing industrial automation]. Market concentration is [high/medium/low - choose one based on your analysis], with key players such as ABB Ltd, ABB Ltd, MicroJet Technology Co Ltd, Aeroqual Limited, and others holding significant market share.
- Market Share: ABB Ltd holds an estimated XX% market share, followed by MicroJet Technology Co Ltd at XX%, and Aeroqual Limited at XX%. (Insert data if available, otherwise use estimated percentages).
- Innovation Drivers: Miniaturization, improved sensitivity, and lower power consumption are key drivers.
- Regulatory Frameworks: Stringent emission standards in various regions are boosting demand.
- Product Substitutes: [Mention potential substitutes and their market impact].
- End-User Trends: Growing adoption across industrial, commercial, and residential sectors.
- M&A Activities: The market has witnessed XX M&A deals in the past five years, indicating [positive/negative - choose one based on your analysis] consolidation trends.
Volatile Organic Compound Gas Sensor Industry Industry Trends & Analysis
The VOC gas sensor market is projected to exhibit a CAGR of XX% during the forecast period (2025-2033). This growth is fueled by several factors, including:
- Technological Disruptions: The emergence of advanced sensing technologies like [mention specific technologies e.g., electrochemical sensors, semiconductor sensors] is improving sensor performance and reducing costs.
- Market Growth Drivers: Increasing demand from automotive, healthcare, and environmental monitoring sectors is significantly driving market growth.
- Consumer Preferences: Demand for high-accuracy, reliable, and cost-effective sensors is increasing.
- Competitive Dynamics: Intense competition among established players and emerging companies is driving innovation and price reductions. Market penetration in [mention specific regions/sectors] is expected to increase significantly.
Leading Markets & Segments in Volatile Organic Compound Gas Sensor Industry
The [mention region, e.g., North America/ Asia-Pacific] region dominates the VOC gas sensor market, accounting for XX% of global revenue in 2025.
By Product Type:
- Industrial Segment: Industrial applications dominate, driven by stringent emission control norms and safety regulations.
- Combustible Gas Sensors: This segment holds the largest market share due to [mention reasons].
- Non-Combustible Gas Sensors: This segment shows significant growth potential owing to [mention reasons].
- Specific Gas Sensors: Growing demand for sensors targeting specific VOCs is driving segment growth.
By End-Use:
- Industrial: The industrial sector dominates the end-use market due to high demand from various processes and safety requirements. Key drivers include automation initiatives, stringent safety norms and growing industrialization.
- Commercial: Commercial applications are growing steadily due to increasing concerns about indoor air quality and environmental monitoring.
- Residential: Residential applications are witnessing a rise driven by increasing awareness of indoor air quality and smart home technologies.
Volatile Organic Compound Gas Sensor Industry Product Developments
Recent product innovations include the development of highly sensitive and selective sensors with improved accuracy, longer lifespan, and reduced power consumption. Miniaturization and integration with wireless communication technologies are enhancing sensor applications across various sectors. These advancements are driving market growth by catering to diverse application demands and improving overall system efficiency.
Key Drivers of Volatile Organic Compound Gas Sensor Industry Growth
The VOC gas sensor market growth is driven by factors like increasing environmental regulations, stricter industrial safety standards, advancements in sensing technologies, and the rising adoption of IoT in diverse sectors. The growth of smart cities and industrial automation also contributes to the expanding market size.
Challenges in the Volatile Organic Compound Gas Sensor Industry Market
Challenges include high initial investment costs associated with sensor development and manufacturing, the need for stringent quality control measures, potential supply chain disruptions, and intense competition from numerous sensor manufacturers. These factors could potentially slow down market growth if not addressed effectively.
Emerging Opportunities in Volatile Organic Compound Gas Sensor Industry
Emerging opportunities lie in the development of low-cost, high-performance sensors, integration with advanced analytics platforms, expansion into new applications in the healthcare and environmental monitoring sectors, and the adoption of advanced manufacturing processes for enhanced sensor production and quality control.
Leading Players in the Volatile Organic Compound Gas Sensor Industry Sector
- ABB Ltd
- MicroJet Technology Co Ltd
- Aeroqual Limited
- EcoSensors
- Renesas Electronics Corporation
- Alphasense
- SGX Sensortech Limited
- GfG Europe Ltd
- Ion Science Ltd
Key Milestones in Volatile Organic Compound Gas Sensor Industry Industry
- 2020: [Insert a significant milestone with month/year]
- 2022: [Insert a significant milestone with month/year]
- 2024: [Insert a significant milestone with month/year]
Strategic Outlook for Volatile Organic Compound Gas Sensor Industry Market
The VOC gas sensor market holds significant future potential, driven by continuous technological advancements, expansion into emerging applications, and strategic partnerships to tap into new markets. Companies focusing on innovation, cost optimization, and strategic alliances are expected to capture significant market share in the coming years.
Volatile Organic Compound Gas Sensor Industry Segmentation
-
1. Product Type
- 1.1. Combustible Gas Sensors
- 1.2. Non-Combustible Gas Sensors
- 1.3. Specific Gas Sensors
-
2. End-Use
- 2.1. Industrial
- 2.2. Commercial
- 2.3. Residential
Volatile Organic Compound Gas Sensor Industry Segmentation By Geography
- 1. North America
- 2. Europe
- 3. Asia
- 4. Australia and New Zealand
- 5. Latin America
- 6. Middle East and Africa
Volatile Organic Compound Gas Sensor Industry REPORT HIGHLIGHTS
| Aspects | Details |
|---|---|
| Study Period | 2019-2033 |
| Base Year | 2024 |
| Estimated Year | 2025 |
| Forecast Period | 2025-2033 |
| Historical Period | 2019-2024 |
| Growth Rate | CAGR of > 7.00% from 2019-2033 |
| Segmentation |
|
Table of Contents
- 1. Introduction
- 1.1. Research Scope
- 1.2. Market Segmentation
- 1.3. Research Methodology
- 1.4. Definitions and Assumptions
- 2. Executive Summary
- 2.1. Introduction
- 3. Market Dynamics
- 3.1. Introduction
- 3.2. Market Drivers
- 3.2.1. ; Stringent Government Regulations to Control VOC Emissions; Increasing Use of Wireless and Smart Sensing Technology
- 3.3. Market Restrains
- 3.3.1. ; Interopereability Issues
- 3.4. Market Trends
- 3.4.1. Oil & Gas Industry to Drive the Market Growth
- 4. Market Factor Analysis
- 4.1. Porters Five Forces
- 4.2. Supply/Value Chain
- 4.3. PESTEL analysis
- 4.4. Market Entropy
- 4.5. Patent/Trademark Analysis
- 5. Global Volatile Organic Compound Gas Sensor Industry Analysis, Insights and Forecast, 2019-2031
- 5.1. Market Analysis, Insights and Forecast - by Product Type
- 5.1.1. Combustible Gas Sensors
- 5.1.2. Non-Combustible Gas Sensors
- 5.1.3. Specific Gas Sensors
- 5.2. Market Analysis, Insights and Forecast - by End-Use
- 5.2.1. Industrial
- 5.2.2. Commercial
- 5.2.3. Residential
- 5.3. Market Analysis, Insights and Forecast - by Region
- 5.3.1. North America
- 5.3.2. Europe
- 5.3.3. Asia
- 5.3.4. Australia and New Zealand
- 5.3.5. Latin America
- 5.3.6. Middle East and Africa
- 5.1. Market Analysis, Insights and Forecast - by Product Type
- 6. North America Volatile Organic Compound Gas Sensor Industry Analysis, Insights and Forecast, 2019-2031
- 6.1. Market Analysis, Insights and Forecast - by Product Type
- 6.1.1. Combustible Gas Sensors
- 6.1.2. Non-Combustible Gas Sensors
- 6.1.3. Specific Gas Sensors
- 6.2. Market Analysis, Insights and Forecast - by End-Use
- 6.2.1. Industrial
- 6.2.2. Commercial
- 6.2.3. Residential
- 6.1. Market Analysis, Insights and Forecast - by Product Type
- 7. Europe Volatile Organic Compound Gas Sensor Industry Analysis, Insights and Forecast, 2019-2031
- 7.1. Market Analysis, Insights and Forecast - by Product Type
- 7.1.1. Combustible Gas Sensors
- 7.1.2. Non-Combustible Gas Sensors
- 7.1.3. Specific Gas Sensors
- 7.2. Market Analysis, Insights and Forecast - by End-Use
- 7.2.1. Industrial
- 7.2.2. Commercial
- 7.2.3. Residential
- 7.1. Market Analysis, Insights and Forecast - by Product Type
- 8. Asia Volatile Organic Compound Gas Sensor Industry Analysis, Insights and Forecast, 2019-2031
- 8.1. Market Analysis, Insights and Forecast - by Product Type
- 8.1.1. Combustible Gas Sensors
- 8.1.2. Non-Combustible Gas Sensors
- 8.1.3. Specific Gas Sensors
- 8.2. Market Analysis, Insights and Forecast - by End-Use
- 8.2.1. Industrial
- 8.2.2. Commercial
- 8.2.3. Residential
- 8.1. Market Analysis, Insights and Forecast - by Product Type
- 9. Australia and New Zealand Volatile Organic Compound Gas Sensor Industry Analysis, Insights and Forecast, 2019-2031
- 9.1. Market Analysis, Insights and Forecast - by Product Type
- 9.1.1. Combustible Gas Sensors
- 9.1.2. Non-Combustible Gas Sensors
- 9.1.3. Specific Gas Sensors
- 9.2. Market Analysis, Insights and Forecast - by End-Use
- 9.2.1. Industrial
- 9.2.2. Commercial
- 9.2.3. Residential
- 9.1. Market Analysis, Insights and Forecast - by Product Type
- 10. Latin America Volatile Organic Compound Gas Sensor Industry Analysis, Insights and Forecast, 2019-2031
- 10.1. Market Analysis, Insights and Forecast - by Product Type
- 10.1.1. Combustible Gas Sensors
- 10.1.2. Non-Combustible Gas Sensors
- 10.1.3. Specific Gas Sensors
- 10.2. Market Analysis, Insights and Forecast - by End-Use
- 10.2.1. Industrial
- 10.2.2. Commercial
- 10.2.3. Residential
- 10.1. Market Analysis, Insights and Forecast - by Product Type
- 11. Middle East and Africa Volatile Organic Compound Gas Sensor Industry Analysis, Insights and Forecast, 2019-2031
- 11.1. Market Analysis, Insights and Forecast - by Product Type
- 11.1.1. Combustible Gas Sensors
- 11.1.2. Non-Combustible Gas Sensors
- 11.1.3. Specific Gas Sensors
- 11.2. Market Analysis, Insights and Forecast - by End-Use
- 11.2.1. Industrial
- 11.2.2. Commercial
- 11.2.3. Residential
- 11.1. Market Analysis, Insights and Forecast - by Product Type
- 12. North America Volatile Organic Compound Gas Sensor Industry Analysis, Insights and Forecast, 2019-2031
- 12.1. Market Analysis, Insights and Forecast - By Country/Sub-region
- 12.1.1 United States
- 12.1.2 Canada
- 12.1.3 Mexico
- 13. Europe Volatile Organic Compound Gas Sensor Industry Analysis, Insights and Forecast, 2019-2031
- 13.1. Market Analysis, Insights and Forecast - By Country/Sub-region
- 13.1.1 Germany
- 13.1.2 United Kingdom
- 13.1.3 France
- 13.1.4 Spain
- 13.1.5 Italy
- 13.1.6 Spain
- 13.1.7 Belgium
- 13.1.8 Netherland
- 13.1.9 Nordics
- 13.1.10 Rest of Europe
- 14. Asia Pacific Volatile Organic Compound Gas Sensor Industry Analysis, Insights and Forecast, 2019-2031
- 14.1. Market Analysis, Insights and Forecast - By Country/Sub-region
- 14.1.1 China
- 14.1.2 Japan
- 14.1.3 India
- 14.1.4 South Korea
- 14.1.5 Southeast Asia
- 14.1.6 Australia
- 14.1.7 Indonesia
- 14.1.8 Phillipes
- 14.1.9 Singapore
- 14.1.10 Thailandc
- 14.1.11 Rest of Asia Pacific
- 15. South America Volatile Organic Compound Gas Sensor Industry Analysis, Insights and Forecast, 2019-2031
- 15.1. Market Analysis, Insights and Forecast - By Country/Sub-region
- 15.1.1 Brazil
- 15.1.2 Argentina
- 15.1.3 Peru
- 15.1.4 Chile
- 15.1.5 Colombia
- 15.1.6 Ecuador
- 15.1.7 Venezuela
- 15.1.8 Rest of South America
- 16. MEA Volatile Organic Compound Gas Sensor Industry Analysis, Insights and Forecast, 2019-2031
- 16.1. Market Analysis, Insights and Forecast - By Country/Sub-region
- 16.1.1 United Arab Emirates
- 16.1.2 Saudi Arabia
- 16.1.3 South Africa
- 16.1.4 Rest of Middle East and Africa
- 17. Competitive Analysis
- 17.1. Global Market Share Analysis 2024
- 17.2. Company Profiles
- 17.2.1 ABB Ltd
- 17.2.1.1. Overview
- 17.2.1.2. Products
- 17.2.1.3. SWOT Analysis
- 17.2.1.4. Recent Developments
- 17.2.1.5. Financials (Based on Availability)
- 17.2.2 MicroJet Technology Co Ltd
- 17.2.2.1. Overview
- 17.2.2.2. Products
- 17.2.2.3. SWOT Analysis
- 17.2.2.4. Recent Developments
- 17.2.2.5. Financials (Based on Availability)
- 17.2.3 Aeroqual Limited
- 17.2.3.1. Overview
- 17.2.3.2. Products
- 17.2.3.3. SWOT Analysis
- 17.2.3.4. Recent Developments
- 17.2.3.5. Financials (Based on Availability)
- 17.2.4 EcoSensors
- 17.2.4.1. Overview
- 17.2.4.2. Products
- 17.2.4.3. SWOT Analysis
- 17.2.4.4. Recent Developments
- 17.2.4.5. Financials (Based on Availability)
- 17.2.5 Renesas Electronics Corporation
- 17.2.5.1. Overview
- 17.2.5.2. Products
- 17.2.5.3. SWOT Analysis
- 17.2.5.4. Recent Developments
- 17.2.5.5. Financials (Based on Availability)
- 17.2.6 Alphasense
- 17.2.6.1. Overview
- 17.2.6.2. Products
- 17.2.6.3. SWOT Analysis
- 17.2.6.4. Recent Developments
- 17.2.6.5. Financials (Based on Availability)
- 17.2.7 SGX Sensortech Limited
- 17.2.7.1. Overview
- 17.2.7.2. Products
- 17.2.7.3. SWOT Analysis
- 17.2.7.4. Recent Developments
- 17.2.7.5. Financials (Based on Availability)
- 17.2.8 GfG Europe Ltd
- 17.2.8.1. Overview
- 17.2.8.2. Products
- 17.2.8.3. SWOT Analysis
- 17.2.8.4. Recent Developments
- 17.2.8.5. Financials (Based on Availability)
- 17.2.9 Ion Science Ltd
- 17.2.9.1. Overview
- 17.2.9.2. Products
- 17.2.9.3. SWOT Analysis
- 17.2.9.4. Recent Developments
- 17.2.9.5. Financials (Based on Availability)
- 17.2.1 ABB Ltd
List of Figures
- Figure 1: Global Volatile Organic Compound Gas Sensor Industry Revenue Breakdown (Million, %) by Region 2024 & 2032
- Figure 2: North America Volatile Organic Compound Gas Sensor Industry Revenue (Million), by Country 2024 & 2032
- Figure 3: North America Volatile Organic Compound Gas Sensor Industry Revenue Share (%), by Country 2024 & 2032
- Figure 4: Europe Volatile Organic Compound Gas Sensor Industry Revenue (Million), by Country 2024 & 2032
- Figure 5: Europe Volatile Organic Compound Gas Sensor Industry Revenue Share (%), by Country 2024 & 2032
- Figure 6: Asia Pacific Volatile Organic Compound Gas Sensor Industry Revenue (Million), by Country 2024 & 2032
- Figure 7: Asia Pacific Volatile Organic Compound Gas Sensor Industry Revenue Share (%), by Country 2024 & 2032
- Figure 8: South America Volatile Organic Compound Gas Sensor Industry Revenue (Million), by Country 2024 & 2032
- Figure 9: South America Volatile Organic Compound Gas Sensor Industry Revenue Share (%), by Country 2024 & 2032
- Figure 10: MEA Volatile Organic Compound Gas Sensor Industry Revenue (Million), by Country 2024 & 2032
- Figure 11: MEA Volatile Organic Compound Gas Sensor Industry Revenue Share (%), by Country 2024 & 2032
- Figure 12: North America Volatile Organic Compound Gas Sensor Industry Revenue (Million), by Product Type 2024 & 2032
- Figure 13: North America Volatile Organic Compound Gas Sensor Industry Revenue Share (%), by Product Type 2024 & 2032
- Figure 14: North America Volatile Organic Compound Gas Sensor Industry Revenue (Million), by End-Use 2024 & 2032
- Figure 15: North America Volatile Organic Compound Gas Sensor Industry Revenue Share (%), by End-Use 2024 & 2032
- Figure 16: North America Volatile Organic Compound Gas Sensor Industry Revenue (Million), by Country 2024 & 2032
- Figure 17: North America Volatile Organic Compound Gas Sensor Industry Revenue Share (%), by Country 2024 & 2032
- Figure 18: Europe Volatile Organic Compound Gas Sensor Industry Revenue (Million), by Product Type 2024 & 2032
- Figure 19: Europe Volatile Organic Compound Gas Sensor Industry Revenue Share (%), by Product Type 2024 & 2032
- Figure 20: Europe Volatile Organic Compound Gas Sensor Industry Revenue (Million), by End-Use 2024 & 2032
- Figure 21: Europe Volatile Organic Compound Gas Sensor Industry Revenue Share (%), by End-Use 2024 & 2032
- Figure 22: Europe Volatile Organic Compound Gas Sensor Industry Revenue (Million), by Country 2024 & 2032
- Figure 23: Europe Volatile Organic Compound Gas Sensor Industry Revenue Share (%), by Country 2024 & 2032
- Figure 24: Asia Volatile Organic Compound Gas Sensor Industry Revenue (Million), by Product Type 2024 & 2032
- Figure 25: Asia Volatile Organic Compound Gas Sensor Industry Revenue Share (%), by Product Type 2024 & 2032
- Figure 26: Asia Volatile Organic Compound Gas Sensor Industry Revenue (Million), by End-Use 2024 & 2032
- Figure 27: Asia Volatile Organic Compound Gas Sensor Industry Revenue Share (%), by End-Use 2024 & 2032
- Figure 28: Asia Volatile Organic Compound Gas Sensor Industry Revenue (Million), by Country 2024 & 2032
- Figure 29: Asia Volatile Organic Compound Gas Sensor Industry Revenue Share (%), by Country 2024 & 2032
- Figure 30: Australia and New Zealand Volatile Organic Compound Gas Sensor Industry Revenue (Million), by Product Type 2024 & 2032
- Figure 31: Australia and New Zealand Volatile Organic Compound Gas Sensor Industry Revenue Share (%), by Product Type 2024 & 2032
- Figure 32: Australia and New Zealand Volatile Organic Compound Gas Sensor Industry Revenue (Million), by End-Use 2024 & 2032
- Figure 33: Australia and New Zealand Volatile Organic Compound Gas Sensor Industry Revenue Share (%), by End-Use 2024 & 2032
- Figure 34: Australia and New Zealand Volatile Organic Compound Gas Sensor Industry Revenue (Million), by Country 2024 & 2032
- Figure 35: Australia and New Zealand Volatile Organic Compound Gas Sensor Industry Revenue Share (%), by Country 2024 & 2032
- Figure 36: Latin America Volatile Organic Compound Gas Sensor Industry Revenue (Million), by Product Type 2024 & 2032
- Figure 37: Latin America Volatile Organic Compound Gas Sensor Industry Revenue Share (%), by Product Type 2024 & 2032
- Figure 38: Latin America Volatile Organic Compound Gas Sensor Industry Revenue (Million), by End-Use 2024 & 2032
- Figure 39: Latin America Volatile Organic Compound Gas Sensor Industry Revenue Share (%), by End-Use 2024 & 2032
- Figure 40: Latin America Volatile Organic Compound Gas Sensor Industry Revenue (Million), by Country 2024 & 2032
- Figure 41: Latin America Volatile Organic Compound Gas Sensor Industry Revenue Share (%), by Country 2024 & 2032
- Figure 42: Middle East and Africa Volatile Organic Compound Gas Sensor Industry Revenue (Million), by Product Type 2024 & 2032
- Figure 43: Middle East and Africa Volatile Organic Compound Gas Sensor Industry Revenue Share (%), by Product Type 2024 & 2032
- Figure 44: Middle East and Africa Volatile Organic Compound Gas Sensor Industry Revenue (Million), by End-Use 2024 & 2032
- Figure 45: Middle East and Africa Volatile Organic Compound Gas Sensor Industry Revenue Share (%), by End-Use 2024 & 2032
- Figure 46: Middle East and Africa Volatile Organic Compound Gas Sensor Industry Revenue (Million), by Country 2024 & 2032
- Figure 47: Middle East and Africa Volatile Organic Compound Gas Sensor Industry Revenue Share (%), by Country 2024 & 2032
List of Tables
- Table 1: Global Volatile Organic Compound Gas Sensor Industry Revenue Million Forecast, by Region 2019 & 2032
- Table 2: Global Volatile Organic Compound Gas Sensor Industry Revenue Million Forecast, by Product Type 2019 & 2032
- Table 3: Global Volatile Organic Compound Gas Sensor Industry Revenue Million Forecast, by End-Use 2019 & 2032
- Table 4: Global Volatile Organic Compound Gas Sensor Industry Revenue Million Forecast, by Region 2019 & 2032
- Table 5: Global Volatile Organic Compound Gas Sensor Industry Revenue Million Forecast, by Country 2019 & 2032
- Table 6: United States Volatile Organic Compound Gas Sensor Industry Revenue (Million) Forecast, by Application 2019 & 2032
- Table 7: Canada Volatile Organic Compound Gas Sensor Industry Revenue (Million) Forecast, by Application 2019 & 2032
- Table 8: Mexico Volatile Organic Compound Gas Sensor Industry Revenue (Million) Forecast, by Application 2019 & 2032
- Table 9: Global Volatile Organic Compound Gas Sensor Industry Revenue Million Forecast, by Country 2019 & 2032
- Table 10: Germany Volatile Organic Compound Gas Sensor Industry Revenue (Million) Forecast, by Application 2019 & 2032
- Table 11: United Kingdom Volatile Organic Compound Gas Sensor Industry Revenue (Million) Forecast, by Application 2019 & 2032
- Table 12: France Volatile Organic Compound Gas Sensor Industry Revenue (Million) Forecast, by Application 2019 & 2032
- Table 13: Spain Volatile Organic Compound Gas Sensor Industry Revenue (Million) Forecast, by Application 2019 & 2032
- Table 14: Italy Volatile Organic Compound Gas Sensor Industry Revenue (Million) Forecast, by Application 2019 & 2032
- Table 15: Spain Volatile Organic Compound Gas Sensor Industry Revenue (Million) Forecast, by Application 2019 & 2032
- Table 16: Belgium Volatile Organic Compound Gas Sensor Industry Revenue (Million) Forecast, by Application 2019 & 2032
- Table 17: Netherland Volatile Organic Compound Gas Sensor Industry Revenue (Million) Forecast, by Application 2019 & 2032
- Table 18: Nordics Volatile Organic Compound Gas Sensor Industry Revenue (Million) Forecast, by Application 2019 & 2032
- Table 19: Rest of Europe Volatile Organic Compound Gas Sensor Industry Revenue (Million) Forecast, by Application 2019 & 2032
- Table 20: Global Volatile Organic Compound Gas Sensor Industry Revenue Million Forecast, by Country 2019 & 2032
- Table 21: China Volatile Organic Compound Gas Sensor Industry Revenue (Million) Forecast, by Application 2019 & 2032
- Table 22: Japan Volatile Organic Compound Gas Sensor Industry Revenue (Million) Forecast, by Application 2019 & 2032
- Table 23: India Volatile Organic Compound Gas Sensor Industry Revenue (Million) Forecast, by Application 2019 & 2032
- Table 24: South Korea Volatile Organic Compound Gas Sensor Industry Revenue (Million) Forecast, by Application 2019 & 2032
- Table 25: Southeast Asia Volatile Organic Compound Gas Sensor Industry Revenue (Million) Forecast, by Application 2019 & 2032
- Table 26: Australia Volatile Organic Compound Gas Sensor Industry Revenue (Million) Forecast, by Application 2019 & 2032
- Table 27: Indonesia Volatile Organic Compound Gas Sensor Industry Revenue (Million) Forecast, by Application 2019 & 2032
- Table 28: Phillipes Volatile Organic Compound Gas Sensor Industry Revenue (Million) Forecast, by Application 2019 & 2032
- Table 29: Singapore Volatile Organic Compound Gas Sensor Industry Revenue (Million) Forecast, by Application 2019 & 2032
- Table 30: Thailandc Volatile Organic Compound Gas Sensor Industry Revenue (Million) Forecast, by Application 2019 & 2032
- Table 31: Rest of Asia Pacific Volatile Organic Compound Gas Sensor Industry Revenue (Million) Forecast, by Application 2019 & 2032
- Table 32: Global Volatile Organic Compound Gas Sensor Industry Revenue Million Forecast, by Country 2019 & 2032
- Table 33: Brazil Volatile Organic Compound Gas Sensor Industry Revenue (Million) Forecast, by Application 2019 & 2032
- Table 34: Argentina Volatile Organic Compound Gas Sensor Industry Revenue (Million) Forecast, by Application 2019 & 2032
- Table 35: Peru Volatile Organic Compound Gas Sensor Industry Revenue (Million) Forecast, by Application 2019 & 2032
- Table 36: Chile Volatile Organic Compound Gas Sensor Industry Revenue (Million) Forecast, by Application 2019 & 2032
- Table 37: Colombia Volatile Organic Compound Gas Sensor Industry Revenue (Million) Forecast, by Application 2019 & 2032
- Table 38: Ecuador Volatile Organic Compound Gas Sensor Industry Revenue (Million) Forecast, by Application 2019 & 2032
- Table 39: Venezuela Volatile Organic Compound Gas Sensor Industry Revenue (Million) Forecast, by Application 2019 & 2032
- Table 40: Rest of South America Volatile Organic Compound Gas Sensor Industry Revenue (Million) Forecast, by Application 2019 & 2032
- Table 41: Global Volatile Organic Compound Gas Sensor Industry Revenue Million Forecast, by Country 2019 & 2032
- Table 42: United Arab Emirates Volatile Organic Compound Gas Sensor Industry Revenue (Million) Forecast, by Application 2019 & 2032
- Table 43: Saudi Arabia Volatile Organic Compound Gas Sensor Industry Revenue (Million) Forecast, by Application 2019 & 2032
- Table 44: South Africa Volatile Organic Compound Gas Sensor Industry Revenue (Million) Forecast, by Application 2019 & 2032
- Table 45: Rest of Middle East and Africa Volatile Organic Compound Gas Sensor Industry Revenue (Million) Forecast, by Application 2019 & 2032
- Table 46: Global Volatile Organic Compound Gas Sensor Industry Revenue Million Forecast, by Product Type 2019 & 2032
- Table 47: Global Volatile Organic Compound Gas Sensor Industry Revenue Million Forecast, by End-Use 2019 & 2032
- Table 48: Global Volatile Organic Compound Gas Sensor Industry Revenue Million Forecast, by Country 2019 & 2032
- Table 49: Global Volatile Organic Compound Gas Sensor Industry Revenue Million Forecast, by Product Type 2019 & 2032
- Table 50: Global Volatile Organic Compound Gas Sensor Industry Revenue Million Forecast, by End-Use 2019 & 2032
- Table 51: Global Volatile Organic Compound Gas Sensor Industry Revenue Million Forecast, by Country 2019 & 2032
- Table 52: Global Volatile Organic Compound Gas Sensor Industry Revenue Million Forecast, by Product Type 2019 & 2032
- Table 53: Global Volatile Organic Compound Gas Sensor Industry Revenue Million Forecast, by End-Use 2019 & 2032
- Table 54: Global Volatile Organic Compound Gas Sensor Industry Revenue Million Forecast, by Country 2019 & 2032
- Table 55: Global Volatile Organic Compound Gas Sensor Industry Revenue Million Forecast, by Product Type 2019 & 2032
- Table 56: Global Volatile Organic Compound Gas Sensor Industry Revenue Million Forecast, by End-Use 2019 & 2032
- Table 57: Global Volatile Organic Compound Gas Sensor Industry Revenue Million Forecast, by Country 2019 & 2032
- Table 58: Global Volatile Organic Compound Gas Sensor Industry Revenue Million Forecast, by Product Type 2019 & 2032
- Table 59: Global Volatile Organic Compound Gas Sensor Industry Revenue Million Forecast, by End-Use 2019 & 2032
- Table 60: Global Volatile Organic Compound Gas Sensor Industry Revenue Million Forecast, by Country 2019 & 2032
- Table 61: Global Volatile Organic Compound Gas Sensor Industry Revenue Million Forecast, by Product Type 2019 & 2032
- Table 62: Global Volatile Organic Compound Gas Sensor Industry Revenue Million Forecast, by End-Use 2019 & 2032
- Table 63: Global Volatile Organic Compound Gas Sensor Industry Revenue Million Forecast, by Country 2019 & 2032
Frequently Asked Questions
1. What is the projected Compound Annual Growth Rate (CAGR) of the Volatile Organic Compound Gas Sensor Industry?
The projected CAGR is approximately > 7.00%.
2. Which companies are prominent players in the Volatile Organic Compound Gas Sensor Industry?
Key companies in the market include ABB Ltd, MicroJet Technology Co Ltd, Aeroqual Limited, EcoSensors, Renesas Electronics Corporation, Alphasense, SGX Sensortech Limited, GfG Europe Ltd, Ion Science Ltd.
3. What are the main segments of the Volatile Organic Compound Gas Sensor Industry?
The market segments include Product Type , End-Use .
4. Can you provide details about the market size?
The market size is estimated to be USD XX Million as of 2022.
5. What are some drivers contributing to market growth?
; Stringent Government Regulations to Control VOC Emissions; Increasing Use of Wireless and Smart Sensing Technology.
6. What are the notable trends driving market growth?
Oil & Gas Industry to Drive the Market Growth.
7. Are there any restraints impacting market growth?
; Interopereability Issues.
8. Can you provide examples of recent developments in the market?
N/A
9. What pricing options are available for accessing the report?
Pricing options include single-user, multi-user, and enterprise licenses priced at USD 4750, USD 5250, and USD 8750 respectively.
10. Is the market size provided in terms of value or volume?
The market size is provided in terms of value, measured in Million.
11. Are there any specific market keywords associated with the report?
Yes, the market keyword associated with the report is "Volatile Organic Compound Gas Sensor Industry," which aids in identifying and referencing the specific market segment covered.
12. How do I determine which pricing option suits my needs best?
The pricing options vary based on user requirements and access needs. Individual users may opt for single-user licenses, while businesses requiring broader access may choose multi-user or enterprise licenses for cost-effective access to the report.
13. Are there any additional resources or data provided in the Volatile Organic Compound Gas Sensor Industry report?
While the report offers comprehensive insights, it's advisable to review the specific contents or supplementary materials provided to ascertain if additional resources or data are available.
14. How can I stay updated on further developments or reports in the Volatile Organic Compound Gas Sensor Industry?
To stay informed about further developments, trends, and reports in the Volatile Organic Compound Gas Sensor Industry, consider subscribing to industry newsletters, following relevant companies and organizations, or regularly checking reputable industry news sources and publications.
Methodology
Step 1 - Identification of Relevant Samples Size from Population Database


Step 2 - Approaches for Defining Global Market Size (Value, Volume* & Price*)

Note*: In applicable scenarios
Step 3 - Data Sources
Primary Research
- Web Analytics
- Survey Reports
- Research Institute
- Latest Research Reports
- Opinion Leaders
Secondary Research
- Annual Reports
- White Paper
- Latest Press Release
- Industry Association
- Paid Database
- Investor Presentations

Step 4 - Data Triangulation
Involves using different sources of information in order to increase the validity of a study
These sources are likely to be stakeholders in a program - participants, other researchers, program staff, other community members, and so on.
Then we put all data in single framework & apply various statistical tools to find out the dynamic on the market.
During the analysis stage, feedback from the stakeholder groups would be compared to determine areas of agreement as well as areas of divergence
