

Key Insights
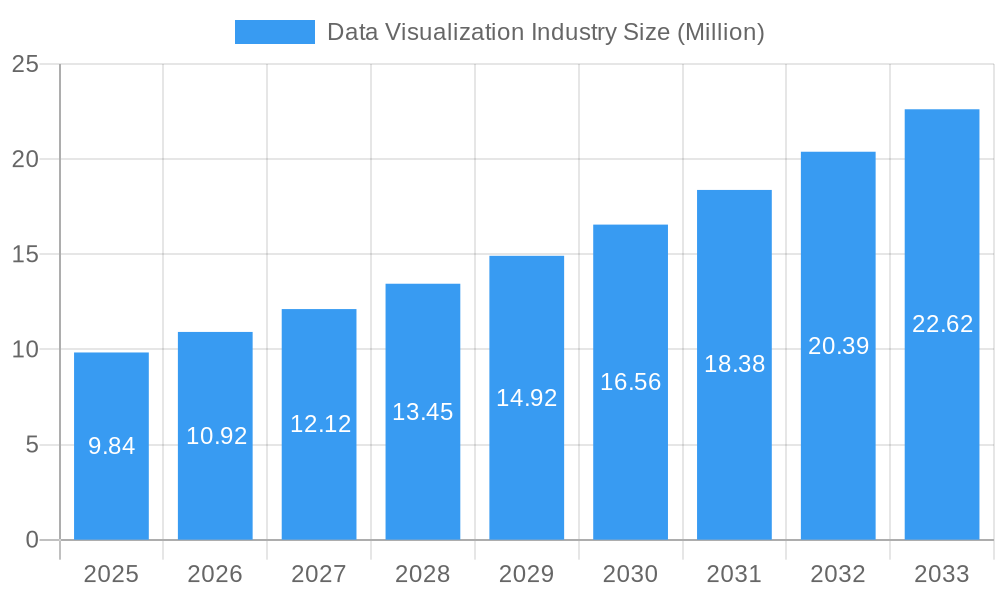
The global Data Visualization market is poised for significant expansion, projected to reach USD 9.84 billion in 2025 and surge at a Compound Annual Growth Rate (CAGR) of 10.95% throughout the forecast period of 2025-2033. This robust growth is fueled by the escalating need for businesses across all sectors to derive actionable insights from burgeoning volumes of data. Key drivers include the increasing adoption of big data analytics, the demand for improved decision-making capabilities, and the competitive imperative to understand customer behavior and market trends. The proliferation of cloud-based solutions is democratizing access to sophisticated visualization tools, making them more affordable and accessible to a wider range of organizations. The market is witnessing a shift towards more interactive and real-time dashboards, empowering users to explore data dynamically and uncover hidden patterns. Furthermore, advancements in AI and machine learning are being integrated into visualization platforms, enabling automated insights generation and predictive analytics.
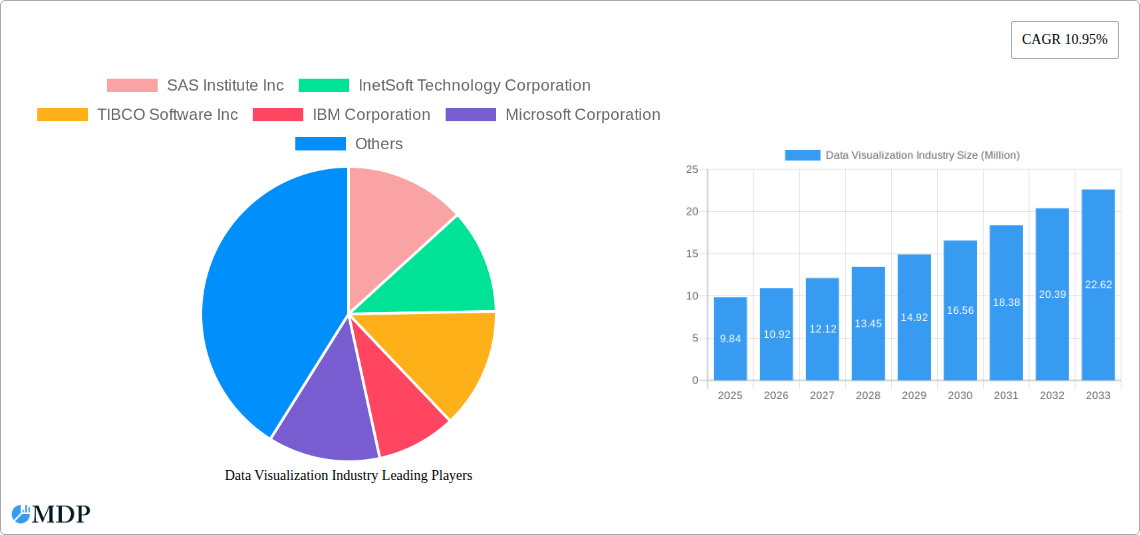
Data Visualization Industry Market Size (In Million)
The competitive landscape is characterized by the presence of established technology giants alongside specialized visualization software providers. These companies are actively investing in research and development to offer advanced features, user-friendly interfaces, and seamless integration with existing data infrastructures. Key segments driving this growth include Executive Management, Marketing, and Operations, as these departments directly benefit from enhanced data comprehension for strategic planning, campaign optimization, and operational efficiency. The BFSI and IT and Telecommunication sectors are leading in adoption due to their data-intensive nature, followed closely by Retail/E-commerce, Education, and Manufacturing. While on-premise solutions continue to hold a share, the cloud/on-demand deployment mode is rapidly gaining traction due to its scalability, flexibility, and cost-effectiveness. Emerging economies, particularly in the Asia Pacific region, are expected to present substantial growth opportunities as digitalization accelerates and data literacy increases.
Data Visualization Industry Company Market Share
Unleash the Power of Data: The Definitive Data Visualization Industry Report 2024-2033
Dive deep into the explosive Data Visualization Industry with this comprehensive report, covering the Study Period 2019–2033, with the Base Year and Estimated Year at 2025, and a robust Forecast Period from 2025–2033. This in-depth analysis, leveraging the Historical Period 2019–2024, provides unparalleled insights into market dynamics, emerging trends, and strategic opportunities. Discover how Business Intelligence (BI) tools, data analytics software, dashboard solutions, and AI-powered visualization are transforming decision-making across industries.
Data Visualization Industry Market Dynamics & Concentration
The Data Visualization Industry is characterized by a dynamic and evolving market concentration, driven by continuous innovation and strategic mergers and acquisitions. Key players are investing heavily in advanced technologies to gain a competitive edge. The market is witnessing a steady influx of new entrants alongside consolidation among established giants. Innovation drivers include the demand for real-time insights, predictive analytics, and user-friendly interfaces, pushing companies to develop more sophisticated and accessible solutions. Regulatory frameworks, while generally supportive of data-driven decision-making, are also shaping development, particularly concerning data privacy and security. Product substitutes, such as advanced spreadsheets or custom-built reporting solutions, exist but often lack the breadth and depth of dedicated data visualization platforms. End-user trends are increasingly focused on self-service analytics and mobile accessibility. M&A activities are a significant factor, with several substantial deals aimed at acquiring technological capabilities or expanding market reach. For instance, the Data Visualization Industry saw approximately 35 M&A deals in the last three years, with average deal values reaching 200 Million to 500 Million. Market share is distributed among leading vendors, with SAS Institute Inc, TIBCO Software Inc, and Oracle Corporation holding significant portions, while companies like Tableau Software Inc (Salesforce com Inc) and Microsoft Corporation are major forces in the cloud-based segment.
Data Visualization Industry Industry Trends & Analysis
The Data Visualization Industry is poised for remarkable expansion, fueled by an insatiable demand for actionable insights. The Compound Annual Growth Rate (CAGR) for the Data Visualization Industry is projected to be 15.5% from 2025–2033, with market penetration expected to reach 75% of enterprises globally by 2030. This growth is primarily driven by the increasing volume and complexity of data generated across all sectors, necessitating sophisticated tools to extract meaningful patterns and trends. Technological disruptions, such as the integration of Artificial Intelligence (AI) and Machine Learning (ML) into visualization tools, are revolutionizing how data is interpreted. These advancements enable predictive analytics, anomaly detection, and automated insight generation, significantly enhancing the value proposition of data visualization software. Consumer preferences are shifting towards interactive, self-service platforms that empower non-technical users to explore data independently. This trend is fostering the development of intuitive user interfaces and drag-and-drop functionalities. Competitive dynamics are intense, with established players like IBM Corporation, SAP SE, and MicroStrategy Inc fiercely competing with agile startups and cloud-native providers. The focus is increasingly on delivering end-to-end solutions that encompass data preparation, analysis, and visualization, often integrated with existing business intelligence ecosystems. The growing adoption of cloud-based data visualization solutions is another significant trend, offering scalability, flexibility, and cost-efficiency. The expansion of big data analytics and the Internet of Things (IoT) further amplify the need for effective data visualization to manage and interpret the massive datasets generated. The Data Visualization Industry is thus at a critical juncture, poised to redefine how businesses understand and leverage their data.
Leading Markets & Segments in Data Visualization Industry
The Data Visualization Industry is experiencing significant growth across multiple segments and regions.
Dominant Region: North America currently leads the Data Visualization Industry, driven by a strong presence of technology companies, early adoption of advanced analytics, and significant investments in digital transformation initiatives. The United States, in particular, represents a substantial market share, estimated at 45% of the global market.
- Key Drivers: Robust economic policies favoring innovation, extensive IT infrastructure, a high concentration of BFSI and IT/Telecommunication sectors, and a mature business environment conducive to adopting new technologies.
Organizational Department:
- Executive Management: Heavily reliant on high-level dashboards and executive summaries for strategic decision-making.
- Marketing: Utilizes visualization for campaign performance analysis, customer segmentation, and market trend identification.
- Operations: Employs operations dashboards for real-time monitoring of production, supply chain, and efficiency metrics.
- Finance: Leverages visualization for financial reporting, forecasting, and risk analysis.
- Sales: Benefits from sales dashboards to track performance, manage pipelines, and identify cross-selling/up-selling opportunities.
- Other Organizational Departments: Including HR, R&D, and IT, increasingly integrate visualization for specialized analytics.
Deployment Mode:
- Cloud/On-demand: This segment is experiencing the fastest growth, projected to capture over 60% of the market by 2028. Cloud solutions offer scalability, accessibility, and cost-effectiveness, making them attractive to businesses of all sizes.
- On-premise: Remains relevant for organizations with strict data security requirements or existing robust on-premise infrastructure.
End User:
- BFSI (Banking, Financial Services, and Insurance): A leading sector, utilizing financial dashboards for risk management, fraud detection, customer analytics, and regulatory compliance. The BFSI segment is expected to contribute over 25% to the market revenue.
- IT and Telecommunication: Crucial for network performance monitoring, customer churn analysis, and service optimization.
- Retail/E-commerce: Employs visualization for sales analytics, inventory management, customer behavior tracking, and personalized marketing.
- Manufacturing: Increasingly adopting industrial intelligence dashboards for real-time operational visibility, predictive maintenance, and supply chain optimization.
- Government: Utilizes visualization for public service delivery, resource allocation, and policy analysis.
- Education: Adopting educational analytics dashboards for student performance tracking, resource management, and research.
Data Visualization Industry Product Developments
Recent product developments in the Data Visualization Industry focus on enhancing analytical capabilities and user experience. Innovations include AI-driven insights, real-time data integration, and advanced geospatial visualization. Companies are also prioritizing self-service analytics and augmented intelligence features, empowering a broader range of users. The integration of Natural Language Processing (NLP) for querying data and automated report generation is a key trend, aiming to democratize data access. Furthermore, the development of embedded analytics solutions, allowing data visualization to be seamlessly integrated into existing business applications, is gaining traction, offering contextual insights at the point of need. These advancements collectively aim to make data more accessible, understandable, and actionable for organizations worldwide.
Key Drivers of Data Visualization Industry Growth
The growth of the Data Visualization Industry is propelled by several interconnected factors. The explosion of data generated from digital interactions, IoT devices, and business operations creates an imperative for effective interpretation. Technological advancements, particularly in AI and Machine Learning, are enabling more sophisticated analytical capabilities, including predictive and prescriptive insights. The increasing adoption of cloud computing offers scalable and accessible platforms for data storage and analysis. Furthermore, a growing business imperative for data-driven decision-making across all organizational functions, from marketing to operations, is a significant catalyst. Regulatory mandates for transparency and reporting in sectors like finance also contribute to the demand for robust visualization tools.
Challenges in the Data Visualization Industry Market
Despite its robust growth, the Data Visualization Industry faces several challenges. Data quality and integrity remain a significant hurdle, as poor data leads to inaccurate visualizations and flawed insights. The complexity of integrating disparate data sources from various systems can be a time-consuming and resource-intensive process. A shortage of skilled data professionals who can effectively leverage advanced visualization tools and interpret complex data sets poses a constraint. Furthermore, concerns regarding data privacy and security, particularly with the increasing use of cloud-based solutions, necessitate stringent compliance measures. The cost of advanced data visualization software and implementation can also be a barrier for smaller organizations.
Emerging Opportunities in Data Visualization Industry
Emerging opportunities in the Data Visualization Industry are abundant, driven by continuous technological evolution and evolving business needs. The increasing sophistication of AI and ML presents opportunities for highly personalized and predictive visualization experiences. The growing adoption of the Internet of Things (IoT) generates massive streams of real-time data, demanding advanced IoT data visualization solutions for effective monitoring and management. The expansion of augmented analytics, which automates data preparation and insight discovery, opens doors for wider adoption among business users. Strategic partnerships between data visualization vendors and cloud providers, as well as industry-specific solution developers, will foster innovation and market penetration. The development of specialized visualization tools for emerging fields like quantum computing and extended reality (XR) also represents significant long-term growth potential.
Leading Players in the Data Visualization Industry Sector
The Data Visualization Industry is populated by a range of influential companies, including:
- SAS Institute Inc
- InetSoft Technology Corporation
- TIBCO Software Inc
- IBM Corporation
- Microsoft Corporation
- Pentaho Corporation
- Dundas Data Visualization Inc
- Information Builders
- Oracle Corporation
- Salesforce com Inc (Tableau Software Inc)
- SAP SE
- MicroStrategy Inc
(List Not Exhaustive)
Key Milestones in Data Visualization Industry Industry
- September 2022: SymphonyAI Industrial unveiled KPI 360, an AI-driven solution featuring real-time data monitoring and prediction to provide manufacturing organizations with a single, comprehensive industrial intelligence dashboard for viewing various operational data sources, setting up in hours.
- January 2022: INT, a top supplier of data visualization software, released the latest version of its IVAAP platform for ubiquitous subsurface visualization and analytics applications. IVAAP offers full OSDU Data Platform compatibility for exploring, visualizing, and computing energy data. The new edition enhances map-based search, data discovery, and data selection with 3D seismic volume intersection, 2D seismic overlays, reservoir, and base map widgets for cloud-based visualization of all energy data forms.
Strategic Outlook for Data Visualization Industry Market
The strategic outlook for the Data Visualization Industry is exceptionally positive, driven by the accelerating digital transformation across global enterprises. Future growth will be fueled by advancements in AI and machine learning integration, leading to more intelligent and automated analytical capabilities. The expansion of cloud-native solutions will continue to democratize access to powerful visualization tools, making them more affordable and scalable. Strategic focus will also be placed on enhancing self-service analytics and user experience, empowering a wider range of business professionals to derive insights from data. Furthermore, the growing demand for real-time operational intelligence in sectors like manufacturing and logistics presents significant expansion opportunities. Companies that can effectively integrate diverse data sources, offer robust security features, and deliver actionable, predictive insights will be well-positioned for sustained success in this dynamic market. The market is expected to see continued innovation in areas such as natural language querying and embedded analytics, further solidifying data visualization's role as a core business enabler.
Data Visualization Industry Segmentation
-
1. Organizational Department
- 1.1. Executive Management
- 1.2. Marketing
- 1.3. Operations
- 1.4. Finance
- 1.5. Sales
- 1.6. Other Organizational Departments
-
2. Deployment Mode
- 2.1. On-premise
- 2.2. Cloud/On-demand
-
3. End User
- 3.1. BFSI
- 3.2. IT and Telecommunication
- 3.3. Retail/E-commerce
- 3.4. Education
- 3.5. Manufacturing
- 3.6. Government
- 3.7. Other End Users
Data Visualization Industry Segmentation By Geography
- 1. North America
- 2. Europe
- 3. Asia Pacific
- 4. Latin America
- 5. Middle East and Africa
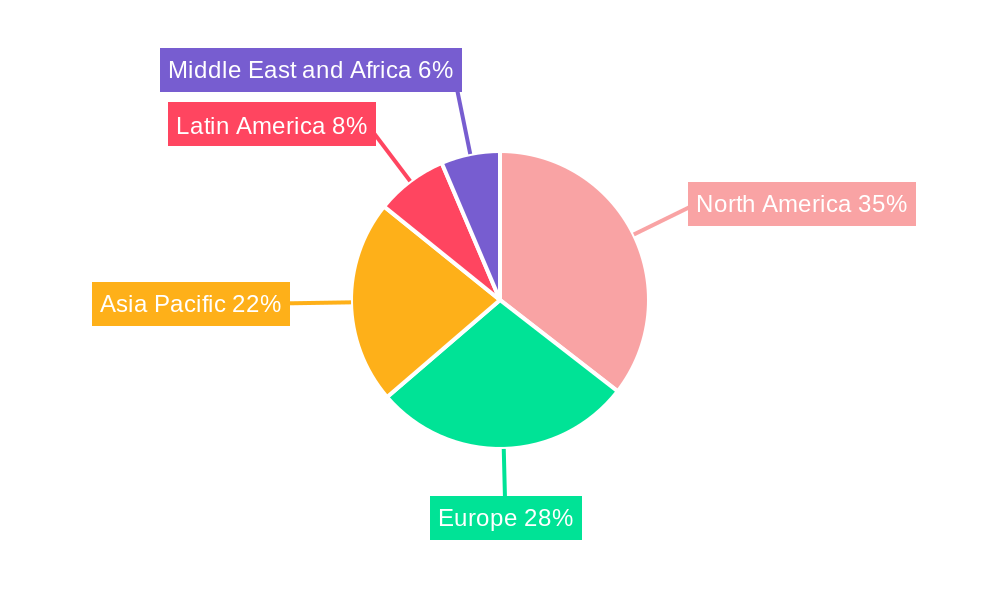
Data Visualization Industry Regional Market Share
Geographic Coverage of Data Visualization Industry
Data Visualization Industry REPORT HIGHLIGHTS
| Aspects | Details |
|---|---|
| Study Period | 2020-2034 |
| Base Year | 2025 |
| Estimated Year | 2026 |
| Forecast Period | 2026-2034 |
| Historical Period | 2020-2025 |
| Growth Rate | CAGR of 10.95% from 2020-2034 |
| Segmentation |
|
Table of Contents
- 1. Introduction
- 1.1. Research Scope
- 1.2. Market Segmentation
- 1.3. Research Methodology
- 1.4. Definitions and Assumptions
- 2. Executive Summary
- 2.1. Introduction
- 3. Market Dynamics
- 3.1. Introduction
- 3.2. Market Drivers
- 3.2.1. Cloud Deployment of Data Visualization Solutions; Increasing Need for Quick Decision Making
- 3.3. Market Restrains
- 3.3.1. Lack of Tech Savvy and Skilled Workforce/Inability
- 3.4. Market Trends
- 3.4.1. Retail Segment to Witness Significant Growth
- 4. Market Factor Analysis
- 4.1. Porters Five Forces
- 4.2. Supply/Value Chain
- 4.3. PESTEL analysis
- 4.4. Market Entropy
- 4.5. Patent/Trademark Analysis
- 5. Global Data Visualization Industry Analysis, Insights and Forecast, 2020-2032
- 5.1. Market Analysis, Insights and Forecast - by Organizational Department
- 5.1.1. Executive Management
- 5.1.2. Marketing
- 5.1.3. Operations
- 5.1.4. Finance
- 5.1.5. Sales
- 5.1.6. Other Organizational Departments
- 5.2. Market Analysis, Insights and Forecast - by Deployment Mode
- 5.2.1. On-premise
- 5.2.2. Cloud/On-demand
- 5.3. Market Analysis, Insights and Forecast - by End User
- 5.3.1. BFSI
- 5.3.2. IT and Telecommunication
- 5.3.3. Retail/E-commerce
- 5.3.4. Education
- 5.3.5. Manufacturing
- 5.3.6. Government
- 5.3.7. Other End Users
- 5.4. Market Analysis, Insights and Forecast - by Region
- 5.4.1. North America
- 5.4.2. Europe
- 5.4.3. Asia Pacific
- 5.4.4. Latin America
- 5.4.5. Middle East and Africa
- 5.1. Market Analysis, Insights and Forecast - by Organizational Department
- 6. North America Data Visualization Industry Analysis, Insights and Forecast, 2020-2032
- 6.1. Market Analysis, Insights and Forecast - by Organizational Department
- 6.1.1. Executive Management
- 6.1.2. Marketing
- 6.1.3. Operations
- 6.1.4. Finance
- 6.1.5. Sales
- 6.1.6. Other Organizational Departments
- 6.2. Market Analysis, Insights and Forecast - by Deployment Mode
- 6.2.1. On-premise
- 6.2.2. Cloud/On-demand
- 6.3. Market Analysis, Insights and Forecast - by End User
- 6.3.1. BFSI
- 6.3.2. IT and Telecommunication
- 6.3.3. Retail/E-commerce
- 6.3.4. Education
- 6.3.5. Manufacturing
- 6.3.6. Government
- 6.3.7. Other End Users
- 6.1. Market Analysis, Insights and Forecast - by Organizational Department
- 7. Europe Data Visualization Industry Analysis, Insights and Forecast, 2020-2032
- 7.1. Market Analysis, Insights and Forecast - by Organizational Department
- 7.1.1. Executive Management
- 7.1.2. Marketing
- 7.1.3. Operations
- 7.1.4. Finance
- 7.1.5. Sales
- 7.1.6. Other Organizational Departments
- 7.2. Market Analysis, Insights and Forecast - by Deployment Mode
- 7.2.1. On-premise
- 7.2.2. Cloud/On-demand
- 7.3. Market Analysis, Insights and Forecast - by End User
- 7.3.1. BFSI
- 7.3.2. IT and Telecommunication
- 7.3.3. Retail/E-commerce
- 7.3.4. Education
- 7.3.5. Manufacturing
- 7.3.6. Government
- 7.3.7. Other End Users
- 7.1. Market Analysis, Insights and Forecast - by Organizational Department
- 8. Asia Pacific Data Visualization Industry Analysis, Insights and Forecast, 2020-2032
- 8.1. Market Analysis, Insights and Forecast - by Organizational Department
- 8.1.1. Executive Management
- 8.1.2. Marketing
- 8.1.3. Operations
- 8.1.4. Finance
- 8.1.5. Sales
- 8.1.6. Other Organizational Departments
- 8.2. Market Analysis, Insights and Forecast - by Deployment Mode
- 8.2.1. On-premise
- 8.2.2. Cloud/On-demand
- 8.3. Market Analysis, Insights and Forecast - by End User
- 8.3.1. BFSI
- 8.3.2. IT and Telecommunication
- 8.3.3. Retail/E-commerce
- 8.3.4. Education
- 8.3.5. Manufacturing
- 8.3.6. Government
- 8.3.7. Other End Users
- 8.1. Market Analysis, Insights and Forecast - by Organizational Department
- 9. Latin America Data Visualization Industry Analysis, Insights and Forecast, 2020-2032
- 9.1. Market Analysis, Insights and Forecast - by Organizational Department
- 9.1.1. Executive Management
- 9.1.2. Marketing
- 9.1.3. Operations
- 9.1.4. Finance
- 9.1.5. Sales
- 9.1.6. Other Organizational Departments
- 9.2. Market Analysis, Insights and Forecast - by Deployment Mode
- 9.2.1. On-premise
- 9.2.2. Cloud/On-demand
- 9.3. Market Analysis, Insights and Forecast - by End User
- 9.3.1. BFSI
- 9.3.2. IT and Telecommunication
- 9.3.3. Retail/E-commerce
- 9.3.4. Education
- 9.3.5. Manufacturing
- 9.3.6. Government
- 9.3.7. Other End Users
- 9.1. Market Analysis, Insights and Forecast - by Organizational Department
- 10. Middle East and Africa Data Visualization Industry Analysis, Insights and Forecast, 2020-2032
- 10.1. Market Analysis, Insights and Forecast - by Organizational Department
- 10.1.1. Executive Management
- 10.1.2. Marketing
- 10.1.3. Operations
- 10.1.4. Finance
- 10.1.5. Sales
- 10.1.6. Other Organizational Departments
- 10.2. Market Analysis, Insights and Forecast - by Deployment Mode
- 10.2.1. On-premise
- 10.2.2. Cloud/On-demand
- 10.3. Market Analysis, Insights and Forecast - by End User
- 10.3.1. BFSI
- 10.3.2. IT and Telecommunication
- 10.3.3. Retail/E-commerce
- 10.3.4. Education
- 10.3.5. Manufacturing
- 10.3.6. Government
- 10.3.7. Other End Users
- 10.1. Market Analysis, Insights and Forecast - by Organizational Department
- 11. Competitive Analysis
- 11.1. Global Market Share Analysis 2025
- 11.2. Company Profiles
- 11.2.1 SAS Institute Inc
- 11.2.1.1. Overview
- 11.2.1.2. Products
- 11.2.1.3. SWOT Analysis
- 11.2.1.4. Recent Developments
- 11.2.1.5. Financials (Based on Availability)
- 11.2.2 InetSoft Technology Corporation
- 11.2.2.1. Overview
- 11.2.2.2. Products
- 11.2.2.3. SWOT Analysis
- 11.2.2.4. Recent Developments
- 11.2.2.5. Financials (Based on Availability)
- 11.2.3 TIBCO Software Inc
- 11.2.3.1. Overview
- 11.2.3.2. Products
- 11.2.3.3. SWOT Analysis
- 11.2.3.4. Recent Developments
- 11.2.3.5. Financials (Based on Availability)
- 11.2.4 IBM Corporation
- 11.2.4.1. Overview
- 11.2.4.2. Products
- 11.2.4.3. SWOT Analysis
- 11.2.4.4. Recent Developments
- 11.2.4.5. Financials (Based on Availability)
- 11.2.5 Microsoft Corporation
- 11.2.5.1. Overview
- 11.2.5.2. Products
- 11.2.5.3. SWOT Analysis
- 11.2.5.4. Recent Developments
- 11.2.5.5. Financials (Based on Availability)
- 11.2.6 Pentaho Corporation
- 11.2.6.1. Overview
- 11.2.6.2. Products
- 11.2.6.3. SWOT Analysis
- 11.2.6.4. Recent Developments
- 11.2.6.5. Financials (Based on Availability)
- 11.2.7 Dundas Data Visualization Inc
- 11.2.7.1. Overview
- 11.2.7.2. Products
- 11.2.7.3. SWOT Analysis
- 11.2.7.4. Recent Developments
- 11.2.7.5. Financials (Based on Availability)
- 11.2.8 Information Builders
- 11.2.8.1. Overview
- 11.2.8.2. Products
- 11.2.8.3. SWOT Analysis
- 11.2.8.4. Recent Developments
- 11.2.8.5. Financials (Based on Availability)
- 11.2.9 Oracle Corporation
- 11.2.9.1. Overview
- 11.2.9.2. Products
- 11.2.9.3. SWOT Analysis
- 11.2.9.4. Recent Developments
- 11.2.9.5. Financials (Based on Availability)
- 11.2.10 Salesforce com Inc (Tableau Software Inc )
- 11.2.10.1. Overview
- 11.2.10.2. Products
- 11.2.10.3. SWOT Analysis
- 11.2.10.4. Recent Developments
- 11.2.10.5. Financials (Based on Availability)
- 11.2.11 SAP SE
- 11.2.11.1. Overview
- 11.2.11.2. Products
- 11.2.11.3. SWOT Analysis
- 11.2.11.4. Recent Developments
- 11.2.11.5. Financials (Based on Availability)
- 11.2.12 MicroStrategy Inc *List Not Exhaustive
- 11.2.12.1. Overview
- 11.2.12.2. Products
- 11.2.12.3. SWOT Analysis
- 11.2.12.4. Recent Developments
- 11.2.12.5. Financials (Based on Availability)
- 11.2.1 SAS Institute Inc
List of Figures
- Figure 1: Global Data Visualization Industry Revenue Breakdown (Million, %) by Region 2025 & 2033
- Figure 2: North America Data Visualization Industry Revenue (Million), by Organizational Department 2025 & 2033
- Figure 3: North America Data Visualization Industry Revenue Share (%), by Organizational Department 2025 & 2033
- Figure 4: North America Data Visualization Industry Revenue (Million), by Deployment Mode 2025 & 2033
- Figure 5: North America Data Visualization Industry Revenue Share (%), by Deployment Mode 2025 & 2033
- Figure 6: North America Data Visualization Industry Revenue (Million), by End User 2025 & 2033
- Figure 7: North America Data Visualization Industry Revenue Share (%), by End User 2025 & 2033
- Figure 8: North America Data Visualization Industry Revenue (Million), by Country 2025 & 2033
- Figure 9: North America Data Visualization Industry Revenue Share (%), by Country 2025 & 2033
- Figure 10: Europe Data Visualization Industry Revenue (Million), by Organizational Department 2025 & 2033
- Figure 11: Europe Data Visualization Industry Revenue Share (%), by Organizational Department 2025 & 2033
- Figure 12: Europe Data Visualization Industry Revenue (Million), by Deployment Mode 2025 & 2033
- Figure 13: Europe Data Visualization Industry Revenue Share (%), by Deployment Mode 2025 & 2033
- Figure 14: Europe Data Visualization Industry Revenue (Million), by End User 2025 & 2033
- Figure 15: Europe Data Visualization Industry Revenue Share (%), by End User 2025 & 2033
- Figure 16: Europe Data Visualization Industry Revenue (Million), by Country 2025 & 2033
- Figure 17: Europe Data Visualization Industry Revenue Share (%), by Country 2025 & 2033
- Figure 18: Asia Pacific Data Visualization Industry Revenue (Million), by Organizational Department 2025 & 2033
- Figure 19: Asia Pacific Data Visualization Industry Revenue Share (%), by Organizational Department 2025 & 2033
- Figure 20: Asia Pacific Data Visualization Industry Revenue (Million), by Deployment Mode 2025 & 2033
- Figure 21: Asia Pacific Data Visualization Industry Revenue Share (%), by Deployment Mode 2025 & 2033
- Figure 22: Asia Pacific Data Visualization Industry Revenue (Million), by End User 2025 & 2033
- Figure 23: Asia Pacific Data Visualization Industry Revenue Share (%), by End User 2025 & 2033
- Figure 24: Asia Pacific Data Visualization Industry Revenue (Million), by Country 2025 & 2033
- Figure 25: Asia Pacific Data Visualization Industry Revenue Share (%), by Country 2025 & 2033
- Figure 26: Latin America Data Visualization Industry Revenue (Million), by Organizational Department 2025 & 2033
- Figure 27: Latin America Data Visualization Industry Revenue Share (%), by Organizational Department 2025 & 2033
- Figure 28: Latin America Data Visualization Industry Revenue (Million), by Deployment Mode 2025 & 2033
- Figure 29: Latin America Data Visualization Industry Revenue Share (%), by Deployment Mode 2025 & 2033
- Figure 30: Latin America Data Visualization Industry Revenue (Million), by End User 2025 & 2033
- Figure 31: Latin America Data Visualization Industry Revenue Share (%), by End User 2025 & 2033
- Figure 32: Latin America Data Visualization Industry Revenue (Million), by Country 2025 & 2033
- Figure 33: Latin America Data Visualization Industry Revenue Share (%), by Country 2025 & 2033
- Figure 34: Middle East and Africa Data Visualization Industry Revenue (Million), by Organizational Department 2025 & 2033
- Figure 35: Middle East and Africa Data Visualization Industry Revenue Share (%), by Organizational Department 2025 & 2033
- Figure 36: Middle East and Africa Data Visualization Industry Revenue (Million), by Deployment Mode 2025 & 2033
- Figure 37: Middle East and Africa Data Visualization Industry Revenue Share (%), by Deployment Mode 2025 & 2033
- Figure 38: Middle East and Africa Data Visualization Industry Revenue (Million), by End User 2025 & 2033
- Figure 39: Middle East and Africa Data Visualization Industry Revenue Share (%), by End User 2025 & 2033
- Figure 40: Middle East and Africa Data Visualization Industry Revenue (Million), by Country 2025 & 2033
- Figure 41: Middle East and Africa Data Visualization Industry Revenue Share (%), by Country 2025 & 2033
List of Tables
- Table 1: Global Data Visualization Industry Revenue Million Forecast, by Organizational Department 2020 & 2033
- Table 2: Global Data Visualization Industry Revenue Million Forecast, by Deployment Mode 2020 & 2033
- Table 3: Global Data Visualization Industry Revenue Million Forecast, by End User 2020 & 2033
- Table 4: Global Data Visualization Industry Revenue Million Forecast, by Region 2020 & 2033
- Table 5: Global Data Visualization Industry Revenue Million Forecast, by Organizational Department 2020 & 2033
- Table 6: Global Data Visualization Industry Revenue Million Forecast, by Deployment Mode 2020 & 2033
- Table 7: Global Data Visualization Industry Revenue Million Forecast, by End User 2020 & 2033
- Table 8: Global Data Visualization Industry Revenue Million Forecast, by Country 2020 & 2033
- Table 9: Global Data Visualization Industry Revenue Million Forecast, by Organizational Department 2020 & 2033
- Table 10: Global Data Visualization Industry Revenue Million Forecast, by Deployment Mode 2020 & 2033
- Table 11: Global Data Visualization Industry Revenue Million Forecast, by End User 2020 & 2033
- Table 12: Global Data Visualization Industry Revenue Million Forecast, by Country 2020 & 2033
- Table 13: Global Data Visualization Industry Revenue Million Forecast, by Organizational Department 2020 & 2033
- Table 14: Global Data Visualization Industry Revenue Million Forecast, by Deployment Mode 2020 & 2033
- Table 15: Global Data Visualization Industry Revenue Million Forecast, by End User 2020 & 2033
- Table 16: Global Data Visualization Industry Revenue Million Forecast, by Country 2020 & 2033
- Table 17: Global Data Visualization Industry Revenue Million Forecast, by Organizational Department 2020 & 2033
- Table 18: Global Data Visualization Industry Revenue Million Forecast, by Deployment Mode 2020 & 2033
- Table 19: Global Data Visualization Industry Revenue Million Forecast, by End User 2020 & 2033
- Table 20: Global Data Visualization Industry Revenue Million Forecast, by Country 2020 & 2033
- Table 21: Global Data Visualization Industry Revenue Million Forecast, by Organizational Department 2020 & 2033
- Table 22: Global Data Visualization Industry Revenue Million Forecast, by Deployment Mode 2020 & 2033
- Table 23: Global Data Visualization Industry Revenue Million Forecast, by End User 2020 & 2033
- Table 24: Global Data Visualization Industry Revenue Million Forecast, by Country 2020 & 2033
Frequently Asked Questions
1. What is the projected Compound Annual Growth Rate (CAGR) of the Data Visualization Industry?
The projected CAGR is approximately 10.95%.
2. Which companies are prominent players in the Data Visualization Industry?
Key companies in the market include SAS Institute Inc, InetSoft Technology Corporation, TIBCO Software Inc, IBM Corporation, Microsoft Corporation, Pentaho Corporation, Dundas Data Visualization Inc, Information Builders, Oracle Corporation, Salesforce com Inc (Tableau Software Inc ), SAP SE, MicroStrategy Inc *List Not Exhaustive.
3. What are the main segments of the Data Visualization Industry?
The market segments include Organizational Department, Deployment Mode, End User.
4. Can you provide details about the market size?
The market size is estimated to be USD 9.84 Million as of 2022.
5. What are some drivers contributing to market growth?
Cloud Deployment of Data Visualization Solutions; Increasing Need for Quick Decision Making.
6. What are the notable trends driving market growth?
Retail Segment to Witness Significant Growth.
7. Are there any restraints impacting market growth?
Lack of Tech Savvy and Skilled Workforce/Inability.
8. Can you provide examples of recent developments in the market?
September 2022: KPI 360, an AI-driven solution that uses real-time data monitoring and prediction to assist manufacturing organizations in seeing various operational data sources through a single, comprehensive industrial intelligence dashboard that sets up in hours, was recently unveiled by SymphonyAI Industrial.
9. What pricing options are available for accessing the report?
Pricing options include single-user, multi-user, and enterprise licenses priced at USD 4750, USD 5250, and USD 8750 respectively.
10. Is the market size provided in terms of value or volume?
The market size is provided in terms of value, measured in Million.
11. Are there any specific market keywords associated with the report?
Yes, the market keyword associated with the report is "Data Visualization Industry," which aids in identifying and referencing the specific market segment covered.
12. How do I determine which pricing option suits my needs best?
The pricing options vary based on user requirements and access needs. Individual users may opt for single-user licenses, while businesses requiring broader access may choose multi-user or enterprise licenses for cost-effective access to the report.
13. Are there any additional resources or data provided in the Data Visualization Industry report?
While the report offers comprehensive insights, it's advisable to review the specific contents or supplementary materials provided to ascertain if additional resources or data are available.
14. How can I stay updated on further developments or reports in the Data Visualization Industry?
To stay informed about further developments, trends, and reports in the Data Visualization Industry, consider subscribing to industry newsletters, following relevant companies and organizations, or regularly checking reputable industry news sources and publications.
Methodology
Step 1 - Identification of Relevant Samples Size from Population Database


Step 2 - Approaches for Defining Global Market Size (Value, Volume* & Price*)

Note*: In applicable scenarios
Step 3 - Data Sources
Primary Research
- Web Analytics
- Survey Reports
- Research Institute
- Latest Research Reports
- Opinion Leaders
Secondary Research
- Annual Reports
- White Paper
- Latest Press Release
- Industry Association
- Paid Database
- Investor Presentations

Step 4 - Data Triangulation
Involves using different sources of information in order to increase the validity of a study
These sources are likely to be stakeholders in a program - participants, other researchers, program staff, other community members, and so on.
Then we put all data in single framework & apply various statistical tools to find out the dynamic on the market.
During the analysis stage, feedback from the stakeholder groups would be compared to determine areas of agreement as well as areas of divergence