

Key Insights
The US transformer market, projected to reach $70.9 billion by 2025, is set for substantial expansion. This growth is driven by escalating electricity demand from industrial development and urbanization. A projected Compound Annual Growth Rate (CAGR) of 9.95% from 2025 to 2033 underscores this significant market evolution. Key catalysts include the modernization of aging power grids, increased integration of renewable energy sources requiring efficient power conversion, and the widespread adoption of smart grid technologies. The market is segmented by cooling type (air-cooled, oil-cooled), transformer type (power, distribution), and power rating (small, medium, large). Air-cooled transformers currently lead due to their cost efficiency, while oil-cooled transformers remain crucial for high-power demands. Distribution transformers hold a larger share due to their broad application across diverse sectors. The large power rating segment is anticipated to exhibit robust growth, fueled by major industrial projects and power generation facilities. Leading industry players, including ABB, Toshiba, Hitachi, Emerson Electric, Mitsubishi Electric, Siemens, Schneider Electric, Eaton, GE, and Panasonic, are actively innovating and expanding their market presence, fostering a competitive and dynamic landscape.
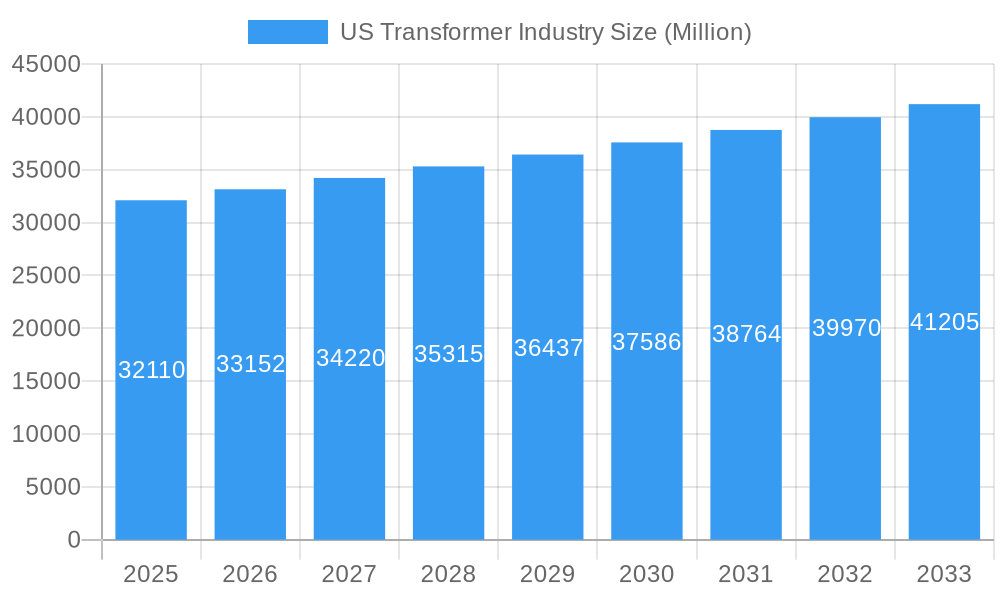
US Transformer Industry Market Size (In Billion)
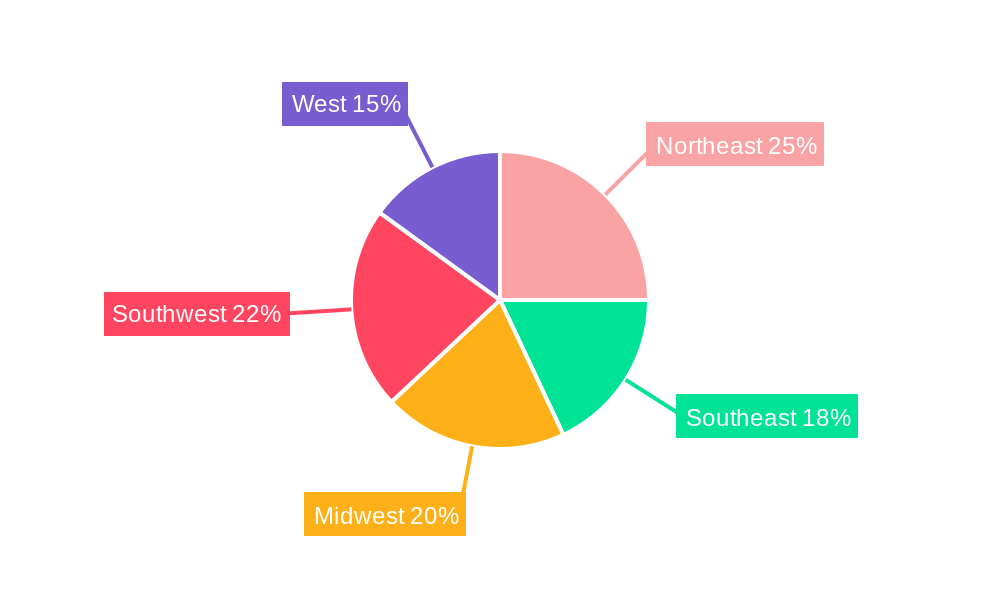
Regional market dynamics within the US show varied growth potentials. The Northeast, Southwest, and West regions are expected to lead in growth, influenced by differing levels of industrial activity and infrastructure investment. Nevertheless, all regions are contributing to overall market expansion through continuous infrastructure development and sustained energy requirements. Market growth may be tempered by fluctuating raw material costs, stringent environmental regulations, and potential supply chain vulnerabilities. However, continuous technological advancements, such as the development of more efficient and sustainable transformer designs, are actively addressing these challenges. The growing adoption of digital grid management solutions and the increasing deployment of energy storage systems further accelerate the market's upward trajectory.
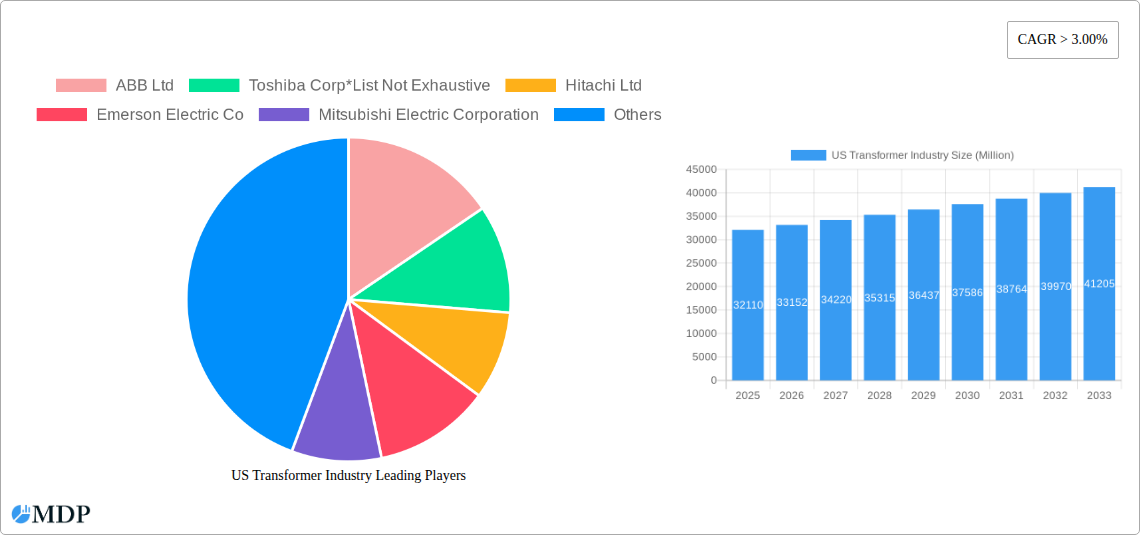
US Transformer Industry Company Market Share
US Transformer Industry Market Report: 2019-2033
Dive deep into the dynamic US transformer market with this comprehensive report, providing actionable insights for stakeholders across the value chain. This in-depth analysis covers the period 2019-2033, with a focus on the key trends, challenges, and opportunities shaping this crucial sector. The report leverages extensive market research and data analysis to provide a clear picture of the current state and future trajectory of the US transformer industry. Discover key market drivers, competitive landscapes, and strategic growth opportunities, enabling informed decision-making and strategic planning.
US Transformer Industry Market Dynamics & Concentration
The US transformer industry, valued at xx Million in 2024, exhibits a moderately concentrated market structure. Key players, including ABB Ltd, Toshiba Corp, Hitachi Ltd, Emerson Electric Co, Mitsubishi Electric Corporation, Siemens AG, Schneider Electric SE, Eaton Corporation PLC, General Electric Company, and Panasonic Corporation (list not exhaustive), compete intensely, driving innovation and efficiency improvements. Market share is largely driven by established players with deep technological expertise and extensive distribution networks, however, emerging companies are gradually gaining traction with specialized offerings. The industry is characterized by continuous innovation, particularly in areas such as energy efficiency, smart grid technologies, and sustainable materials. Regulatory frameworks, including the recently proposed DOE energy-efficiency criteria, significantly impact the industry's trajectory, promoting the adoption of more efficient and environmentally friendly transformers. Product substitution is limited, as transformers are essential components in the power transmission and distribution infrastructure. However, technological advancements are pushing the industry towards higher efficiency and lower environmental impact, creating some level of substitutability. Mergers and acquisitions (M&A) activity is moderate, primarily driven by larger players seeking to expand their market reach and product portfolio.
- Market Concentration: High, with top 10 players holding approximately xx% market share in 2024.
- M&A Deal Count (2019-2024): xx deals.
- Innovation Drivers: Energy efficiency regulations, smart grid integration, renewable energy adoption.
- Regulatory Frameworks: DOE efficiency standards, grid modernization initiatives.
US Transformer Industry Industry Trends & Analysis
The US transformer industry is experiencing robust growth, driven by increasing electricity demand, grid modernization initiatives, and the expansion of renewable energy sources. The market is projected to register a CAGR of xx% during the forecast period (2025-2033), reaching a value of xx Million by 2033. Technological advancements, such as the integration of digital technologies and the use of advanced materials, are driving efficiency gains and improved performance. Consumer preferences are increasingly focused on energy-efficient and reliable transformers, pushing manufacturers to innovate and enhance their offerings. The competitive landscape is highly dynamic, characterized by intense competition among established players and the emergence of new entrants offering specialized solutions. Market penetration of advanced technologies like digital transformers remains relatively low (xx% in 2024), but significant growth is anticipated in the forecast period, fueled by ongoing grid modernization and smart grid initiatives.
Leading Markets & Segments in US Transformer Industry
The US transformer market is geographically diverse, with significant demand across various regions. However, certain segments are showing dominant trends.
- Dominant Region: The xx region demonstrates the highest demand due to factors such as robust industrial growth and expanding infrastructure development.
- Cooling Type: Oil-cooled transformers dominate the market due to their higher power handling capabilities. However, air-cooled transformers are witnessing increased adoption due to their environmental benefits and cost-effectiveness for certain applications. Market share: Oil-cooled (xx%), Air-cooled (xx%).
- Transformer Type: Power transformers represent the largest segment, driven by the demand for high-capacity transmission and sub-transmission applications. Market share: Power Transformers (xx%), Distribution Transformers (xx%).
- Power Rating: Medium-sized transformers exhibit the highest demand driven by their use in industrial and commercial applications. Market share: Small (xx%), Medium (xx%), Large (xx%).
Key Drivers:
- Robust infrastructure development: Government investments in grid modernization and expansion projects are significantly impacting the demand.
- Growth in renewable energy: The increasing integration of renewable energy sources (solar, wind) requires efficient and reliable transformers.
- Industrial expansion: The continuous expansion of various industries drives demand for transformers of different ratings.
- Favorable economic policies: Government support for energy efficiency initiatives and infrastructure development enhances market growth.
US Transformer Industry Product Developments
Recent product innovations focus on enhancing efficiency, reliability, and environmental sustainability. This includes advancements in cooling technologies, the use of advanced materials (like amorphous core), and the integration of smart sensors and digital controls. These innovations aim to improve grid stability and reduce transmission losses, aligning with the growing demand for environmentally friendly and cost-effective solutions. The competitive advantage lies in offering superior performance, reliability, and digital capabilities while adhering to strict environmental regulations.
Key Drivers of US Transformer Industry Growth
The US transformer market growth is fueled by a confluence of factors:
- Technological advancements: The development of more efficient and reliable transformers is driving market growth.
- Economic growth: Expansion in various sectors leads to increased demand for electricity and related infrastructure, including transformers.
- Regulatory support: Government initiatives aimed at modernizing the grid and improving energy efficiency are propelling market growth. For instance, the DOE's proposed energy efficiency standards for distribution transformers will boost demand for advanced, energy-efficient models.
Challenges in the US Transformer Industry Market
The US transformer industry faces several significant challenges:
- Supply chain disruptions: Global supply chain disruptions and material price volatility pose a threat to production and profitability.
- Stringent environmental regulations: Compliance with stringent environmental regulations increases manufacturing costs.
- Intense competition: The presence of numerous players, including both domestic and international companies, intensifies the competitive pressure. This competition exerts pressure on pricing and necessitates ongoing product innovation.
Emerging Opportunities in US Transformer Industry
Long-term growth is driven by several opportunities:
- Smart grid technologies: The integration of digital technologies and advanced sensors in transformers creates new growth opportunities.
- Renewable energy integration: The increasing penetration of renewable energy sources creates significant demand for advanced transformer technologies.
- Strategic partnerships: Collaboration among transformer manufacturers, grid operators, and technology providers offers opportunities for innovation and market expansion.
Leading Players in the US Transformer Industry Sector
Key Milestones in US Transformer Industry Industry
- December 2022: Hitachi Energy announced a USD 37 Million investment to expand its power transformer manufacturing facility in South Boston, Virginia, signaling strong demand for power transformers, particularly in renewable energy and data center applications.
- December 2022: The US Department of Energy (DOE) proposed new energy-efficiency criteria for distribution transformers, driving the adoption of more efficient and environmentally friendly technologies.
Strategic Outlook for US Transformer Industry Market
The US transformer industry is poised for continued growth, driven by ongoing grid modernization, renewable energy integration, and advancements in smart grid technologies. Strategic opportunities lie in developing and deploying highly efficient, reliable, and digitally enabled transformers that meet the evolving needs of the energy sector and adhere to strict environmental regulations. Focusing on innovation, strategic partnerships, and efficient supply chain management will be crucial for success in this competitive landscape.
US Transformer Industry Segmentation
- 1. Production Analysis
- 2. Consumption Analysis
- 3. Import Market Analysis (Value & Volume)
- 4. Export Market Analysis (Value & Volume)
- 5. Price Trend Analysis
US Transformer Industry Segmentation By Geography
-
1. North America
- 1.1. United States
- 1.2. Canada
- 1.3. Mexico
-
2. South America
- 2.1. Brazil
- 2.2. Argentina
- 2.3. Rest of South America
-
3. Europe
- 3.1. United Kingdom
- 3.2. Germany
- 3.3. France
- 3.4. Italy
- 3.5. Spain
- 3.6. Russia
- 3.7. Benelux
- 3.8. Nordics
- 3.9. Rest of Europe
-
4. Middle East & Africa
- 4.1. Turkey
- 4.2. Israel
- 4.3. GCC
- 4.4. North Africa
- 4.5. South Africa
- 4.6. Rest of Middle East & Africa
-
5. Asia Pacific
- 5.1. China
- 5.2. India
- 5.3. Japan
- 5.4. South Korea
- 5.5. ASEAN
- 5.6. Oceania
- 5.7. Rest of Asia Pacific
US Transformer Industry Regional Market Share
Geographic Coverage of US Transformer Industry
US Transformer Industry REPORT HIGHLIGHTS
| Aspects | Details |
|---|---|
| Study Period | 2020-2034 |
| Base Year | 2025 |
| Estimated Year | 2026 |
| Forecast Period | 2026-2034 |
| Historical Period | 2020-2025 |
| Growth Rate | CAGR of 9.95% from 2020-2034 |
| Segmentation |
|
Table of Contents
- 1. Introduction
- 1.1. Research Scope
- 1.2. Market Segmentation
- 1.3. Research Methodology
- 1.4. Definitions and Assumptions
- 2. Executive Summary
- 2.1. Introduction
- 3. Market Dynamics
- 3.1. Introduction
- 3.2. Market Drivers
- 3.2.1. 4.; Increasing Natural Gas Demand4.; Rising Pipeline Network and Associated Infrastructure Development
- 3.3. Market Restrains
- 3.3.1. 4.; Rising Shift toward Renewable Energy
- 3.4. Market Trends
- 3.4.1. Distribution Transformer Expected to Dominate the Market
- 4. Market Factor Analysis
- 4.1. Porters Five Forces
- 4.2. Supply/Value Chain
- 4.3. PESTEL analysis
- 4.4. Market Entropy
- 4.5. Patent/Trademark Analysis
- 5. Global US Transformer Industry Analysis, Insights and Forecast, 2020-2032
- 5.1. Market Analysis, Insights and Forecast - by Production Analysis
- 5.2. Market Analysis, Insights and Forecast - by Consumption Analysis
- 5.3. Market Analysis, Insights and Forecast - by Import Market Analysis (Value & Volume)
- 5.4. Market Analysis, Insights and Forecast - by Export Market Analysis (Value & Volume)
- 5.5. Market Analysis, Insights and Forecast - by Price Trend Analysis
- 5.6. Market Analysis, Insights and Forecast - by Region
- 5.6.1. North America
- 5.6.2. South America
- 5.6.3. Europe
- 5.6.4. Middle East & Africa
- 5.6.5. Asia Pacific
- 5.1. Market Analysis, Insights and Forecast - by Production Analysis
- 6. North America US Transformer Industry Analysis, Insights and Forecast, 2020-2032
- 6.1. Market Analysis, Insights and Forecast - by Production Analysis
- 6.2. Market Analysis, Insights and Forecast - by Consumption Analysis
- 6.3. Market Analysis, Insights and Forecast - by Import Market Analysis (Value & Volume)
- 6.4. Market Analysis, Insights and Forecast - by Export Market Analysis (Value & Volume)
- 6.5. Market Analysis, Insights and Forecast - by Price Trend Analysis
- 6.1. Market Analysis, Insights and Forecast - by Production Analysis
- 7. South America US Transformer Industry Analysis, Insights and Forecast, 2020-2032
- 7.1. Market Analysis, Insights and Forecast - by Production Analysis
- 7.2. Market Analysis, Insights and Forecast - by Consumption Analysis
- 7.3. Market Analysis, Insights and Forecast - by Import Market Analysis (Value & Volume)
- 7.4. Market Analysis, Insights and Forecast - by Export Market Analysis (Value & Volume)
- 7.5. Market Analysis, Insights and Forecast - by Price Trend Analysis
- 7.1. Market Analysis, Insights and Forecast - by Production Analysis
- 8. Europe US Transformer Industry Analysis, Insights and Forecast, 2020-2032
- 8.1. Market Analysis, Insights and Forecast - by Production Analysis
- 8.2. Market Analysis, Insights and Forecast - by Consumption Analysis
- 8.3. Market Analysis, Insights and Forecast - by Import Market Analysis (Value & Volume)
- 8.4. Market Analysis, Insights and Forecast - by Export Market Analysis (Value & Volume)
- 8.5. Market Analysis, Insights and Forecast - by Price Trend Analysis
- 8.1. Market Analysis, Insights and Forecast - by Production Analysis
- 9. Middle East & Africa US Transformer Industry Analysis, Insights and Forecast, 2020-2032
- 9.1. Market Analysis, Insights and Forecast - by Production Analysis
- 9.2. Market Analysis, Insights and Forecast - by Consumption Analysis
- 9.3. Market Analysis, Insights and Forecast - by Import Market Analysis (Value & Volume)
- 9.4. Market Analysis, Insights and Forecast - by Export Market Analysis (Value & Volume)
- 9.5. Market Analysis, Insights and Forecast - by Price Trend Analysis
- 9.1. Market Analysis, Insights and Forecast - by Production Analysis
- 10. Asia Pacific US Transformer Industry Analysis, Insights and Forecast, 2020-2032
- 10.1. Market Analysis, Insights and Forecast - by Production Analysis
- 10.2. Market Analysis, Insights and Forecast - by Consumption Analysis
- 10.3. Market Analysis, Insights and Forecast - by Import Market Analysis (Value & Volume)
- 10.4. Market Analysis, Insights and Forecast - by Export Market Analysis (Value & Volume)
- 10.5. Market Analysis, Insights and Forecast - by Price Trend Analysis
- 10.1. Market Analysis, Insights and Forecast - by Production Analysis
- 11. Competitive Analysis
- 11.1. Global Market Share Analysis 2025
- 11.2. Company Profiles
- 11.2.1 ABB Ltd
- 11.2.1.1. Overview
- 11.2.1.2. Products
- 11.2.1.3. SWOT Analysis
- 11.2.1.4. Recent Developments
- 11.2.1.5. Financials (Based on Availability)
- 11.2.2 Toshiba Corp*List Not Exhaustive
- 11.2.2.1. Overview
- 11.2.2.2. Products
- 11.2.2.3. SWOT Analysis
- 11.2.2.4. Recent Developments
- 11.2.2.5. Financials (Based on Availability)
- 11.2.3 Hitachi Ltd
- 11.2.3.1. Overview
- 11.2.3.2. Products
- 11.2.3.3. SWOT Analysis
- 11.2.3.4. Recent Developments
- 11.2.3.5. Financials (Based on Availability)
- 11.2.4 Emerson Electric Co
- 11.2.4.1. Overview
- 11.2.4.2. Products
- 11.2.4.3. SWOT Analysis
- 11.2.4.4. Recent Developments
- 11.2.4.5. Financials (Based on Availability)
- 11.2.5 Mitsubishi Electric Corporation
- 11.2.5.1. Overview
- 11.2.5.2. Products
- 11.2.5.3. SWOT Analysis
- 11.2.5.4. Recent Developments
- 11.2.5.5. Financials (Based on Availability)
- 11.2.6 Siemens AG
- 11.2.6.1. Overview
- 11.2.6.2. Products
- 11.2.6.3. SWOT Analysis
- 11.2.6.4. Recent Developments
- 11.2.6.5. Financials (Based on Availability)
- 11.2.7 Schneider Electric SE
- 11.2.7.1. Overview
- 11.2.7.2. Products
- 11.2.7.3. SWOT Analysis
- 11.2.7.4. Recent Developments
- 11.2.7.5. Financials (Based on Availability)
- 11.2.8 Eaton Corporation PLC
- 11.2.8.1. Overview
- 11.2.8.2. Products
- 11.2.8.3. SWOT Analysis
- 11.2.8.4. Recent Developments
- 11.2.8.5. Financials (Based on Availability)
- 11.2.9 General Electric Company
- 11.2.9.1. Overview
- 11.2.9.2. Products
- 11.2.9.3. SWOT Analysis
- 11.2.9.4. Recent Developments
- 11.2.9.5. Financials (Based on Availability)
- 11.2.10 Panasonic Corporation
- 11.2.10.1. Overview
- 11.2.10.2. Products
- 11.2.10.3. SWOT Analysis
- 11.2.10.4. Recent Developments
- 11.2.10.5. Financials (Based on Availability)
- 11.2.1 ABB Ltd
List of Figures
- Figure 1: Global US Transformer Industry Revenue Breakdown (billion, %) by Region 2025 & 2033
- Figure 2: North America US Transformer Industry Revenue (billion), by Production Analysis 2025 & 2033
- Figure 3: North America US Transformer Industry Revenue Share (%), by Production Analysis 2025 & 2033
- Figure 4: North America US Transformer Industry Revenue (billion), by Consumption Analysis 2025 & 2033
- Figure 5: North America US Transformer Industry Revenue Share (%), by Consumption Analysis 2025 & 2033
- Figure 6: North America US Transformer Industry Revenue (billion), by Import Market Analysis (Value & Volume) 2025 & 2033
- Figure 7: North America US Transformer Industry Revenue Share (%), by Import Market Analysis (Value & Volume) 2025 & 2033
- Figure 8: North America US Transformer Industry Revenue (billion), by Export Market Analysis (Value & Volume) 2025 & 2033
- Figure 9: North America US Transformer Industry Revenue Share (%), by Export Market Analysis (Value & Volume) 2025 & 2033
- Figure 10: North America US Transformer Industry Revenue (billion), by Price Trend Analysis 2025 & 2033
- Figure 11: North America US Transformer Industry Revenue Share (%), by Price Trend Analysis 2025 & 2033
- Figure 12: North America US Transformer Industry Revenue (billion), by Country 2025 & 2033
- Figure 13: North America US Transformer Industry Revenue Share (%), by Country 2025 & 2033
- Figure 14: South America US Transformer Industry Revenue (billion), by Production Analysis 2025 & 2033
- Figure 15: South America US Transformer Industry Revenue Share (%), by Production Analysis 2025 & 2033
- Figure 16: South America US Transformer Industry Revenue (billion), by Consumption Analysis 2025 & 2033
- Figure 17: South America US Transformer Industry Revenue Share (%), by Consumption Analysis 2025 & 2033
- Figure 18: South America US Transformer Industry Revenue (billion), by Import Market Analysis (Value & Volume) 2025 & 2033
- Figure 19: South America US Transformer Industry Revenue Share (%), by Import Market Analysis (Value & Volume) 2025 & 2033
- Figure 20: South America US Transformer Industry Revenue (billion), by Export Market Analysis (Value & Volume) 2025 & 2033
- Figure 21: South America US Transformer Industry Revenue Share (%), by Export Market Analysis (Value & Volume) 2025 & 2033
- Figure 22: South America US Transformer Industry Revenue (billion), by Price Trend Analysis 2025 & 2033
- Figure 23: South America US Transformer Industry Revenue Share (%), by Price Trend Analysis 2025 & 2033
- Figure 24: South America US Transformer Industry Revenue (billion), by Country 2025 & 2033
- Figure 25: South America US Transformer Industry Revenue Share (%), by Country 2025 & 2033
- Figure 26: Europe US Transformer Industry Revenue (billion), by Production Analysis 2025 & 2033
- Figure 27: Europe US Transformer Industry Revenue Share (%), by Production Analysis 2025 & 2033
- Figure 28: Europe US Transformer Industry Revenue (billion), by Consumption Analysis 2025 & 2033
- Figure 29: Europe US Transformer Industry Revenue Share (%), by Consumption Analysis 2025 & 2033
- Figure 30: Europe US Transformer Industry Revenue (billion), by Import Market Analysis (Value & Volume) 2025 & 2033
- Figure 31: Europe US Transformer Industry Revenue Share (%), by Import Market Analysis (Value & Volume) 2025 & 2033
- Figure 32: Europe US Transformer Industry Revenue (billion), by Export Market Analysis (Value & Volume) 2025 & 2033
- Figure 33: Europe US Transformer Industry Revenue Share (%), by Export Market Analysis (Value & Volume) 2025 & 2033
- Figure 34: Europe US Transformer Industry Revenue (billion), by Price Trend Analysis 2025 & 2033
- Figure 35: Europe US Transformer Industry Revenue Share (%), by Price Trend Analysis 2025 & 2033
- Figure 36: Europe US Transformer Industry Revenue (billion), by Country 2025 & 2033
- Figure 37: Europe US Transformer Industry Revenue Share (%), by Country 2025 & 2033
- Figure 38: Middle East & Africa US Transformer Industry Revenue (billion), by Production Analysis 2025 & 2033
- Figure 39: Middle East & Africa US Transformer Industry Revenue Share (%), by Production Analysis 2025 & 2033
- Figure 40: Middle East & Africa US Transformer Industry Revenue (billion), by Consumption Analysis 2025 & 2033
- Figure 41: Middle East & Africa US Transformer Industry Revenue Share (%), by Consumption Analysis 2025 & 2033
- Figure 42: Middle East & Africa US Transformer Industry Revenue (billion), by Import Market Analysis (Value & Volume) 2025 & 2033
- Figure 43: Middle East & Africa US Transformer Industry Revenue Share (%), by Import Market Analysis (Value & Volume) 2025 & 2033
- Figure 44: Middle East & Africa US Transformer Industry Revenue (billion), by Export Market Analysis (Value & Volume) 2025 & 2033
- Figure 45: Middle East & Africa US Transformer Industry Revenue Share (%), by Export Market Analysis (Value & Volume) 2025 & 2033
- Figure 46: Middle East & Africa US Transformer Industry Revenue (billion), by Price Trend Analysis 2025 & 2033
- Figure 47: Middle East & Africa US Transformer Industry Revenue Share (%), by Price Trend Analysis 2025 & 2033
- Figure 48: Middle East & Africa US Transformer Industry Revenue (billion), by Country 2025 & 2033
- Figure 49: Middle East & Africa US Transformer Industry Revenue Share (%), by Country 2025 & 2033
- Figure 50: Asia Pacific US Transformer Industry Revenue (billion), by Production Analysis 2025 & 2033
- Figure 51: Asia Pacific US Transformer Industry Revenue Share (%), by Production Analysis 2025 & 2033
- Figure 52: Asia Pacific US Transformer Industry Revenue (billion), by Consumption Analysis 2025 & 2033
- Figure 53: Asia Pacific US Transformer Industry Revenue Share (%), by Consumption Analysis 2025 & 2033
- Figure 54: Asia Pacific US Transformer Industry Revenue (billion), by Import Market Analysis (Value & Volume) 2025 & 2033
- Figure 55: Asia Pacific US Transformer Industry Revenue Share (%), by Import Market Analysis (Value & Volume) 2025 & 2033
- Figure 56: Asia Pacific US Transformer Industry Revenue (billion), by Export Market Analysis (Value & Volume) 2025 & 2033
- Figure 57: Asia Pacific US Transformer Industry Revenue Share (%), by Export Market Analysis (Value & Volume) 2025 & 2033
- Figure 58: Asia Pacific US Transformer Industry Revenue (billion), by Price Trend Analysis 2025 & 2033
- Figure 59: Asia Pacific US Transformer Industry Revenue Share (%), by Price Trend Analysis 2025 & 2033
- Figure 60: Asia Pacific US Transformer Industry Revenue (billion), by Country 2025 & 2033
- Figure 61: Asia Pacific US Transformer Industry Revenue Share (%), by Country 2025 & 2033
List of Tables
- Table 1: Global US Transformer Industry Revenue billion Forecast, by Production Analysis 2020 & 2033
- Table 2: Global US Transformer Industry Revenue billion Forecast, by Consumption Analysis 2020 & 2033
- Table 3: Global US Transformer Industry Revenue billion Forecast, by Import Market Analysis (Value & Volume) 2020 & 2033
- Table 4: Global US Transformer Industry Revenue billion Forecast, by Export Market Analysis (Value & Volume) 2020 & 2033
- Table 5: Global US Transformer Industry Revenue billion Forecast, by Price Trend Analysis 2020 & 2033
- Table 6: Global US Transformer Industry Revenue billion Forecast, by Region 2020 & 2033
- Table 7: Global US Transformer Industry Revenue billion Forecast, by Production Analysis 2020 & 2033
- Table 8: Global US Transformer Industry Revenue billion Forecast, by Consumption Analysis 2020 & 2033
- Table 9: Global US Transformer Industry Revenue billion Forecast, by Import Market Analysis (Value & Volume) 2020 & 2033
- Table 10: Global US Transformer Industry Revenue billion Forecast, by Export Market Analysis (Value & Volume) 2020 & 2033
- Table 11: Global US Transformer Industry Revenue billion Forecast, by Price Trend Analysis 2020 & 2033
- Table 12: Global US Transformer Industry Revenue billion Forecast, by Country 2020 & 2033
- Table 13: United States US Transformer Industry Revenue (billion) Forecast, by Application 2020 & 2033
- Table 14: Canada US Transformer Industry Revenue (billion) Forecast, by Application 2020 & 2033
- Table 15: Mexico US Transformer Industry Revenue (billion) Forecast, by Application 2020 & 2033
- Table 16: Global US Transformer Industry Revenue billion Forecast, by Production Analysis 2020 & 2033
- Table 17: Global US Transformer Industry Revenue billion Forecast, by Consumption Analysis 2020 & 2033
- Table 18: Global US Transformer Industry Revenue billion Forecast, by Import Market Analysis (Value & Volume) 2020 & 2033
- Table 19: Global US Transformer Industry Revenue billion Forecast, by Export Market Analysis (Value & Volume) 2020 & 2033
- Table 20: Global US Transformer Industry Revenue billion Forecast, by Price Trend Analysis 2020 & 2033
- Table 21: Global US Transformer Industry Revenue billion Forecast, by Country 2020 & 2033
- Table 22: Brazil US Transformer Industry Revenue (billion) Forecast, by Application 2020 & 2033
- Table 23: Argentina US Transformer Industry Revenue (billion) Forecast, by Application 2020 & 2033
- Table 24: Rest of South America US Transformer Industry Revenue (billion) Forecast, by Application 2020 & 2033
- Table 25: Global US Transformer Industry Revenue billion Forecast, by Production Analysis 2020 & 2033
- Table 26: Global US Transformer Industry Revenue billion Forecast, by Consumption Analysis 2020 & 2033
- Table 27: Global US Transformer Industry Revenue billion Forecast, by Import Market Analysis (Value & Volume) 2020 & 2033
- Table 28: Global US Transformer Industry Revenue billion Forecast, by Export Market Analysis (Value & Volume) 2020 & 2033
- Table 29: Global US Transformer Industry Revenue billion Forecast, by Price Trend Analysis 2020 & 2033
- Table 30: Global US Transformer Industry Revenue billion Forecast, by Country 2020 & 2033
- Table 31: United Kingdom US Transformer Industry Revenue (billion) Forecast, by Application 2020 & 2033
- Table 32: Germany US Transformer Industry Revenue (billion) Forecast, by Application 2020 & 2033
- Table 33: France US Transformer Industry Revenue (billion) Forecast, by Application 2020 & 2033
- Table 34: Italy US Transformer Industry Revenue (billion) Forecast, by Application 2020 & 2033
- Table 35: Spain US Transformer Industry Revenue (billion) Forecast, by Application 2020 & 2033
- Table 36: Russia US Transformer Industry Revenue (billion) Forecast, by Application 2020 & 2033
- Table 37: Benelux US Transformer Industry Revenue (billion) Forecast, by Application 2020 & 2033
- Table 38: Nordics US Transformer Industry Revenue (billion) Forecast, by Application 2020 & 2033
- Table 39: Rest of Europe US Transformer Industry Revenue (billion) Forecast, by Application 2020 & 2033
- Table 40: Global US Transformer Industry Revenue billion Forecast, by Production Analysis 2020 & 2033
- Table 41: Global US Transformer Industry Revenue billion Forecast, by Consumption Analysis 2020 & 2033
- Table 42: Global US Transformer Industry Revenue billion Forecast, by Import Market Analysis (Value & Volume) 2020 & 2033
- Table 43: Global US Transformer Industry Revenue billion Forecast, by Export Market Analysis (Value & Volume) 2020 & 2033
- Table 44: Global US Transformer Industry Revenue billion Forecast, by Price Trend Analysis 2020 & 2033
- Table 45: Global US Transformer Industry Revenue billion Forecast, by Country 2020 & 2033
- Table 46: Turkey US Transformer Industry Revenue (billion) Forecast, by Application 2020 & 2033
- Table 47: Israel US Transformer Industry Revenue (billion) Forecast, by Application 2020 & 2033
- Table 48: GCC US Transformer Industry Revenue (billion) Forecast, by Application 2020 & 2033
- Table 49: North Africa US Transformer Industry Revenue (billion) Forecast, by Application 2020 & 2033
- Table 50: South Africa US Transformer Industry Revenue (billion) Forecast, by Application 2020 & 2033
- Table 51: Rest of Middle East & Africa US Transformer Industry Revenue (billion) Forecast, by Application 2020 & 2033
- Table 52: Global US Transformer Industry Revenue billion Forecast, by Production Analysis 2020 & 2033
- Table 53: Global US Transformer Industry Revenue billion Forecast, by Consumption Analysis 2020 & 2033
- Table 54: Global US Transformer Industry Revenue billion Forecast, by Import Market Analysis (Value & Volume) 2020 & 2033
- Table 55: Global US Transformer Industry Revenue billion Forecast, by Export Market Analysis (Value & Volume) 2020 & 2033
- Table 56: Global US Transformer Industry Revenue billion Forecast, by Price Trend Analysis 2020 & 2033
- Table 57: Global US Transformer Industry Revenue billion Forecast, by Country 2020 & 2033
- Table 58: China US Transformer Industry Revenue (billion) Forecast, by Application 2020 & 2033
- Table 59: India US Transformer Industry Revenue (billion) Forecast, by Application 2020 & 2033
- Table 60: Japan US Transformer Industry Revenue (billion) Forecast, by Application 2020 & 2033
- Table 61: South Korea US Transformer Industry Revenue (billion) Forecast, by Application 2020 & 2033
- Table 62: ASEAN US Transformer Industry Revenue (billion) Forecast, by Application 2020 & 2033
- Table 63: Oceania US Transformer Industry Revenue (billion) Forecast, by Application 2020 & 2033
- Table 64: Rest of Asia Pacific US Transformer Industry Revenue (billion) Forecast, by Application 2020 & 2033
Frequently Asked Questions
1. What is the projected Compound Annual Growth Rate (CAGR) of the US Transformer Industry?
The projected CAGR is approximately 9.95%.
2. Which companies are prominent players in the US Transformer Industry?
Key companies in the market include ABB Ltd, Toshiba Corp*List Not Exhaustive, Hitachi Ltd, Emerson Electric Co, Mitsubishi Electric Corporation, Siemens AG, Schneider Electric SE, Eaton Corporation PLC, General Electric Company, Panasonic Corporation.
3. What are the main segments of the US Transformer Industry?
The market segments include Production Analysis, Consumption Analysis, Import Market Analysis (Value & Volume), Export Market Analysis (Value & Volume), Price Trend Analysis.
4. Can you provide details about the market size?
The market size is estimated to be USD 70.9 billion as of 2022.
5. What are some drivers contributing to market growth?
4.; Increasing Natural Gas Demand4.; Rising Pipeline Network and Associated Infrastructure Development.
6. What are the notable trends driving market growth?
Distribution Transformer Expected to Dominate the Market.
7. Are there any restraints impacting market growth?
4.; Rising Shift toward Renewable Energy.
8. Can you provide examples of recent developments in the market?
December 2022: Hitachi Energy announced plans to invest more than USD 37 million in the expansion and modernization of its power transformer manufacturing facility in South Boston, Virginia, to meet rapidly growing demand from utility customers and for applications such as renewable energy generation and data centers.
9. What pricing options are available for accessing the report?
Pricing options include single-user, multi-user, and enterprise licenses priced at USD 3800, USD 4500, and USD 5800 respectively.
10. Is the market size provided in terms of value or volume?
The market size is provided in terms of value, measured in billion.
11. Are there any specific market keywords associated with the report?
Yes, the market keyword associated with the report is "US Transformer Industry," which aids in identifying and referencing the specific market segment covered.
12. How do I determine which pricing option suits my needs best?
The pricing options vary based on user requirements and access needs. Individual users may opt for single-user licenses, while businesses requiring broader access may choose multi-user or enterprise licenses for cost-effective access to the report.
13. Are there any additional resources or data provided in the US Transformer Industry report?
While the report offers comprehensive insights, it's advisable to review the specific contents or supplementary materials provided to ascertain if additional resources or data are available.
14. How can I stay updated on further developments or reports in the US Transformer Industry?
To stay informed about further developments, trends, and reports in the US Transformer Industry, consider subscribing to industry newsletters, following relevant companies and organizations, or regularly checking reputable industry news sources and publications.
Methodology
Step 1 - Identification of Relevant Samples Size from Population Database


Step 2 - Approaches for Defining Global Market Size (Value, Volume* & Price*)

Note*: In applicable scenarios
Step 3 - Data Sources
Primary Research
- Web Analytics
- Survey Reports
- Research Institute
- Latest Research Reports
- Opinion Leaders
Secondary Research
- Annual Reports
- White Paper
- Latest Press Release
- Industry Association
- Paid Database
- Investor Presentations

Step 4 - Data Triangulation
Involves using different sources of information in order to increase the validity of a study
These sources are likely to be stakeholders in a program - participants, other researchers, program staff, other community members, and so on.
Then we put all data in single framework & apply various statistical tools to find out the dynamic on the market.
During the analysis stage, feedback from the stakeholder groups would be compared to determine areas of agreement as well as areas of divergence