

Key Insights
The U.S. pharmaceutical caps and closures market is poised for steady expansion, driven by escalating pharmaceutical demand and stringent regulatory mandates. With a projected market size of $13.3 billion in 2025, the industry anticipates a Compound Annual Growth Rate (CAGR) of 4.6% through 2033. Key growth drivers include an aging demographic, increasing prevalence of chronic diseases, and the growing need for secure, tamper-evident, and child-resistant packaging solutions. Plastic closures lead the market owing to their affordability and adaptability, while a burgeoning demand for sustainable alternatives like bioplastics presents emerging opportunities. The pharmaceutical sector remains the primary consumer, closely followed by the food and beverage industries. Intense competition from established entities such as Aptar Group, Amcor, and Berry Global, alongside emerging specialized players, fosters a dynamic and innovative market environment.
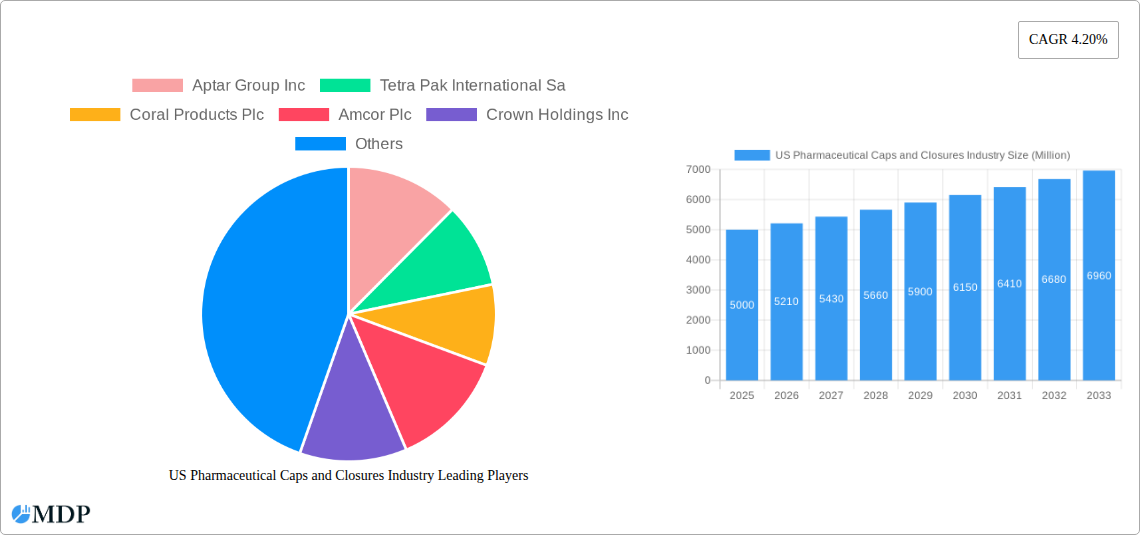
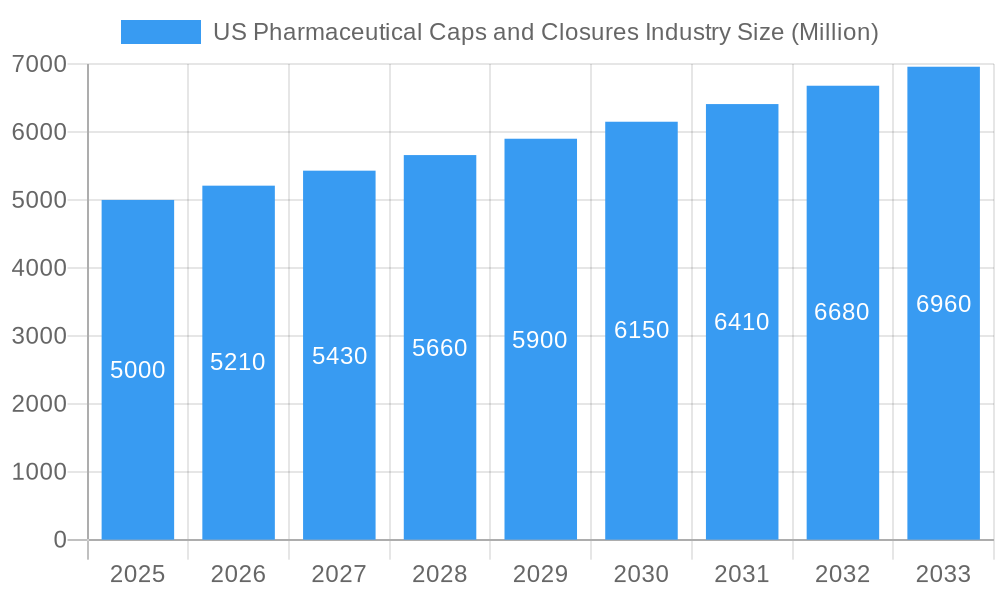
US Pharmaceutical Caps and Closures Industry Market Size (In Billion)
Geographically, market growth in the U.S. pharmaceutical caps and closures sector is evolving. While established pharmaceutical centers in the Northeast and West Coast currently dominate, the Southeast and Midwest regions are experiencing accelerated growth due to expanding manufacturing and distribution networks. Challenges such as volatile raw material costs and mounting environmental pressure necessitate a focus on sustainable material innovation, advanced closure designs, regulatory adherence, and cost-efficient production to meet global pharmaceutical needs responsibly. Companies are prioritizing the development of secure closures that ensure drug integrity, patient safety, and compliance with rigorous industry standards.
US Pharmaceutical Caps and Closures Industry Company Market Share
US Pharmaceutical Caps and Closures Industry: A Comprehensive Market Report (2019-2033)
This comprehensive report provides an in-depth analysis of the US Pharmaceutical Caps and Closures industry, offering valuable insights for stakeholders, investors, and industry professionals. With a meticulous study period spanning from 2019 to 2033 (Base Year: 2025, Estimated Year: 2025, Forecast Period: 2025-2033, Historical Period: 2019-2024), this report leverages rigorous data analysis to forecast future market trends and identify lucrative opportunities. The report covers key market segments, leading players, and emerging trends, providing actionable intelligence to navigate the dynamic landscape of this crucial sector. The market size is estimated to be xx Million in 2025 and is projected to reach xx Million by 2033.
US Pharmaceutical Caps and Closures Industry Market Dynamics & Concentration
The US pharmaceutical caps and closures market exhibits a moderately consolidated structure, with several major players commanding significant market share. Market concentration is influenced by factors such as economies of scale, technological advancements, and stringent regulatory compliance. Innovation in materials, designs, and functionalities plays a crucial role, driving competition and market growth. The regulatory landscape, particularly concerning safety and efficacy, significantly impacts market dynamics. Product substitutes, such as alternative packaging materials, present a constant challenge. End-user trends towards sustainable and eco-friendly packaging are reshaping the market. Mergers and acquisitions (M&A) activities have been relatively frequent, further consolidating the market and driving innovation. Over the past five years, there have been approximately xx M&A deals, with the average deal size being approximately xx Million. Key players like Amcor Plc and Berry Global Inc hold significant market shares, estimated at xx% and xx% respectively in 2025.
US Pharmaceutical Caps and Closures Industry Industry Trends & Analysis
The US pharmaceutical caps and closures market is experiencing robust growth, driven by several factors. The increasing demand for pharmaceutical products, coupled with the rising prevalence of chronic diseases, is a major catalyst. Technological advancements, such as the development of tamper-evident closures and child-resistant packaging, are enhancing product safety and boosting market demand. Consumer preferences for convenience and safety are also shaping market trends. Intense competition among manufacturers drives innovation and price optimization. The market's Compound Annual Growth Rate (CAGR) during the forecast period (2025-2033) is projected to be xx%. Market penetration of innovative closures, such as induction seals and desiccant caps, is expected to reach xx% by 2033. These innovations are driven by increased demand for extended shelf life and enhanced product integrity.
Leading Markets & Segments in US Pharmaceutical Caps and Closures Industry
The pharmaceutical and healthcare segment dominates the US pharmaceutical caps and closures market, accounting for approximately xx% of the total market value in 2025. This dominance stems from the stringent regulatory requirements for pharmaceutical packaging, the need for tamper-evident and child-resistant features, and the relatively high value of pharmaceutical products.
By Material Type: Plastic remains the dominant material, driven by its cost-effectiveness, versatility, and ease of processing. However, the market is witnessing a growing adoption of metal closures for certain applications requiring enhanced barrier properties and durability. Other materials such as composite materials are gaining traction, driven by sustainability concerns and the need for improved performance characteristics.
By End-User Industry:
- Pharmaceutical and Healthcare: Stringent regulations, increasing demand for specialized closures, and the high value of pharmaceuticals are key drivers for this segment's dominance.
- Food: This segment's growth is fueled by increased demand for convenience and extended shelf-life.
- Cosmetics and Toiletries: This segment’s growth is driven by a focus on aesthetics and consumer preference.
The strong growth in the pharmaceutical and healthcare segment is primarily driven by factors such as:
- Robust growth in the pharmaceutical industry
- Increasing prevalence of chronic diseases.
- Stringent regulatory requirements for drug safety and efficacy.
- Advancements in drug delivery systems.
US Pharmaceutical Caps and Closures Industry Product Developments
Recent product innovations focus on enhanced security features, improved barrier properties, and sustainable materials. Tamper-evident closures, child-resistant caps, and closures incorporating desiccant technology are gaining popularity. These advancements cater to the increasing demand for product safety, extended shelf life, and environmentally friendly packaging solutions. Competitive advantages are derived from superior material properties, innovative designs, cost-effectiveness, and strong intellectual property portfolios. The adoption of lightweight materials and improved recyclability further enhances the market appeal.
Key Drivers of US Pharmaceutical Caps and Closures Industry Growth
Several key factors contribute to the growth of the US pharmaceutical caps and closures industry. Technological advancements, such as the development of innovative closure designs and materials, are driving efficiency and product safety. Favorable economic conditions, including increasing disposable income and healthcare spending, fuel market demand. Stringent regulatory frameworks, mandating enhanced safety and security measures for pharmaceutical packaging, further drive growth by stimulating the adoption of advanced closures. Examples include the increasing demand for tamper-evident closures and child-resistant caps mandated by regulatory bodies.
Challenges in the US Pharmaceutical Caps and Closures Industry Market
The US pharmaceutical caps and closures industry faces several challenges. Stringent regulatory requirements and compliance costs can significantly impact profitability. Supply chain disruptions, exacerbated by geopolitical events and material shortages, pose a significant risk. Intense competition from both domestic and international players exerts pressure on pricing and margins. The impact of these challenges is estimated to reduce the market growth rate by approximately xx% annually.
Emerging Opportunities in US Pharmaceutical Caps and Closures Industry
Significant opportunities exist for growth in the US pharmaceutical caps and closures market. Technological breakthroughs, such as the development of biodegradable and compostable materials, are creating new market segments. Strategic partnerships between closure manufacturers and pharmaceutical companies can foster innovation and efficiency. Market expansion into emerging regions and the development of customized packaging solutions for specialized pharmaceutical products represent further growth opportunities.
Leading Players in the US Pharmaceutical Caps and Closures Industry Sector
- Aptar Group Inc
- Tetra Pak International Sa
- Coral Products Plc
- Amcor Plc
- Crown Holdings Inc
- O Berk Company Llc
- Bericap Holdings
- Silgan Closures
- MJS Packaging
- Albéa S A
- Berry Global Inc
- Closure Systems International
Key Milestones in US Pharmaceutical Caps and Closures Industry Industry
- 2020: Increased adoption of tamper-evident closures driven by regulatory changes.
- 2021: Several key players invest heavily in R&D for sustainable packaging solutions.
- 2022: Launch of new child-resistant caps with enhanced safety features.
- 2023: Significant M&A activity consolidates the market landscape.
- 2024: Growing adoption of smart packaging solutions with integrated sensors and traceability features.
Strategic Outlook for US Pharmaceutical Caps and Closures Industry Market
The US pharmaceutical caps and closures market presents a compelling long-term growth outlook. Continued innovation in materials and technologies, coupled with increasing demand for pharmaceutical products and stringent regulatory requirements, will drive market expansion. Strategic acquisitions and partnerships, particularly in the area of sustainable packaging solutions, will shape future market dynamics. The market is poised for robust growth, driven by these factors and a strong focus on enhancing product safety and consumer convenience.
US Pharmaceutical Caps and Closures Industry Segmentation
-
1. Material Type
-
1.1. Plastic
- 1.1.1. PET
- 1.1.2. PP
- 1.1.3. HDPE and LDPE
- 1.1.4. Other Plastics
- 1.2. Metal
- 1.3. Other Material Types
-
1.1. Plastic
-
2. End-User Industry
- 2.1. Beverage
- 2.2. Food
- 2.3. Pharmaceutical and Healthcare
- 2.4. Cosmetics and Toiletries
- 2.5. Other En
US Pharmaceutical Caps and Closures Industry Segmentation By Geography
-
1. North America
- 1.1. United States
- 1.2. Canada
- 1.3. Mexico
-
2. South America
- 2.1. Brazil
- 2.2. Argentina
- 2.3. Rest of South America
-
3. Europe
- 3.1. United Kingdom
- 3.2. Germany
- 3.3. France
- 3.4. Italy
- 3.5. Spain
- 3.6. Russia
- 3.7. Benelux
- 3.8. Nordics
- 3.9. Rest of Europe
-
4. Middle East & Africa
- 4.1. Turkey
- 4.2. Israel
- 4.3. GCC
- 4.4. North Africa
- 4.5. South Africa
- 4.6. Rest of Middle East & Africa
-
5. Asia Pacific
- 5.1. China
- 5.2. India
- 5.3. Japan
- 5.4. South Korea
- 5.5. ASEAN
- 5.6. Oceania
- 5.7. Rest of Asia Pacific
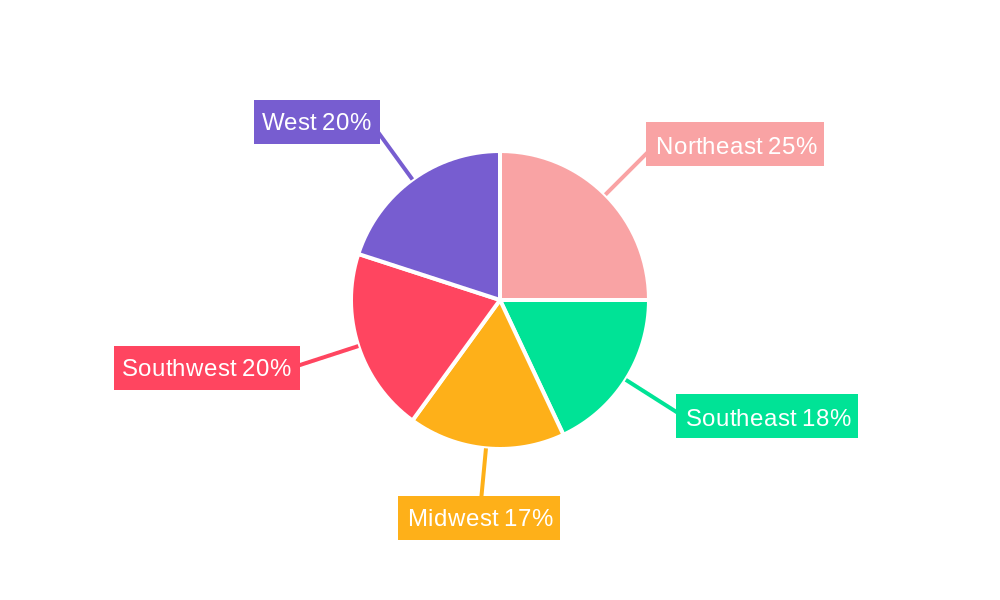
US Pharmaceutical Caps and Closures Industry Regional Market Share
Geographic Coverage of US Pharmaceutical Caps and Closures Industry
US Pharmaceutical Caps and Closures Industry REPORT HIGHLIGHTS
| Aspects | Details |
|---|---|
| Study Period | 2020-2034 |
| Base Year | 2025 |
| Estimated Year | 2026 |
| Forecast Period | 2026-2034 |
| Historical Period | 2020-2025 |
| Growth Rate | CAGR of 4.6% from 2020-2034 |
| Segmentation |
|
Table of Contents
- 1. Introduction
- 1.1. Research Scope
- 1.2. Market Segmentation
- 1.3. Research Objective
- 1.4. Definitions and Assumptions
- 2. Executive Summary
- 2.1. Market Snapshot
- 3. Market Dynamics
- 3.1. Market Drivers
- 3.2. Market Restrains
- 3.3. Market Trends
- 3.4. Market Opportunities
- 4. Market Factor Analysis
- 4.1. Porters Five Forces
- 4.1.1. Bargaining Power of Suppliers
- 4.1.2. Bargaining Power of Buyers
- 4.1.3. Threat of New Entrants
- 4.1.4. Threat of Substitutes
- 4.1.5. Competitive Rivalry
- 4.2. PESTEL analysis
- 4.3. BCG Analysis
- 4.3.1. Stars (High Growth, High Market Share)
- 4.3.2. Cash Cows (Low Growth, High Market Share)
- 4.3.3. Question Mark (High Growth, Low Market Share)
- 4.3.4. Dogs (Low Growth, Low Market Share)
- 4.4. Ansoff Matrix Analysis
- 4.5. Supply Chain Analysis
- 4.6. Regulatory Landscape
- 4.7. Current Market Potential and Opportunity Assessment (TAM–SAM–SOM Framework)
- 4.8. MDP Analyst Note
- 4.1. Porters Five Forces
- 5. Market Analysis, Insights and Forecast 2021-2033
- 5.1. Market Analysis, Insights and Forecast - by Material Type
- 5.1.1. Plastic
- 5.1.1.1. PET
- 5.1.1.2. PP
- 5.1.1.3. HDPE and LDPE
- 5.1.1.4. Other Plastics
- 5.1.2. Metal
- 5.1.3. Other Material Types
- 5.1.1. Plastic
- 5.2. Market Analysis, Insights and Forecast - by End-User Industry
- 5.2.1. Beverage
- 5.2.2. Food
- 5.2.3. Pharmaceutical and Healthcare
- 5.2.4. Cosmetics and Toiletries
- 5.2.5. Other En
- 5.3. Market Analysis, Insights and Forecast - by Region
- 5.3.1. North America
- 5.3.2. South America
- 5.3.3. Europe
- 5.3.4. Middle East & Africa
- 5.3.5. Asia Pacific
- 5.1. Market Analysis, Insights and Forecast - by Material Type
- 6. Global US Pharmaceutical Caps and Closures Industry Analysis, Insights and Forecast, 2021-2033
- 6.1. Market Analysis, Insights and Forecast - by Material Type
- 6.1.1. Plastic
- 6.1.1.1. PET
- 6.1.1.2. PP
- 6.1.1.3. HDPE and LDPE
- 6.1.1.4. Other Plastics
- 6.1.2. Metal
- 6.1.3. Other Material Types
- 6.1.1. Plastic
- 6.2. Market Analysis, Insights and Forecast - by End-User Industry
- 6.2.1. Beverage
- 6.2.2. Food
- 6.2.3. Pharmaceutical and Healthcare
- 6.2.4. Cosmetics and Toiletries
- 6.2.5. Other En
- 6.1. Market Analysis, Insights and Forecast - by Material Type
- 7. North America US Pharmaceutical Caps and Closures Industry Analysis, Insights and Forecast, 2020-2032
- 7.1. Market Analysis, Insights and Forecast - by Material Type
- 7.1.1. Plastic
- 7.1.1.1. PET
- 7.1.1.2. PP
- 7.1.1.3. HDPE and LDPE
- 7.1.1.4. Other Plastics
- 7.1.2. Metal
- 7.1.3. Other Material Types
- 7.1.1. Plastic
- 7.2. Market Analysis, Insights and Forecast - by End-User Industry
- 7.2.1. Beverage
- 7.2.2. Food
- 7.2.3. Pharmaceutical and Healthcare
- 7.2.4. Cosmetics and Toiletries
- 7.2.5. Other En
- 7.1. Market Analysis, Insights and Forecast - by Material Type
- 8. South America US Pharmaceutical Caps and Closures Industry Analysis, Insights and Forecast, 2020-2032
- 8.1. Market Analysis, Insights and Forecast - by Material Type
- 8.1.1. Plastic
- 8.1.1.1. PET
- 8.1.1.2. PP
- 8.1.1.3. HDPE and LDPE
- 8.1.1.4. Other Plastics
- 8.1.2. Metal
- 8.1.3. Other Material Types
- 8.1.1. Plastic
- 8.2. Market Analysis, Insights and Forecast - by End-User Industry
- 8.2.1. Beverage
- 8.2.2. Food
- 8.2.3. Pharmaceutical and Healthcare
- 8.2.4. Cosmetics and Toiletries
- 8.2.5. Other En
- 8.1. Market Analysis, Insights and Forecast - by Material Type
- 9. Europe US Pharmaceutical Caps and Closures Industry Analysis, Insights and Forecast, 2020-2032
- 9.1. Market Analysis, Insights and Forecast - by Material Type
- 9.1.1. Plastic
- 9.1.1.1. PET
- 9.1.1.2. PP
- 9.1.1.3. HDPE and LDPE
- 9.1.1.4. Other Plastics
- 9.1.2. Metal
- 9.1.3. Other Material Types
- 9.1.1. Plastic
- 9.2. Market Analysis, Insights and Forecast - by End-User Industry
- 9.2.1. Beverage
- 9.2.2. Food
- 9.2.3. Pharmaceutical and Healthcare
- 9.2.4. Cosmetics and Toiletries
- 9.2.5. Other En
- 9.1. Market Analysis, Insights and Forecast - by Material Type
- 10. Middle East & Africa US Pharmaceutical Caps and Closures Industry Analysis, Insights and Forecast, 2020-2032
- 10.1. Market Analysis, Insights and Forecast - by Material Type
- 10.1.1. Plastic
- 10.1.1.1. PET
- 10.1.1.2. PP
- 10.1.1.3. HDPE and LDPE
- 10.1.1.4. Other Plastics
- 10.1.2. Metal
- 10.1.3. Other Material Types
- 10.1.1. Plastic
- 10.2. Market Analysis, Insights and Forecast - by End-User Industry
- 10.2.1. Beverage
- 10.2.2. Food
- 10.2.3. Pharmaceutical and Healthcare
- 10.2.4. Cosmetics and Toiletries
- 10.2.5. Other En
- 10.1. Market Analysis, Insights and Forecast - by Material Type
- 11. Asia Pacific US Pharmaceutical Caps and Closures Industry Analysis, Insights and Forecast, 2020-2032
- 11.1. Market Analysis, Insights and Forecast - by Material Type
- 11.1.1. Plastic
- 11.1.1.1. PET
- 11.1.1.2. PP
- 11.1.1.3. HDPE and LDPE
- 11.1.1.4. Other Plastics
- 11.1.2. Metal
- 11.1.3. Other Material Types
- 11.1.1. Plastic
- 11.2. Market Analysis, Insights and Forecast - by End-User Industry
- 11.2.1. Beverage
- 11.2.2. Food
- 11.2.3. Pharmaceutical and Healthcare
- 11.2.4. Cosmetics and Toiletries
- 11.2.5. Other En
- 11.1. Market Analysis, Insights and Forecast - by Material Type
- 12. Competitive Analysis
- 12.1. Company Profiles
- 12.1.1 Aptar Group Inc
- 12.1.1.1. Company Overview
- 12.1.1.2. Products
- 12.1.1.3. Company Financials
- 12.1.1.4. SWOT Analysis
- 12.1.2 Tetra Pak International Sa
- 12.1.2.1. Company Overview
- 12.1.2.2. Products
- 12.1.2.3. Company Financials
- 12.1.2.4. SWOT Analysis
- 12.1.3 Coral Products Plc
- 12.1.3.1. Company Overview
- 12.1.3.2. Products
- 12.1.3.3. Company Financials
- 12.1.3.4. SWOT Analysis
- 12.1.4 Amcor Plc
- 12.1.4.1. Company Overview
- 12.1.4.2. Products
- 12.1.4.3. Company Financials
- 12.1.4.4. SWOT Analysis
- 12.1.5 Crown Holdings Inc
- 12.1.5.1. Company Overview
- 12.1.5.2. Products
- 12.1.5.3. Company Financials
- 12.1.5.4. SWOT Analysis
- 12.1.6 O Berk Company Llc*List Not Exhaustive
- 12.1.6.1. Company Overview
- 12.1.6.2. Products
- 12.1.6.3. Company Financials
- 12.1.6.4. SWOT Analysis
- 12.1.7 Bericap Holdings
- 12.1.7.1. Company Overview
- 12.1.7.2. Products
- 12.1.7.3. Company Financials
- 12.1.7.4. SWOT Analysis
- 12.1.8 Silgan Closures
- 12.1.8.1. Company Overview
- 12.1.8.2. Products
- 12.1.8.3. Company Financials
- 12.1.8.4. SWOT Analysis
- 12.1.9 Mjs Packaging
- 12.1.9.1. Company Overview
- 12.1.9.2. Products
- 12.1.9.3. Company Financials
- 12.1.9.4. SWOT Analysis
- 12.1.10 Albéa S A
- 12.1.10.1. Company Overview
- 12.1.10.2. Products
- 12.1.10.3. Company Financials
- 12.1.10.4. SWOT Analysis
- 12.1.11 Berry Global Inc
- 12.1.11.1. Company Overview
- 12.1.11.2. Products
- 12.1.11.3. Company Financials
- 12.1.11.4. SWOT Analysis
- 12.1.12 Closure Systems International
- 12.1.12.1. Company Overview
- 12.1.12.2. Products
- 12.1.12.3. Company Financials
- 12.1.12.4. SWOT Analysis
- 12.1.1 Aptar Group Inc
- 12.2. Market Entropy
- 12.2.1 Company's Key Areas Served
- 12.2.2 Recent Developments
- 12.3. Company Market Share Analysis 2025
- 12.3.1 Top 5 Companies Market Share Analysis
- 12.3.2 Top 3 Companies Market Share Analysis
- 12.4. List of Potential Customers
- 13. Research Methodology
List of Figures
- Figure 1: Global US Pharmaceutical Caps and Closures Industry Revenue Breakdown (billion, %) by Region 2025 & 2033
- Figure 2: North America US Pharmaceutical Caps and Closures Industry Revenue (billion), by Material Type 2025 & 2033
- Figure 3: North America US Pharmaceutical Caps and Closures Industry Revenue Share (%), by Material Type 2025 & 2033
- Figure 4: North America US Pharmaceutical Caps and Closures Industry Revenue (billion), by End-User Industry 2025 & 2033
- Figure 5: North America US Pharmaceutical Caps and Closures Industry Revenue Share (%), by End-User Industry 2025 & 2033
- Figure 6: North America US Pharmaceutical Caps and Closures Industry Revenue (billion), by Country 2025 & 2033
- Figure 7: North America US Pharmaceutical Caps and Closures Industry Revenue Share (%), by Country 2025 & 2033
- Figure 8: South America US Pharmaceutical Caps and Closures Industry Revenue (billion), by Material Type 2025 & 2033
- Figure 9: South America US Pharmaceutical Caps and Closures Industry Revenue Share (%), by Material Type 2025 & 2033
- Figure 10: South America US Pharmaceutical Caps and Closures Industry Revenue (billion), by End-User Industry 2025 & 2033
- Figure 11: South America US Pharmaceutical Caps and Closures Industry Revenue Share (%), by End-User Industry 2025 & 2033
- Figure 12: South America US Pharmaceutical Caps and Closures Industry Revenue (billion), by Country 2025 & 2033
- Figure 13: South America US Pharmaceutical Caps and Closures Industry Revenue Share (%), by Country 2025 & 2033
- Figure 14: Europe US Pharmaceutical Caps and Closures Industry Revenue (billion), by Material Type 2025 & 2033
- Figure 15: Europe US Pharmaceutical Caps and Closures Industry Revenue Share (%), by Material Type 2025 & 2033
- Figure 16: Europe US Pharmaceutical Caps and Closures Industry Revenue (billion), by End-User Industry 2025 & 2033
- Figure 17: Europe US Pharmaceutical Caps and Closures Industry Revenue Share (%), by End-User Industry 2025 & 2033
- Figure 18: Europe US Pharmaceutical Caps and Closures Industry Revenue (billion), by Country 2025 & 2033
- Figure 19: Europe US Pharmaceutical Caps and Closures Industry Revenue Share (%), by Country 2025 & 2033
- Figure 20: Middle East & Africa US Pharmaceutical Caps and Closures Industry Revenue (billion), by Material Type 2025 & 2033
- Figure 21: Middle East & Africa US Pharmaceutical Caps and Closures Industry Revenue Share (%), by Material Type 2025 & 2033
- Figure 22: Middle East & Africa US Pharmaceutical Caps and Closures Industry Revenue (billion), by End-User Industry 2025 & 2033
- Figure 23: Middle East & Africa US Pharmaceutical Caps and Closures Industry Revenue Share (%), by End-User Industry 2025 & 2033
- Figure 24: Middle East & Africa US Pharmaceutical Caps and Closures Industry Revenue (billion), by Country 2025 & 2033
- Figure 25: Middle East & Africa US Pharmaceutical Caps and Closures Industry Revenue Share (%), by Country 2025 & 2033
- Figure 26: Asia Pacific US Pharmaceutical Caps and Closures Industry Revenue (billion), by Material Type 2025 & 2033
- Figure 27: Asia Pacific US Pharmaceutical Caps and Closures Industry Revenue Share (%), by Material Type 2025 & 2033
- Figure 28: Asia Pacific US Pharmaceutical Caps and Closures Industry Revenue (billion), by End-User Industry 2025 & 2033
- Figure 29: Asia Pacific US Pharmaceutical Caps and Closures Industry Revenue Share (%), by End-User Industry 2025 & 2033
- Figure 30: Asia Pacific US Pharmaceutical Caps and Closures Industry Revenue (billion), by Country 2025 & 2033
- Figure 31: Asia Pacific US Pharmaceutical Caps and Closures Industry Revenue Share (%), by Country 2025 & 2033
List of Tables
- Table 1: Global US Pharmaceutical Caps and Closures Industry Revenue billion Forecast, by Material Type 2020 & 2033
- Table 2: Global US Pharmaceutical Caps and Closures Industry Revenue billion Forecast, by End-User Industry 2020 & 2033
- Table 3: Global US Pharmaceutical Caps and Closures Industry Revenue billion Forecast, by Region 2020 & 2033
- Table 4: Global US Pharmaceutical Caps and Closures Industry Revenue billion Forecast, by Material Type 2020 & 2033
- Table 5: Global US Pharmaceutical Caps and Closures Industry Revenue billion Forecast, by End-User Industry 2020 & 2033
- Table 6: Global US Pharmaceutical Caps and Closures Industry Revenue billion Forecast, by Country 2020 & 2033
- Table 7: United States US Pharmaceutical Caps and Closures Industry Revenue (billion) Forecast, by Application 2020 & 2033
- Table 8: Canada US Pharmaceutical Caps and Closures Industry Revenue (billion) Forecast, by Application 2020 & 2033
- Table 9: Mexico US Pharmaceutical Caps and Closures Industry Revenue (billion) Forecast, by Application 2020 & 2033
- Table 10: Global US Pharmaceutical Caps and Closures Industry Revenue billion Forecast, by Material Type 2020 & 2033
- Table 11: Global US Pharmaceutical Caps and Closures Industry Revenue billion Forecast, by End-User Industry 2020 & 2033
- Table 12: Global US Pharmaceutical Caps and Closures Industry Revenue billion Forecast, by Country 2020 & 2033
- Table 13: Brazil US Pharmaceutical Caps and Closures Industry Revenue (billion) Forecast, by Application 2020 & 2033
- Table 14: Argentina US Pharmaceutical Caps and Closures Industry Revenue (billion) Forecast, by Application 2020 & 2033
- Table 15: Rest of South America US Pharmaceutical Caps and Closures Industry Revenue (billion) Forecast, by Application 2020 & 2033
- Table 16: Global US Pharmaceutical Caps and Closures Industry Revenue billion Forecast, by Material Type 2020 & 2033
- Table 17: Global US Pharmaceutical Caps and Closures Industry Revenue billion Forecast, by End-User Industry 2020 & 2033
- Table 18: Global US Pharmaceutical Caps and Closures Industry Revenue billion Forecast, by Country 2020 & 2033
- Table 19: United Kingdom US Pharmaceutical Caps and Closures Industry Revenue (billion) Forecast, by Application 2020 & 2033
- Table 20: Germany US Pharmaceutical Caps and Closures Industry Revenue (billion) Forecast, by Application 2020 & 2033
- Table 21: France US Pharmaceutical Caps and Closures Industry Revenue (billion) Forecast, by Application 2020 & 2033
- Table 22: Italy US Pharmaceutical Caps and Closures Industry Revenue (billion) Forecast, by Application 2020 & 2033
- Table 23: Spain US Pharmaceutical Caps and Closures Industry Revenue (billion) Forecast, by Application 2020 & 2033
- Table 24: Russia US Pharmaceutical Caps and Closures Industry Revenue (billion) Forecast, by Application 2020 & 2033
- Table 25: Benelux US Pharmaceutical Caps and Closures Industry Revenue (billion) Forecast, by Application 2020 & 2033
- Table 26: Nordics US Pharmaceutical Caps and Closures Industry Revenue (billion) Forecast, by Application 2020 & 2033
- Table 27: Rest of Europe US Pharmaceutical Caps and Closures Industry Revenue (billion) Forecast, by Application 2020 & 2033
- Table 28: Global US Pharmaceutical Caps and Closures Industry Revenue billion Forecast, by Material Type 2020 & 2033
- Table 29: Global US Pharmaceutical Caps and Closures Industry Revenue billion Forecast, by End-User Industry 2020 & 2033
- Table 30: Global US Pharmaceutical Caps and Closures Industry Revenue billion Forecast, by Country 2020 & 2033
- Table 31: Turkey US Pharmaceutical Caps and Closures Industry Revenue (billion) Forecast, by Application 2020 & 2033
- Table 32: Israel US Pharmaceutical Caps and Closures Industry Revenue (billion) Forecast, by Application 2020 & 2033
- Table 33: GCC US Pharmaceutical Caps and Closures Industry Revenue (billion) Forecast, by Application 2020 & 2033
- Table 34: North Africa US Pharmaceutical Caps and Closures Industry Revenue (billion) Forecast, by Application 2020 & 2033
- Table 35: South Africa US Pharmaceutical Caps and Closures Industry Revenue (billion) Forecast, by Application 2020 & 2033
- Table 36: Rest of Middle East & Africa US Pharmaceutical Caps and Closures Industry Revenue (billion) Forecast, by Application 2020 & 2033
- Table 37: Global US Pharmaceutical Caps and Closures Industry Revenue billion Forecast, by Material Type 2020 & 2033
- Table 38: Global US Pharmaceutical Caps and Closures Industry Revenue billion Forecast, by End-User Industry 2020 & 2033
- Table 39: Global US Pharmaceutical Caps and Closures Industry Revenue billion Forecast, by Country 2020 & 2033
- Table 40: China US Pharmaceutical Caps and Closures Industry Revenue (billion) Forecast, by Application 2020 & 2033
- Table 41: India US Pharmaceutical Caps and Closures Industry Revenue (billion) Forecast, by Application 2020 & 2033
- Table 42: Japan US Pharmaceutical Caps and Closures Industry Revenue (billion) Forecast, by Application 2020 & 2033
- Table 43: South Korea US Pharmaceutical Caps and Closures Industry Revenue (billion) Forecast, by Application 2020 & 2033
- Table 44: ASEAN US Pharmaceutical Caps and Closures Industry Revenue (billion) Forecast, by Application 2020 & 2033
- Table 45: Oceania US Pharmaceutical Caps and Closures Industry Revenue (billion) Forecast, by Application 2020 & 2033
- Table 46: Rest of Asia Pacific US Pharmaceutical Caps and Closures Industry Revenue (billion) Forecast, by Application 2020 & 2033
Frequently Asked Questions
1. What is the projected Compound Annual Growth Rate (CAGR) of the US Pharmaceutical Caps and Closures Industry?
The projected CAGR is approximately 4.6%.
2. Which companies are prominent players in the US Pharmaceutical Caps and Closures Industry?
Key companies in the market include Aptar Group Inc, Tetra Pak International Sa, Coral Products Plc, Amcor Plc, Crown Holdings Inc, O Berk Company Llc*List Not Exhaustive, Bericap Holdings, Silgan Closures, Mjs Packaging, Albéa S A, Berry Global Inc, Closure Systems International.
3. What are the main segments of the US Pharmaceutical Caps and Closures Industry?
The market segments include Material Type, End-User Industry.
4. Can you provide details about the market size?
The market size is estimated to be USD 13.3 billion as of 2022.
5. What are some drivers contributing to market growth?
; The Increased Demand for Innovative Solutions from Different End Users..
6. What are the notable trends driving market growth?
Plastic to Witness a Highest Growth.
7. Are there any restraints impacting market growth?
; Stringent Regulation on Manufacturers Pertaining to Environmental Degradation.
8. Can you provide examples of recent developments in the market?
N/A
9. What pricing options are available for accessing the report?
Pricing options include single-user, multi-user, and enterprise licenses priced at USD 3800, USD 4500, and USD 5800 respectively.
10. Is the market size provided in terms of value or volume?
The market size is provided in terms of value, measured in billion.
11. Are there any specific market keywords associated with the report?
Yes, the market keyword associated with the report is "US Pharmaceutical Caps and Closures Industry," which aids in identifying and referencing the specific market segment covered.
12. How do I determine which pricing option suits my needs best?
The pricing options vary based on user requirements and access needs. Individual users may opt for single-user licenses, while businesses requiring broader access may choose multi-user or enterprise licenses for cost-effective access to the report.
13. Are there any additional resources or data provided in the US Pharmaceutical Caps and Closures Industry report?
While the report offers comprehensive insights, it's advisable to review the specific contents or supplementary materials provided to ascertain if additional resources or data are available.
14. How can I stay updated on further developments or reports in the US Pharmaceutical Caps and Closures Industry?
To stay informed about further developments, trends, and reports in the US Pharmaceutical Caps and Closures Industry, consider subscribing to industry newsletters, following relevant companies and organizations, or regularly checking reputable industry news sources and publications.
Methodology
Step 1 - Identification of Relevant Samples Size from Population Database


Step 2 - Approaches for Defining Global Market Size (Value, Volume* & Price*)

Note*: In applicable scenarios
Step 3 - Data Sources
Primary Research
- Web Analytics
- Survey Reports
- Research Institute
- Latest Research Reports
- Opinion Leaders
Secondary Research
- Annual Reports
- White Paper
- Latest Press Release
- Industry Association
- Paid Database
- Investor Presentations

Step 4 - Data Triangulation
Involves using different sources of information in order to increase the validity of a study
These sources are likely to be stakeholders in a program - participants, other researchers, program staff, other community members, and so on.
Then we put all data in single framework & apply various statistical tools to find out the dynamic on the market.
During the analysis stage, feedback from the stakeholder groups would be compared to determine areas of agreement as well as areas of divergence