

Key Insights
The Asia Pacific metal cans market is projected to reach approximately USD 16098.8 million by 2033, exhibiting a Compound Annual Growth Rate (CAGR) of 6.9% from a base year of 2024. This growth is driven by increasing demand for convenient and durable packaging, particularly in the food and beverage sectors, fueled by rising urbanization and disposable incomes in key economies. The expanding beverage industry and consumer preference for sustainable packaging solutions further support market expansion.
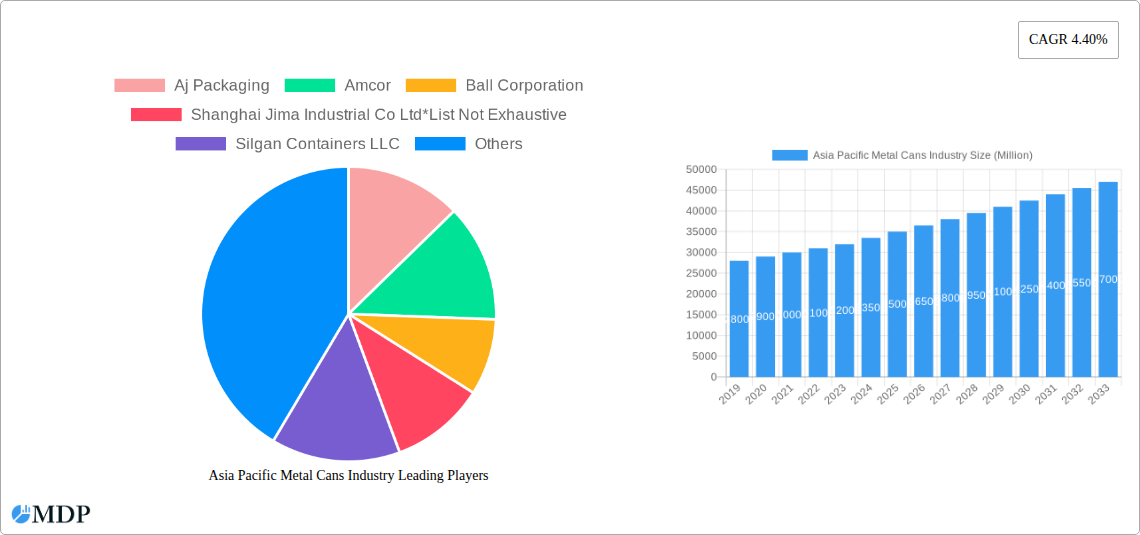
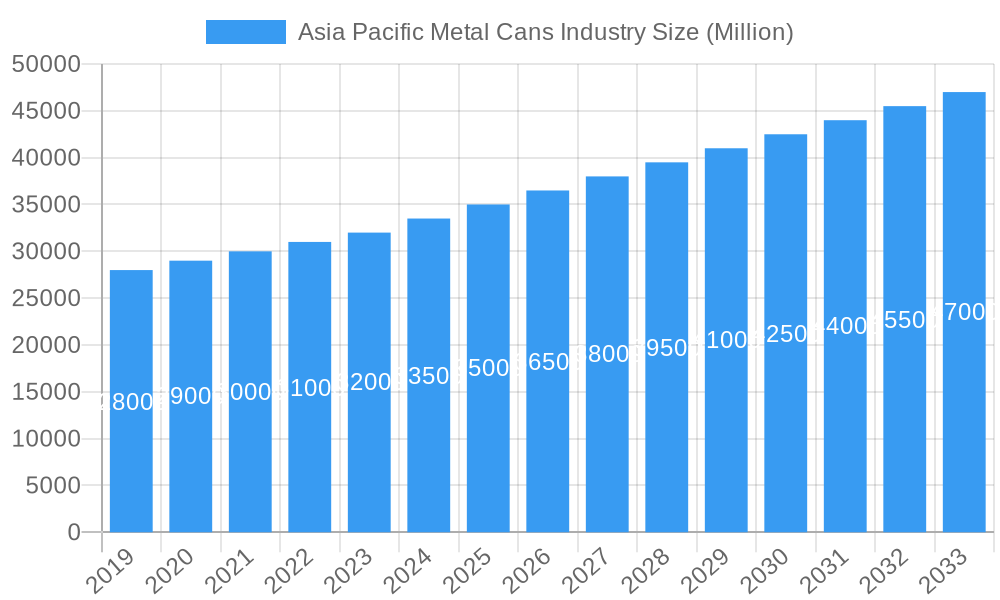
Asia Pacific Metal Cans Industry Market Size (In Billion)
Key market drivers include the growth of the food processing industry, the robust beverage sector (alcoholic and non-alcoholic), and the increasing application of aerosol cans across cosmetics, personal care, household, and pharmaceutical products. The inherent integrity and extended shelf life provided by metal cans make them essential across diverse industries. However, market growth may be influenced by raw material price volatility (aluminum and steel), competition from alternative packaging materials, and evolving environmental regulations. Despite these challenges, the recyclability and durability of metal cans, combined with technological advancements in manufacturing, are expected to maintain a positive market trajectory.
Asia Pacific Metal Cans Industry Company Market Share
This report offers a comprehensive analysis of the Asia Pacific metal cans market from 2019 to 2033, with 2024 as the base year. It examines critical market dynamics, emerging trends, key segments including aluminum and steel cans, and leading players. Detailed insights cover food cans, beverage cans (alcoholic and non-alcoholic), and aerosol cans (for cosmetic, personal care, household, and pharmaceutical applications). Understand market penetration, CAGR projections, and strategic insights to navigate this evolving market landscape.
Asia Pacific Metal Cans Industry Market Dynamics & Concentration
The Asia Pacific metal cans industry exhibits a moderate to high level of market concentration, with a few key players dominating significant market share. For instance, Amcor and Ball Corporation hold substantial sway in the global market, and their presence in the Asia Pacific is significant. Innovation drivers are primarily fueled by the increasing demand for sustainable packaging solutions, advancements in manufacturing technologies that reduce production costs, and evolving consumer preferences for convenience and product safety. Regulatory frameworks, particularly concerning food contact materials and environmental impact, play a crucial role in shaping product development and market entry. The threat of product substitutes, such as flexible packaging and glass, remains a factor, though metal cans offer superior barrier properties and recyclability in many applications. End-user trends point towards a growing demand for premium and differentiated packaging, especially within the beverage and cosmetic sectors. Mergers and acquisitions (M&A) activity, while not extensively documented for every transaction within the region, are a strategic tool for consolidation and market expansion. The report estimates an average M&A deal count of 3-5 significant transactions annually within the broader Asia Pacific packaging sector, influencing the metal can landscape.
Asia Pacific Metal Cans Industry Industry Trends & Analysis
The Asia Pacific metal cans industry is on a robust growth trajectory, driven by a confluence of factors including burgeoning populations, rising disposable incomes, and an increasing adoption of packaged goods across diverse end-use sectors. The market penetration of metal cans is steadily increasing, particularly in developing economies within the region where urbanization and changing lifestyles are fueling demand for convenient and safe packaging for food, beverages, and personal care products. The Compound Annual Growth Rate (CAGR) for the Asia Pacific metal cans market is projected to be between 5.5% and 6.5% during the forecast period (2025-2033). Technological disruptions are a significant trend, with a strong focus on lightweighting of aluminum and steel cans to reduce material costs and transportation emissions. Innovations in can coatings and liners are enhancing product shelf-life and safety, crucial for food cans containing items like vegetables, fruits, pet food, soups, and coffee. The beverage segment, encompassing both alcoholic beverages and non-alcoholic beverages, is experiencing a surge in demand for aesthetically pleasing and functional cans, driving innovation in printing and finishing techniques. Aerosol can applications, spanning cosmetic and personal care, household products, and pharmaceuticals, are also seeing growth, albeit with a greater emphasis on safety and regulatory compliance. Competitive dynamics are intense, with companies continuously investing in R&D to enhance production efficiency, develop sustainable alternatives, and expand their market reach within the diverse Asia Pacific landscape.
Leading Markets & Segments in Asia Pacific Metal Cans Industry
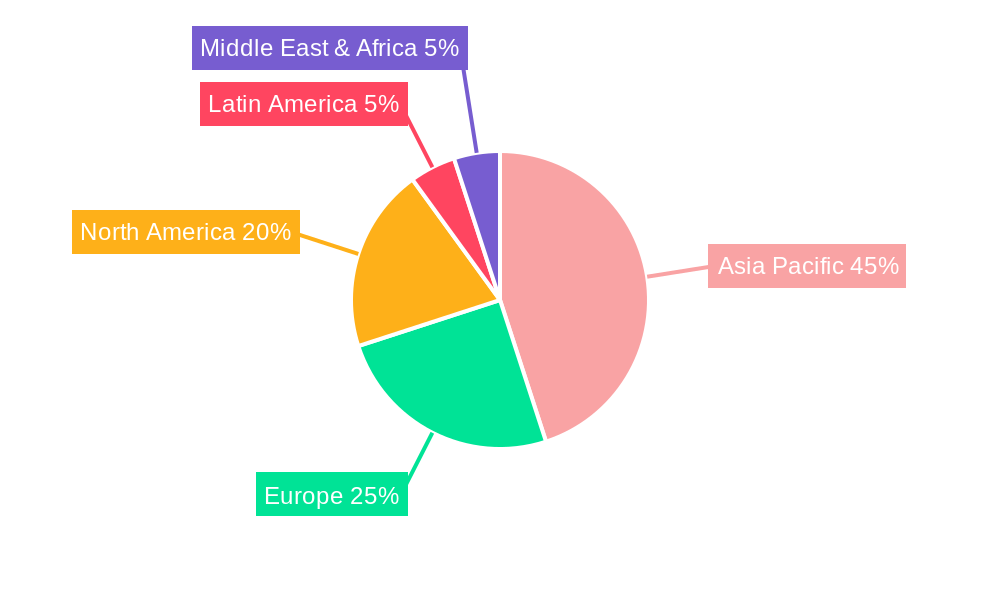
The Asia Pacific metal cans industry is characterized by the dominance of specific regions and product segments, driven by robust economic growth, favorable demographic trends, and established industrial bases. China stands out as the leading market, accounting for an estimated 40% of the regional market share due to its vast population, expanding manufacturing capabilities, and significant domestic consumption. India follows as another major growth engine, with its rapidly increasing middle class and a growing demand for packaged goods.
Material Type Dominance:
- Aluminum Cans: This segment holds a commanding position, estimated to capture over 65% of the market revenue. Key drivers include its lightweight nature, excellent recyclability, and perceived premium appeal, particularly for beverages and aerosols. Economic policies promoting recycling initiatives and the automotive industry's demand for aluminum are also contributing factors.
- Steel Cans: While holding a smaller share (around 35%), steel cans remain crucial, especially for food packaging like soups and pet food, owing to their strength and cost-effectiveness. Government support for domestic manufacturing and the established infrastructure for steel production are key enablers.
Can Type Dominance:
- Beverage Cans: This segment is the largest revenue generator, representing approximately 50% of the market.
- Non-alcoholic Beverages: The burgeoning demand for soft drinks, juices, and energy drinks in densely populated urban areas fuels this sub-segment. Economic growth and the increasing availability of chilled beverages are major drivers.
- Alcoholic Beverages: The growing middle class and evolving social trends are boosting the demand for canned alcoholic beverages, including beer and ready-to-drink cocktails.
- Food Cans: This segment accounts for around 30% of the market, with strong demand for vegetables, fruits, pet food, soups, and coffee. Factors include increasing urbanization, a need for longer shelf-life products, and growing consumer awareness of convenience.
- Aerosol Cans: This segment, comprising about 15% of the market, sees significant demand from cosmetic and personal care products, followed by household products. Growth is supported by rising disposable incomes and a demand for convenient application formats.
- Other Can Types: This residual segment, estimated at 5%, includes various industrial applications and specialized packaging needs.
- Beverage Cans: This segment is the largest revenue generator, representing approximately 50% of the market.
The dominance of these segments is further reinforced by extensive distribution networks, favorable government policies promoting manufacturing, and substantial investments in infrastructure that facilitate the production and transportation of metal cans across the Asia Pacific region.
Asia Pacific Metal Cans Industry Product Developments
Product development in the Asia Pacific metal cans industry is heavily focused on enhancing sustainability, improving functionality, and reducing costs. Lightweighting of aluminum cans by up to 10% has been a significant trend, leading to material savings and reduced environmental impact. Innovations in can coatings are enabling the use of a wider range of food products, including acidic fruits and vegetables, while ensuring product safety and extending shelf life. The development of advanced printing technologies allows for more vibrant and sophisticated designs on beverage and aerosol cans, catering to brand differentiation and consumer appeal. Furthermore, advancements in can manufacturing processes, such as the adoption of high-speed filling lines and improved seaming techniques, are contributing to increased production efficiency and cost competitiveness, providing a clear market advantage.
Key Drivers of Asia Pacific Metal Cans Industry Growth
The Asia Pacific metal cans industry's growth is propelled by several key drivers.
- Technological Advancements: Innovations in lightweighting, enhanced barrier properties, and energy-efficient manufacturing processes are crucial. For example, the introduction of thinner gauge aluminum alloys significantly reduces material usage per can.
- Economic Growth & Rising Disposable Incomes: Expanding middle classes in countries like China, India, and Southeast Asian nations are increasing consumer spending on packaged goods, directly boosting demand for metal cans.
- Sustainability Initiatives: Growing environmental awareness and regulatory pressures are favoring the highly recyclable nature of metal cans over alternatives, especially for beverage packaging.
- Evolving Consumer Preferences: Demand for convenience, longer shelf-life products, and premium packaging for beverages and personal care items further fuels market expansion.
Challenges in the Asia Pacific Metal Cans Industry Market
The Asia Pacific metal cans industry faces several challenges that could impede growth.
- Fluctuating Raw Material Prices: Volatility in aluminum and steel prices directly impacts production costs and profit margins for manufacturers. Significant price surges of 5-10% can strain profitability.
- Intensifying Competition: The market is highly competitive, with numerous local and international players vying for market share, leading to price pressures.
- Supply Chain Disruptions: Geopolitical events, trade policies, and logistical complexities can disrupt the sourcing of raw materials and the distribution of finished products. For instance, disruptions can lead to delays of up to 15-20% in delivery times.
- Environmental Regulations: While sustainability is a driver, increasingly stringent regulations regarding emissions and waste management can necessitate significant capital investment for compliance.
Emerging Opportunities in Asia Pacific Metal Cans Industry
Emerging opportunities in the Asia Pacific metal cans industry are numerous and poised to shape its future. Technological breakthroughs in advanced recycling processes, allowing for higher quality recycled aluminum, present a significant opportunity for cost reduction and enhanced sustainability. Strategic partnerships between can manufacturers and beverage or food companies to develop innovative packaging solutions tailored to specific regional tastes and preferences are also on the rise. Market expansion into untapped segments, such as pharmaceutical packaging for emerging markets, and the development of specialty cans for niche products offer substantial growth potential. Furthermore, the increasing focus on e-commerce and direct-to-consumer models is creating demand for robust and aesthetically pleasing metal packaging that can withstand shipping.
Leading Players in the Asia Pacific Metal Cans Industry Sector
- Aj Packaging
- Amcor
- Ball Corporation
- Shanghai Jima Industrial Co Ltd
- Silgan Containers LLC
- Crown Holdings
- EBI Packaging
- BWAY
Key Milestones in Asia Pacific Metal Cans Industry Industry
- February 2021: The central can testing laboratory of China's Sunrise Group (formerly Shengxing Group) in Anhui was officially accredited by PepsiCo, marking a significant advancement in China's can testing capabilities and signaling a move towards enhanced R&D and quality control.
- Ongoing Trend (2021-Present): Companies are increasingly investing in cutting-edge technologies and building robust R&D and testing infrastructure to reduce the cost of metal can production. This proactive approach aims to improve efficiency and competitiveness in a dynamic market.
Strategic Outlook for Asia Pacific Metal Cans Industry Market
The strategic outlook for the Asia Pacific metal cans industry is overwhelmingly positive, characterized by continuous innovation and market expansion. The ongoing shift towards sustainable packaging will further cement the dominance of recyclable aluminum and steel cans. Companies that invest in advanced manufacturing technologies to optimize production costs and enhance product functionality will be well-positioned for success. Furthermore, strategic collaborations with end-users to develop bespoke packaging solutions and an aggressive expansion into emerging economies within the region will be key growth accelerators. The industry is poised to witness sustained demand, driven by evolving consumer lifestyles and a growing emphasis on product safety and environmental responsibility.
Asia Pacific Metal Cans Industry Segmentation
-
1. Material Type
- 1.1. Aluminum
- 1.2. Steel
-
2. Can Types
-
2.1. Food
- 2.1.1. Vegetables
- 2.1.2. Fruits
- 2.1.3. Pet Food
- 2.1.4. Soups
- 2.1.5. Coffee
- 2.1.6. Other Types of Food Cans
-
2.2. Beverage
- 2.2.1. Alcoholic Beverages
- 2.2.2. Non-alcoholic Beverages
-
2.3. Aerosol
- 2.3.1. Cosmetic and Personal Care
- 2.3.2. Household
- 2.3.3. Pharmaceutical/Veterinary
- 2.3.4. Paints and Varnishes
- 2.3.5. Automotive/Industrial
- 2.3.6. Other End-user Industries
- 2.4. Other Can Types
-
2.1. Food
Asia Pacific Metal Cans Industry Segmentation By Geography
-
1. Asia Pacific
- 1.1. China
- 1.2. Japan
- 1.3. South Korea
- 1.4. India
- 1.5. Australia
- 1.6. New Zealand
- 1.7. Indonesia
- 1.8. Malaysia
- 1.9. Singapore
- 1.10. Thailand
- 1.11. Vietnam
- 1.12. Philippines
Asia Pacific Metal Cans Industry Regional Market Share
Geographic Coverage of Asia Pacific Metal Cans Industry
Asia Pacific Metal Cans Industry REPORT HIGHLIGHTS
| Aspects | Details |
|---|---|
| Study Period | 2020-2034 |
| Base Year | 2025 |
| Estimated Year | 2026 |
| Forecast Period | 2026-2034 |
| Historical Period | 2020-2025 |
| Growth Rate | CAGR of 6.9% from 2020-2034 |
| Segmentation |
|
Table of Contents
- 1. Introduction
- 1.1. Research Scope
- 1.2. Market Segmentation
- 1.3. Research Objective
- 1.4. Definitions and Assumptions
- 2. Executive Summary
- 2.1. Market Snapshot
- 3. Market Dynamics
- 3.1. Market Drivers
- 3.2. Market Restrains
- 3.3. Market Trends
- 3.4. Market Opportunities
- 4. Market Factor Analysis
- 4.1. Porters Five Forces
- 4.1.1. Bargaining Power of Suppliers
- 4.1.2. Bargaining Power of Buyers
- 4.1.3. Threat of New Entrants
- 4.1.4. Threat of Substitutes
- 4.1.5. Competitive Rivalry
- 4.2. PESTEL analysis
- 4.3. BCG Analysis
- 4.3.1. Stars (High Growth, High Market Share)
- 4.3.2. Cash Cows (Low Growth, High Market Share)
- 4.3.3. Question Mark (High Growth, Low Market Share)
- 4.3.4. Dogs (Low Growth, Low Market Share)
- 4.4. Ansoff Matrix Analysis
- 4.5. Supply Chain Analysis
- 4.6. Regulatory Landscape
- 4.7. Current Market Potential and Opportunity Assessment (TAM–SAM–SOM Framework)
- 4.8. MDP Analyst Note
- 4.1. Porters Five Forces
- 5. Market Analysis, Insights and Forecast 2021-2033
- 5.1. Market Analysis, Insights and Forecast - by Material Type
- 5.1.1. Aluminum
- 5.1.2. Steel
- 5.2. Market Analysis, Insights and Forecast - by Can Types
- 5.2.1. Food
- 5.2.1.1. Vegetables
- 5.2.1.2. Fruits
- 5.2.1.3. Pet Food
- 5.2.1.4. Soups
- 5.2.1.5. Coffee
- 5.2.1.6. Other Types of Food Cans
- 5.2.2. Beverage
- 5.2.2.1. Alcoholic Beverages
- 5.2.2.2. Non-alcoholic Beverages
- 5.2.3. Aerosol
- 5.2.3.1. Cosmetic and Personal Care
- 5.2.3.2. Household
- 5.2.3.3. Pharmaceutical/Veterinary
- 5.2.3.4. Paints and Varnishes
- 5.2.3.5. Automotive/Industrial
- 5.2.3.6. Other End-user Industries
- 5.2.4. Other Can Types
- 5.2.1. Food
- 5.3. Market Analysis, Insights and Forecast - by Region
- 5.3.1. Asia Pacific
- 5.1. Market Analysis, Insights and Forecast - by Material Type
- 6. Asia Pacific Metal Cans Industry Analysis, Insights and Forecast, 2021-2033
- 6.1. Market Analysis, Insights and Forecast - by Material Type
- 6.1.1. Aluminum
- 6.1.2. Steel
- 6.2. Market Analysis, Insights and Forecast - by Can Types
- 6.2.1. Food
- 6.2.1.1. Vegetables
- 6.2.1.2. Fruits
- 6.2.1.3. Pet Food
- 6.2.1.4. Soups
- 6.2.1.5. Coffee
- 6.2.1.6. Other Types of Food Cans
- 6.2.2. Beverage
- 6.2.2.1. Alcoholic Beverages
- 6.2.2.2. Non-alcoholic Beverages
- 6.2.3. Aerosol
- 6.2.3.1. Cosmetic and Personal Care
- 6.2.3.2. Household
- 6.2.3.3. Pharmaceutical/Veterinary
- 6.2.3.4. Paints and Varnishes
- 6.2.3.5. Automotive/Industrial
- 6.2.3.6. Other End-user Industries
- 6.2.4. Other Can Types
- 6.2.1. Food
- 6.1. Market Analysis, Insights and Forecast - by Material Type
- 7. Competitive Analysis
- 7.1. Company Profiles
- 7.1.1 Aj Packaging
- 7.1.1.1. Company Overview
- 7.1.1.2. Products
- 7.1.1.3. Company Financials
- 7.1.1.4. SWOT Analysis
- 7.1.2 Amcor
- 7.1.2.1. Company Overview
- 7.1.2.2. Products
- 7.1.2.3. Company Financials
- 7.1.2.4. SWOT Analysis
- 7.1.3 Ball Corporation
- 7.1.3.1. Company Overview
- 7.1.3.2. Products
- 7.1.3.3. Company Financials
- 7.1.3.4. SWOT Analysis
- 7.1.4 Shanghai Jima Industrial Co Ltd*List Not Exhaustive
- 7.1.4.1. Company Overview
- 7.1.4.2. Products
- 7.1.4.3. Company Financials
- 7.1.4.4. SWOT Analysis
- 7.1.5 Silgan Containers LLC
- 7.1.5.1. Company Overview
- 7.1.5.2. Products
- 7.1.5.3. Company Financials
- 7.1.5.4. SWOT Analysis
- 7.1.6 Crown Holdings
- 7.1.6.1. Company Overview
- 7.1.6.2. Products
- 7.1.6.3. Company Financials
- 7.1.6.4. SWOT Analysis
- 7.1.7 EBI Packaging
- 7.1.7.1. Company Overview
- 7.1.7.2. Products
- 7.1.7.3. Company Financials
- 7.1.7.4. SWOT Analysis
- 7.1.8 BWAY
- 7.1.8.1. Company Overview
- 7.1.8.2. Products
- 7.1.8.3. Company Financials
- 7.1.8.4. SWOT Analysis
- 7.1.1 Aj Packaging
- 7.2. Market Entropy
- 7.2.1 Company's Key Areas Served
- 7.2.2 Recent Developments
- 7.3. Company Market Share Analysis 2025
- 7.3.1 Top 5 Companies Market Share Analysis
- 7.3.2 Top 3 Companies Market Share Analysis
- 7.4. List of Potential Customers
- 8. Research Methodology
List of Figures
- Figure 1: Asia Pacific Metal Cans Industry Revenue Breakdown (million, %) by Product 2025 & 2033
- Figure 2: Asia Pacific Metal Cans Industry Share (%) by Company 2025
List of Tables
- Table 1: Asia Pacific Metal Cans Industry Revenue million Forecast, by Material Type 2020 & 2033
- Table 2: Asia Pacific Metal Cans Industry Revenue million Forecast, by Can Types 2020 & 2033
- Table 3: Asia Pacific Metal Cans Industry Revenue million Forecast, by Region 2020 & 2033
- Table 4: Asia Pacific Metal Cans Industry Revenue million Forecast, by Material Type 2020 & 2033
- Table 5: Asia Pacific Metal Cans Industry Revenue million Forecast, by Can Types 2020 & 2033
- Table 6: Asia Pacific Metal Cans Industry Revenue million Forecast, by Country 2020 & 2033
- Table 7: China Asia Pacific Metal Cans Industry Revenue (million) Forecast, by Application 2020 & 2033
- Table 8: Japan Asia Pacific Metal Cans Industry Revenue (million) Forecast, by Application 2020 & 2033
- Table 9: South Korea Asia Pacific Metal Cans Industry Revenue (million) Forecast, by Application 2020 & 2033
- Table 10: India Asia Pacific Metal Cans Industry Revenue (million) Forecast, by Application 2020 & 2033
- Table 11: Australia Asia Pacific Metal Cans Industry Revenue (million) Forecast, by Application 2020 & 2033
- Table 12: New Zealand Asia Pacific Metal Cans Industry Revenue (million) Forecast, by Application 2020 & 2033
- Table 13: Indonesia Asia Pacific Metal Cans Industry Revenue (million) Forecast, by Application 2020 & 2033
- Table 14: Malaysia Asia Pacific Metal Cans Industry Revenue (million) Forecast, by Application 2020 & 2033
- Table 15: Singapore Asia Pacific Metal Cans Industry Revenue (million) Forecast, by Application 2020 & 2033
- Table 16: Thailand Asia Pacific Metal Cans Industry Revenue (million) Forecast, by Application 2020 & 2033
- Table 17: Vietnam Asia Pacific Metal Cans Industry Revenue (million) Forecast, by Application 2020 & 2033
- Table 18: Philippines Asia Pacific Metal Cans Industry Revenue (million) Forecast, by Application 2020 & 2033
Frequently Asked Questions
1. What is the projected Compound Annual Growth Rate (CAGR) of the Asia Pacific Metal Cans Industry?
The projected CAGR is approximately 6.9%.
2. Which companies are prominent players in the Asia Pacific Metal Cans Industry?
Key companies in the market include Aj Packaging, Amcor, Ball Corporation, Shanghai Jima Industrial Co Ltd*List Not Exhaustive, Silgan Containers LLC, Crown Holdings, EBI Packaging, BWAY.
3. What are the main segments of the Asia Pacific Metal Cans Industry?
The market segments include Material Type, Can Types.
4. Can you provide details about the market size?
The market size is estimated to be USD 16098.8 million as of 2022.
5. What are some drivers contributing to market growth?
High Recyclability Rates of Metal Packaging; Convenience and Lower Price Offered by Canned Food.
6. What are the notable trends driving market growth?
Canned Food to dominate market share.
7. Are there any restraints impacting market growth?
Presence of Alternate Packaging Solutions.
8. Can you provide examples of recent developments in the market?
February 2021 - the central can testing laboratory of China's Sunrise Group, formerly the Shengxing Group, in Anhui, was officially accredited by global food and drinks giant PepsiCo, and it became the first company in China to achieve this status. Therefore, companies are targeting to cut the cost of metal can production through the introduction of new technologies by building the required infrastructure for R&D and testing.
9. What pricing options are available for accessing the report?
Pricing options include single-user, multi-user, and enterprise licenses priced at USD 4750, USD 4950, and USD 6800 respectively.
10. Is the market size provided in terms of value or volume?
The market size is provided in terms of value, measured in million.
11. Are there any specific market keywords associated with the report?
Yes, the market keyword associated with the report is "Asia Pacific Metal Cans Industry," which aids in identifying and referencing the specific market segment covered.
12. How do I determine which pricing option suits my needs best?
The pricing options vary based on user requirements and access needs. Individual users may opt for single-user licenses, while businesses requiring broader access may choose multi-user or enterprise licenses for cost-effective access to the report.
13. Are there any additional resources or data provided in the Asia Pacific Metal Cans Industry report?
While the report offers comprehensive insights, it's advisable to review the specific contents or supplementary materials provided to ascertain if additional resources or data are available.
14. How can I stay updated on further developments or reports in the Asia Pacific Metal Cans Industry?
To stay informed about further developments, trends, and reports in the Asia Pacific Metal Cans Industry, consider subscribing to industry newsletters, following relevant companies and organizations, or regularly checking reputable industry news sources and publications.
Methodology
Step 1 - Identification of Relevant Samples Size from Population Database


Step 2 - Approaches for Defining Global Market Size (Value, Volume* & Price*)

Note*: In applicable scenarios
Step 3 - Data Sources
Primary Research
- Web Analytics
- Survey Reports
- Research Institute
- Latest Research Reports
- Opinion Leaders
Secondary Research
- Annual Reports
- White Paper
- Latest Press Release
- Industry Association
- Paid Database
- Investor Presentations

Step 4 - Data Triangulation
Involves using different sources of information in order to increase the validity of a study
These sources are likely to be stakeholders in a program - participants, other researchers, program staff, other community members, and so on.
Then we put all data in single framework & apply various statistical tools to find out the dynamic on the market.
During the analysis stage, feedback from the stakeholder groups would be compared to determine areas of agreement as well as areas of divergence