

Key Insights
The Asia-Pacific (APAC) plastic caps and closures market is poised for significant expansion, driven by robust growth in the food & beverage, pharmaceutical, and consumer goods sectors. Projected at a 5.52% CAGR, this steady increase underscores the escalating demand for these critical packaging components. Key growth catalysts include rising disposable incomes, evolving consumer preferences for convenient packaging solutions, and the widespread adoption of plastic packaging across diverse industries. Notably, China and India are experiencing substantial growth, attributed to their large populations and burgeoning middle classes. The market is dominated by PET and PP materials, valued for their cost-effectiveness and versatility. However, growing environmental concerns regarding plastic waste are accelerating the adoption of sustainable alternatives like biodegradable and recycled plastics, presenting both challenges and opportunities for market participants. Innovations in eco-friendly solutions will be pivotal for gaining a competitive advantage. The beverage segment, particularly bottled water and ready-to-drink (RTD) beverages, is a major contributor to market expansion. Regional regulatory variations and differing infrastructural development across APAC contribute to dynamic market conditions, with countries like China and India offering high growth potential while others may exhibit slower adoption rates influenced by economic development and consumer behavior. Intense market competition among local and multinational players necessitates strategic partnerships, continuous product innovation, and a strong commitment to sustainability for future success.
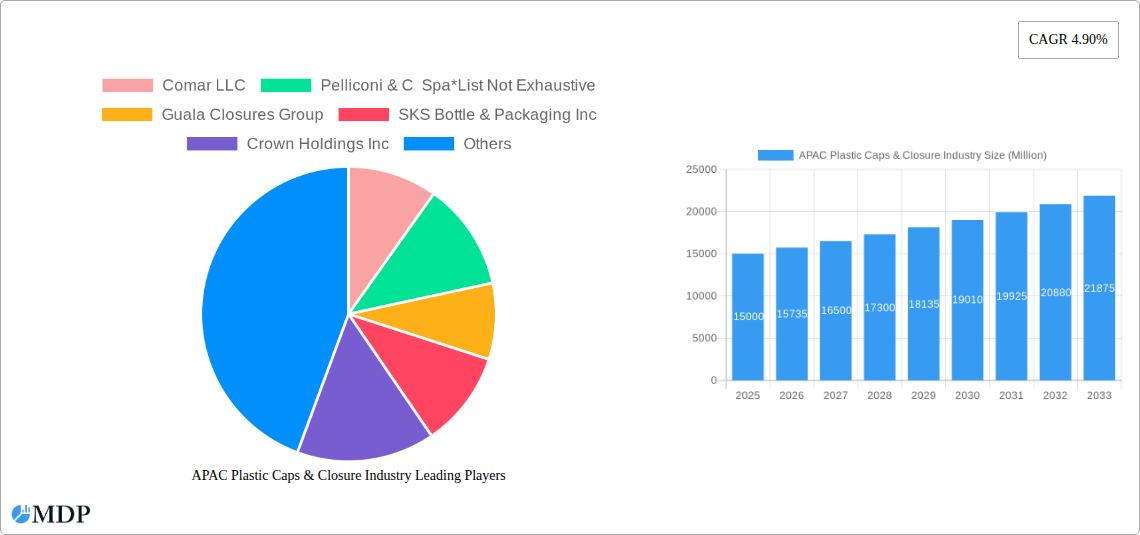
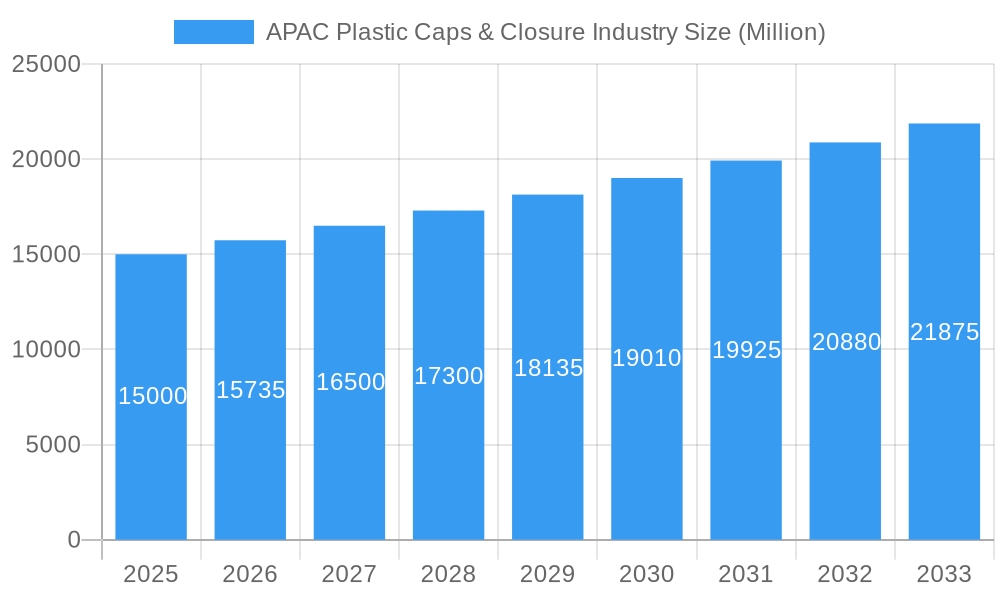
APAC Plastic Caps & Closure Industry Market Size (In Billion)
The forecast period (2025-2033) anticipates sustained market expansion, with varied growth rates across sub-segments and countries. The pharmaceutical and healthcare sector is expected to witness a substantial rise in demand for tamper-evident closures. Similarly, the cosmetics and toiletries industry's emphasis on aesthetically pleasing and functional packaging will continue to drive demand. The "Other Materials" segment is likely to grow due to innovations in specialized and sustainable closure solutions. A nuanced understanding of each segment and country within APAC is essential for effective market penetration. Companies demonstrating a strong grasp of local regulations, consumer trends, and sustainable practices are best positioned to leverage the significant growth opportunities in the APAC plastic caps and closures market.
APAC Plastic Caps & Closure Industry Company Market Share
This comprehensive report offers an in-depth analysis of the Asia-Pacific (APAC) plastic caps and closures industry, detailing market dynamics, prevailing trends, leading manufacturers, and future growth trajectories. The study encompasses the period from 2019 to 2033, with 2025 designated as the base year and 2025-2033 as the forecast period. The report identifies a market size of 85.2 billion. This analysis is indispensable for industry stakeholders, investors, and businesses aiming to understand and capitalize on the opportunities within this dynamic market. All monetary values are presented in Millions.
APAC Plastic Caps & Closure Industry Market Dynamics & Concentration
The APAC plastic caps and closures market exhibits a moderately concentrated landscape, with several major players holding significant market share. The market's dynamism is shaped by several key factors:
- Innovation Drivers: Continuous innovation in materials (e.g., biodegradable plastics, lightweight designs), closure types (e.g., tamper-evident seals, child-resistant caps), and manufacturing processes drives market growth.
- Regulatory Frameworks: Stringent environmental regulations concerning plastic waste and the increasing adoption of sustainability initiatives are impacting material choices and packaging designs. Governments in several APAC countries are implementing policies promoting recyclability and reducing plastic pollution.
- Product Substitutes: The emergence of alternative closure materials, such as metal and paper-based options, presents a challenge to the plastic caps and closures sector, though plastic remains dominant due to cost-effectiveness and versatility.
- End-User Trends: The growth of the beverage, food, and pharmaceutical industries in APAC significantly impacts demand for plastic caps and closures. Changing consumer preferences toward convenience, sustainability, and product safety also influence packaging choices.
- M&A Activities: The market has witnessed significant mergers and acquisitions (M&A) activity. For example, in June 2020, Silgan Holdings Inc. acquired Albea Group's dispensing business for $900 Million, consolidating market share and enhancing product portfolios. The total number of M&A deals in the period 2019-2024 was xx. Market share concentration is estimated at xx% for the top 5 players in 2025.
APAC Plastic Caps & Closure Industry Industry Trends & Analysis
The APAC plastic caps and closures market is experiencing robust growth, driven by several key trends:
The market is projected to exhibit a Compound Annual Growth Rate (CAGR) of xx% during the forecast period (2025-2033). This growth is fueled by rising disposable incomes, increasing urbanization, and a burgeoning middle class, all leading to higher consumption of packaged goods across various sectors. Technological advancements in materials science and manufacturing processes are further enhancing efficiency and product quality. Consumer preference for convenience, tamper-evident packaging, and eco-friendly options significantly influences product design and innovation. Competitive intensity is high, with companies focusing on product differentiation, cost optimization, and supply chain efficiency to maintain a competitive edge. Market penetration of sustainable packaging solutions is growing at xx% annually, reflecting increasing consumer and regulatory pressure.
Leading Markets & Segments in APAC Plastic Caps & Closure Industry
China, India, and Japan are the leading markets in the APAC region, contributing significantly to the overall market size. The Rest of Asia-Pacific also demonstrates promising growth potential.
Key Drivers:
- China: Robust economic growth, a vast population, and expanding manufacturing base.
- India: Rising middle class, increasing consumption, and government initiatives supporting the packaging industry.
- Japan: Mature market with high standards for quality and technology, coupled with a focus on advanced packaging solutions.
- Rest of APAC: Rapid economic development and rising demand for packaged goods in various sectors.
Segment Dominance:
- Material: PET (Polyethylene Terephthalate) holds the largest market share due to its versatility, recyclability, and cost-effectiveness. PP (Polypropylene) and HDPE (High-Density Polyethylene) also represent significant segments. Other materials, including biodegradable plastics, are gaining traction due to sustainability concerns.
- End-user Industry: The beverage industry (bottled water, beer, soft drinks, etc.) dominates the demand for plastic caps and closures, followed by food, pharmaceuticals, and cosmetics. Household chemicals and other industries (automotive cleaners, etc.) also contribute significantly.
APAC Plastic Caps & Closure Industry Product Developments
Recent product innovations focus on lightweighting, improved barrier properties, enhanced tamper evidence, and incorporating sustainable materials. These developments aim to cater to the evolving demands for convenience, sustainability, and product safety. The integration of smart packaging technologies, such as RFID tags, offers traceability and anti-counterfeiting capabilities, further adding value to the products. The market is witnessing increased adoption of recyclable and compostable materials, aligning with global environmental sustainability goals.
Key Drivers of APAC Plastic Caps & Closure Industry Growth
The APAC plastic caps and closures market is propelled by several key growth drivers:
- Growing demand for packaged goods: Rising disposable incomes and changing lifestyles drive consumption across various sectors.
- Technological advancements: Innovations in materials science, manufacturing technologies, and packaging designs enhance product quality and efficiency.
- Favorable regulatory environment (in certain regions): Government support for the packaging industry and initiatives to promote sustainable packaging foster growth. However, this is countered by increasing stringent regulations in other areas impacting material choices and production methods.
Challenges in the APAP Plastic Caps & Closure Industry Market
The APAC plastic caps and closures industry faces several challenges:
- Fluctuating raw material prices: Prices of plastics and other materials can impact profitability.
- Stringent environmental regulations: The increasing pressure to reduce plastic waste and adopt sustainable practices necessitates investment in eco-friendly solutions.
- Intense competition: The market is characterized by numerous players, resulting in competitive pressure on pricing and innovation. Supply chain disruptions also pose ongoing challenges to timely delivery and production. These factors may lead to xx Million in lost revenue annually.
Emerging Opportunities in APAC Plastic Caps & Closure Industry
Several opportunities are driving long-term growth:
The increasing demand for sustainable packaging presents significant opportunities for manufacturers offering eco-friendly solutions. Strategic partnerships and collaborations among players across the value chain can foster innovation and market expansion. Exploring new markets and regions within APAC offers considerable potential for growth. Further technological advancements in materials and manufacturing techniques will further improve efficiency and product quality and enable access to higher-value segments.
Leading Players in the APAC Plastic Caps & Closure Industry Sector
- Comar LLC
- Pelliconi & C Spa
- Guala Closures Group
- SKS Bottle & Packaging Inc
- Crown Holdings Inc
- AptarGroup Inc
- Albea Group
- Coral Products PLC
- Evergreen Packaging Inc
- Nippon closures Co Ltd
- BERICAP GmbH & Co KG
- Tetra Pak International SA
- Berry Global Inc
- O Berk Company LLC
- Silgan Holdings Inc
- Closure Systems International
- MJS Packaging
- Amcor Ltd
Key Milestones in APAC Plastic Caps & Closure Industry Industry
- June 2020: Silgan Holdings Inc. acquired the dispensing business of the Albea Group for $900 Million, significantly altering the market landscape through consolidation.
Strategic Outlook for APAC Plastic Caps & Closure Industry Market
The APAC plastic caps and closures market is poised for continued growth, driven by increasing demand, technological advancements, and strategic initiatives. Companies focusing on sustainability, innovation, and efficient supply chain management are expected to gain a competitive edge. The market presents attractive opportunities for both established players and new entrants seeking to capitalize on the region's dynamic growth trajectory. Expansion into emerging markets within APAC and strategic partnerships to leverage technological advancements are key success factors.
APAC Plastic Caps & Closure Industry Segmentation
-
1. Material
- 1.1. PET
- 1.2. PP
- 1.3. LDPE and HDPE
- 1.4. Other Materials
-
2. End-user Industry
- 2.1. Beverage
- 2.2. Food
- 2.3. Pharmaceutical and Healthcare
- 2.4. Cosmetics and Toiletries
- 2.5. Househol
- 2.6. Other En
APAC Plastic Caps & Closure Industry Segmentation By Geography
-
1. North America
- 1.1. United States
- 1.2. Canada
- 1.3. Mexico
-
2. South America
- 2.1. Brazil
- 2.2. Argentina
- 2.3. Rest of South America
-
3. Europe
- 3.1. United Kingdom
- 3.2. Germany
- 3.3. France
- 3.4. Italy
- 3.5. Spain
- 3.6. Russia
- 3.7. Benelux
- 3.8. Nordics
- 3.9. Rest of Europe
-
4. Middle East & Africa
- 4.1. Turkey
- 4.2. Israel
- 4.3. GCC
- 4.4. North Africa
- 4.5. South Africa
- 4.6. Rest of Middle East & Africa
-
5. Asia Pacific
- 5.1. China
- 5.2. India
- 5.3. Japan
- 5.4. South Korea
- 5.5. ASEAN
- 5.6. Oceania
- 5.7. Rest of Asia Pacific
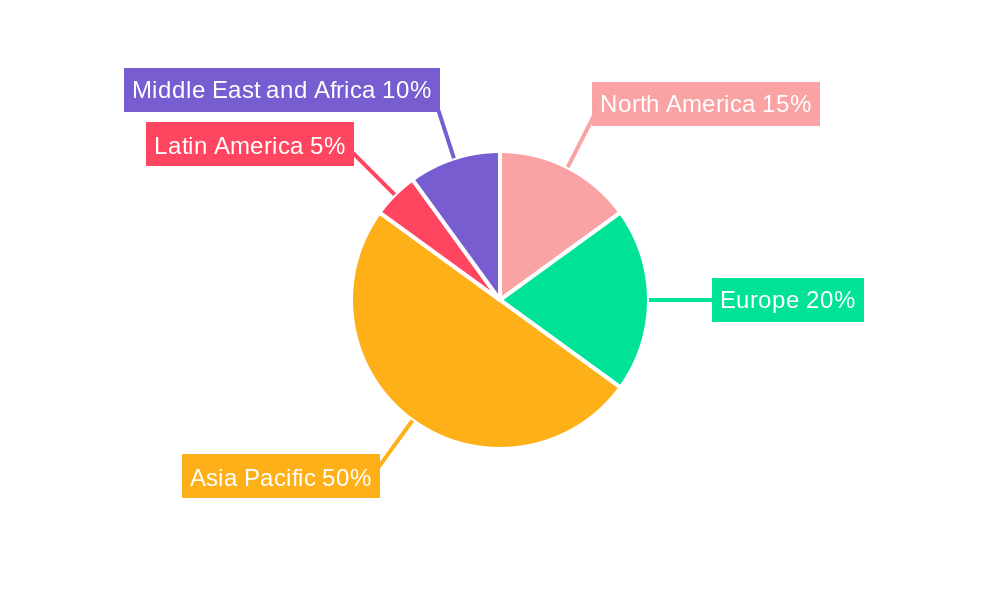
APAC Plastic Caps & Closure Industry Regional Market Share
Geographic Coverage of APAC Plastic Caps & Closure Industry
APAC Plastic Caps & Closure Industry REPORT HIGHLIGHTS
| Aspects | Details |
|---|---|
| Study Period | 2020-2034 |
| Base Year | 2025 |
| Estimated Year | 2026 |
| Forecast Period | 2026-2034 |
| Historical Period | 2020-2025 |
| Growth Rate | CAGR of 5.52% from 2020-2034 |
| Segmentation |
|
Table of Contents
- 1. Introduction
- 1.1. Research Scope
- 1.2. Market Segmentation
- 1.3. Research Objective
- 1.4. Definitions and Assumptions
- 2. Executive Summary
- 2.1. Market Snapshot
- 3. Market Dynamics
- 3.1. Market Drivers
- 3.2. Market Restrains
- 3.3. Market Trends
- 3.4. Market Opportunities
- 4. Market Factor Analysis
- 4.1. Porters Five Forces
- 4.1.1. Bargaining Power of Suppliers
- 4.1.2. Bargaining Power of Buyers
- 4.1.3. Threat of New Entrants
- 4.1.4. Threat of Substitutes
- 4.1.5. Competitive Rivalry
- 4.2. PESTEL analysis
- 4.3. BCG Analysis
- 4.3.1. Stars (High Growth, High Market Share)
- 4.3.2. Cash Cows (Low Growth, High Market Share)
- 4.3.3. Question Mark (High Growth, Low Market Share)
- 4.3.4. Dogs (Low Growth, Low Market Share)
- 4.4. Ansoff Matrix Analysis
- 4.5. Supply Chain Analysis
- 4.6. Regulatory Landscape
- 4.7. Current Market Potential and Opportunity Assessment (TAM–SAM–SOM Framework)
- 4.8. MDP Analyst Note
- 4.1. Porters Five Forces
- 5. Market Analysis, Insights and Forecast 2021-2033
- 5.1. Market Analysis, Insights and Forecast - by Material
- 5.1.1. PET
- 5.1.2. PP
- 5.1.3. LDPE and HDPE
- 5.1.4. Other Materials
- 5.2. Market Analysis, Insights and Forecast - by End-user Industry
- 5.2.1. Beverage
- 5.2.2. Food
- 5.2.3. Pharmaceutical and Healthcare
- 5.2.4. Cosmetics and Toiletries
- 5.2.5. Househol
- 5.2.6. Other En
- 5.3. Market Analysis, Insights and Forecast - by Region
- 5.3.1. North America
- 5.3.2. South America
- 5.3.3. Europe
- 5.3.4. Middle East & Africa
- 5.3.5. Asia Pacific
- 5.1. Market Analysis, Insights and Forecast - by Material
- 6. Global APAC Plastic Caps & Closure Industry Analysis, Insights and Forecast, 2021-2033
- 6.1. Market Analysis, Insights and Forecast - by Material
- 6.1.1. PET
- 6.1.2. PP
- 6.1.3. LDPE and HDPE
- 6.1.4. Other Materials
- 6.2. Market Analysis, Insights and Forecast - by End-user Industry
- 6.2.1. Beverage
- 6.2.2. Food
- 6.2.3. Pharmaceutical and Healthcare
- 6.2.4. Cosmetics and Toiletries
- 6.2.5. Househol
- 6.2.6. Other En
- 6.1. Market Analysis, Insights and Forecast - by Material
- 7. North America APAC Plastic Caps & Closure Industry Analysis, Insights and Forecast, 2020-2032
- 7.1. Market Analysis, Insights and Forecast - by Material
- 7.1.1. PET
- 7.1.2. PP
- 7.1.3. LDPE and HDPE
- 7.1.4. Other Materials
- 7.2. Market Analysis, Insights and Forecast - by End-user Industry
- 7.2.1. Beverage
- 7.2.2. Food
- 7.2.3. Pharmaceutical and Healthcare
- 7.2.4. Cosmetics and Toiletries
- 7.2.5. Househol
- 7.2.6. Other En
- 7.1. Market Analysis, Insights and Forecast - by Material
- 8. South America APAC Plastic Caps & Closure Industry Analysis, Insights and Forecast, 2020-2032
- 8.1. Market Analysis, Insights and Forecast - by Material
- 8.1.1. PET
- 8.1.2. PP
- 8.1.3. LDPE and HDPE
- 8.1.4. Other Materials
- 8.2. Market Analysis, Insights and Forecast - by End-user Industry
- 8.2.1. Beverage
- 8.2.2. Food
- 8.2.3. Pharmaceutical and Healthcare
- 8.2.4. Cosmetics and Toiletries
- 8.2.5. Househol
- 8.2.6. Other En
- 8.1. Market Analysis, Insights and Forecast - by Material
- 9. Europe APAC Plastic Caps & Closure Industry Analysis, Insights and Forecast, 2020-2032
- 9.1. Market Analysis, Insights and Forecast - by Material
- 9.1.1. PET
- 9.1.2. PP
- 9.1.3. LDPE and HDPE
- 9.1.4. Other Materials
- 9.2. Market Analysis, Insights and Forecast - by End-user Industry
- 9.2.1. Beverage
- 9.2.2. Food
- 9.2.3. Pharmaceutical and Healthcare
- 9.2.4. Cosmetics and Toiletries
- 9.2.5. Househol
- 9.2.6. Other En
- 9.1. Market Analysis, Insights and Forecast - by Material
- 10. Middle East & Africa APAC Plastic Caps & Closure Industry Analysis, Insights and Forecast, 2020-2032
- 10.1. Market Analysis, Insights and Forecast - by Material
- 10.1.1. PET
- 10.1.2. PP
- 10.1.3. LDPE and HDPE
- 10.1.4. Other Materials
- 10.2. Market Analysis, Insights and Forecast - by End-user Industry
- 10.2.1. Beverage
- 10.2.2. Food
- 10.2.3. Pharmaceutical and Healthcare
- 10.2.4. Cosmetics and Toiletries
- 10.2.5. Househol
- 10.2.6. Other En
- 10.1. Market Analysis, Insights and Forecast - by Material
- 11. Asia Pacific APAC Plastic Caps & Closure Industry Analysis, Insights and Forecast, 2020-2032
- 11.1. Market Analysis, Insights and Forecast - by Material
- 11.1.1. PET
- 11.1.2. PP
- 11.1.3. LDPE and HDPE
- 11.1.4. Other Materials
- 11.2. Market Analysis, Insights and Forecast - by End-user Industry
- 11.2.1. Beverage
- 11.2.2. Food
- 11.2.3. Pharmaceutical and Healthcare
- 11.2.4. Cosmetics and Toiletries
- 11.2.5. Househol
- 11.2.6. Other En
- 11.1. Market Analysis, Insights and Forecast - by Material
- 12. Competitive Analysis
- 12.1. Company Profiles
- 12.1.1 Comar LLC
- 12.1.1.1. Company Overview
- 12.1.1.2. Products
- 12.1.1.3. Company Financials
- 12.1.1.4. SWOT Analysis
- 12.1.2 Pelliconi & C Spa*List Not Exhaustive
- 12.1.2.1. Company Overview
- 12.1.2.2. Products
- 12.1.2.3. Company Financials
- 12.1.2.4. SWOT Analysis
- 12.1.3 Guala Closures Group
- 12.1.3.1. Company Overview
- 12.1.3.2. Products
- 12.1.3.3. Company Financials
- 12.1.3.4. SWOT Analysis
- 12.1.4 SKS Bottle & Packaging Inc
- 12.1.4.1. Company Overview
- 12.1.4.2. Products
- 12.1.4.3. Company Financials
- 12.1.4.4. SWOT Analysis
- 12.1.5 Crown Holdings Inc
- 12.1.5.1. Company Overview
- 12.1.5.2. Products
- 12.1.5.3. Company Financials
- 12.1.5.4. SWOT Analysis
- 12.1.6 AptarGroup Inc
- 12.1.6.1. Company Overview
- 12.1.6.2. Products
- 12.1.6.3. Company Financials
- 12.1.6.4. SWOT Analysis
- 12.1.7 Albea Group
- 12.1.7.1. Company Overview
- 12.1.7.2. Products
- 12.1.7.3. Company Financials
- 12.1.7.4. SWOT Analysis
- 12.1.8 Coral Products PLC
- 12.1.8.1. Company Overview
- 12.1.8.2. Products
- 12.1.8.3. Company Financials
- 12.1.8.4. SWOT Analysis
- 12.1.9 Evergreen Packaging Inc
- 12.1.9.1. Company Overview
- 12.1.9.2. Products
- 12.1.9.3. Company Financials
- 12.1.9.4. SWOT Analysis
- 12.1.10 Nippon closures Co Ltd
- 12.1.10.1. Company Overview
- 12.1.10.2. Products
- 12.1.10.3. Company Financials
- 12.1.10.4. SWOT Analysis
- 12.1.11 BERICAP GmbH & Co KG
- 12.1.11.1. Company Overview
- 12.1.11.2. Products
- 12.1.11.3. Company Financials
- 12.1.11.4. SWOT Analysis
- 12.1.12 Tetra Pak International SA
- 12.1.12.1. Company Overview
- 12.1.12.2. Products
- 12.1.12.3. Company Financials
- 12.1.12.4. SWOT Analysis
- 12.1.13 Berry Global Inc
- 12.1.13.1. Company Overview
- 12.1.13.2. Products
- 12.1.13.3. Company Financials
- 12.1.13.4. SWOT Analysis
- 12.1.14 O Berk Company LLC
- 12.1.14.1. Company Overview
- 12.1.14.2. Products
- 12.1.14.3. Company Financials
- 12.1.14.4. SWOT Analysis
- 12.1.15 Silgan Holdings Inc
- 12.1.15.1. Company Overview
- 12.1.15.2. Products
- 12.1.15.3. Company Financials
- 12.1.15.4. SWOT Analysis
- 12.1.16 Closure Systems International
- 12.1.16.1. Company Overview
- 12.1.16.2. Products
- 12.1.16.3. Company Financials
- 12.1.16.4. SWOT Analysis
- 12.1.17 MJS Packaging
- 12.1.17.1. Company Overview
- 12.1.17.2. Products
- 12.1.17.3. Company Financials
- 12.1.17.4. SWOT Analysis
- 12.1.18 Amcor Ltd
- 12.1.18.1. Company Overview
- 12.1.18.2. Products
- 12.1.18.3. Company Financials
- 12.1.18.4. SWOT Analysis
- 12.1.1 Comar LLC
- 12.2. Market Entropy
- 12.2.1 Company's Key Areas Served
- 12.2.2 Recent Developments
- 12.3. Company Market Share Analysis 2025
- 12.3.1 Top 5 Companies Market Share Analysis
- 12.3.2 Top 3 Companies Market Share Analysis
- 12.4. List of Potential Customers
- 13. Research Methodology
List of Figures
- Figure 1: Global APAC Plastic Caps & Closure Industry Revenue Breakdown (billion, %) by Region 2025 & 2033
- Figure 2: North America APAC Plastic Caps & Closure Industry Revenue (billion), by Material 2025 & 2033
- Figure 3: North America APAC Plastic Caps & Closure Industry Revenue Share (%), by Material 2025 & 2033
- Figure 4: North America APAC Plastic Caps & Closure Industry Revenue (billion), by End-user Industry 2025 & 2033
- Figure 5: North America APAC Plastic Caps & Closure Industry Revenue Share (%), by End-user Industry 2025 & 2033
- Figure 6: North America APAC Plastic Caps & Closure Industry Revenue (billion), by Country 2025 & 2033
- Figure 7: North America APAC Plastic Caps & Closure Industry Revenue Share (%), by Country 2025 & 2033
- Figure 8: South America APAC Plastic Caps & Closure Industry Revenue (billion), by Material 2025 & 2033
- Figure 9: South America APAC Plastic Caps & Closure Industry Revenue Share (%), by Material 2025 & 2033
- Figure 10: South America APAC Plastic Caps & Closure Industry Revenue (billion), by End-user Industry 2025 & 2033
- Figure 11: South America APAC Plastic Caps & Closure Industry Revenue Share (%), by End-user Industry 2025 & 2033
- Figure 12: South America APAC Plastic Caps & Closure Industry Revenue (billion), by Country 2025 & 2033
- Figure 13: South America APAC Plastic Caps & Closure Industry Revenue Share (%), by Country 2025 & 2033
- Figure 14: Europe APAC Plastic Caps & Closure Industry Revenue (billion), by Material 2025 & 2033
- Figure 15: Europe APAC Plastic Caps & Closure Industry Revenue Share (%), by Material 2025 & 2033
- Figure 16: Europe APAC Plastic Caps & Closure Industry Revenue (billion), by End-user Industry 2025 & 2033
- Figure 17: Europe APAC Plastic Caps & Closure Industry Revenue Share (%), by End-user Industry 2025 & 2033
- Figure 18: Europe APAC Plastic Caps & Closure Industry Revenue (billion), by Country 2025 & 2033
- Figure 19: Europe APAC Plastic Caps & Closure Industry Revenue Share (%), by Country 2025 & 2033
- Figure 20: Middle East & Africa APAC Plastic Caps & Closure Industry Revenue (billion), by Material 2025 & 2033
- Figure 21: Middle East & Africa APAC Plastic Caps & Closure Industry Revenue Share (%), by Material 2025 & 2033
- Figure 22: Middle East & Africa APAC Plastic Caps & Closure Industry Revenue (billion), by End-user Industry 2025 & 2033
- Figure 23: Middle East & Africa APAC Plastic Caps & Closure Industry Revenue Share (%), by End-user Industry 2025 & 2033
- Figure 24: Middle East & Africa APAC Plastic Caps & Closure Industry Revenue (billion), by Country 2025 & 2033
- Figure 25: Middle East & Africa APAC Plastic Caps & Closure Industry Revenue Share (%), by Country 2025 & 2033
- Figure 26: Asia Pacific APAC Plastic Caps & Closure Industry Revenue (billion), by Material 2025 & 2033
- Figure 27: Asia Pacific APAC Plastic Caps & Closure Industry Revenue Share (%), by Material 2025 & 2033
- Figure 28: Asia Pacific APAC Plastic Caps & Closure Industry Revenue (billion), by End-user Industry 2025 & 2033
- Figure 29: Asia Pacific APAC Plastic Caps & Closure Industry Revenue Share (%), by End-user Industry 2025 & 2033
- Figure 30: Asia Pacific APAC Plastic Caps & Closure Industry Revenue (billion), by Country 2025 & 2033
- Figure 31: Asia Pacific APAC Plastic Caps & Closure Industry Revenue Share (%), by Country 2025 & 2033
List of Tables
- Table 1: Global APAC Plastic Caps & Closure Industry Revenue billion Forecast, by Material 2020 & 2033
- Table 2: Global APAC Plastic Caps & Closure Industry Revenue billion Forecast, by End-user Industry 2020 & 2033
- Table 3: Global APAC Plastic Caps & Closure Industry Revenue billion Forecast, by Region 2020 & 2033
- Table 4: Global APAC Plastic Caps & Closure Industry Revenue billion Forecast, by Material 2020 & 2033
- Table 5: Global APAC Plastic Caps & Closure Industry Revenue billion Forecast, by End-user Industry 2020 & 2033
- Table 6: Global APAC Plastic Caps & Closure Industry Revenue billion Forecast, by Country 2020 & 2033
- Table 7: United States APAC Plastic Caps & Closure Industry Revenue (billion) Forecast, by Application 2020 & 2033
- Table 8: Canada APAC Plastic Caps & Closure Industry Revenue (billion) Forecast, by Application 2020 & 2033
- Table 9: Mexico APAC Plastic Caps & Closure Industry Revenue (billion) Forecast, by Application 2020 & 2033
- Table 10: Global APAC Plastic Caps & Closure Industry Revenue billion Forecast, by Material 2020 & 2033
- Table 11: Global APAC Plastic Caps & Closure Industry Revenue billion Forecast, by End-user Industry 2020 & 2033
- Table 12: Global APAC Plastic Caps & Closure Industry Revenue billion Forecast, by Country 2020 & 2033
- Table 13: Brazil APAC Plastic Caps & Closure Industry Revenue (billion) Forecast, by Application 2020 & 2033
- Table 14: Argentina APAC Plastic Caps & Closure Industry Revenue (billion) Forecast, by Application 2020 & 2033
- Table 15: Rest of South America APAC Plastic Caps & Closure Industry Revenue (billion) Forecast, by Application 2020 & 2033
- Table 16: Global APAC Plastic Caps & Closure Industry Revenue billion Forecast, by Material 2020 & 2033
- Table 17: Global APAC Plastic Caps & Closure Industry Revenue billion Forecast, by End-user Industry 2020 & 2033
- Table 18: Global APAC Plastic Caps & Closure Industry Revenue billion Forecast, by Country 2020 & 2033
- Table 19: United Kingdom APAC Plastic Caps & Closure Industry Revenue (billion) Forecast, by Application 2020 & 2033
- Table 20: Germany APAC Plastic Caps & Closure Industry Revenue (billion) Forecast, by Application 2020 & 2033
- Table 21: France APAC Plastic Caps & Closure Industry Revenue (billion) Forecast, by Application 2020 & 2033
- Table 22: Italy APAC Plastic Caps & Closure Industry Revenue (billion) Forecast, by Application 2020 & 2033
- Table 23: Spain APAC Plastic Caps & Closure Industry Revenue (billion) Forecast, by Application 2020 & 2033
- Table 24: Russia APAC Plastic Caps & Closure Industry Revenue (billion) Forecast, by Application 2020 & 2033
- Table 25: Benelux APAC Plastic Caps & Closure Industry Revenue (billion) Forecast, by Application 2020 & 2033
- Table 26: Nordics APAC Plastic Caps & Closure Industry Revenue (billion) Forecast, by Application 2020 & 2033
- Table 27: Rest of Europe APAC Plastic Caps & Closure Industry Revenue (billion) Forecast, by Application 2020 & 2033
- Table 28: Global APAC Plastic Caps & Closure Industry Revenue billion Forecast, by Material 2020 & 2033
- Table 29: Global APAC Plastic Caps & Closure Industry Revenue billion Forecast, by End-user Industry 2020 & 2033
- Table 30: Global APAC Plastic Caps & Closure Industry Revenue billion Forecast, by Country 2020 & 2033
- Table 31: Turkey APAC Plastic Caps & Closure Industry Revenue (billion) Forecast, by Application 2020 & 2033
- Table 32: Israel APAC Plastic Caps & Closure Industry Revenue (billion) Forecast, by Application 2020 & 2033
- Table 33: GCC APAC Plastic Caps & Closure Industry Revenue (billion) Forecast, by Application 2020 & 2033
- Table 34: North Africa APAC Plastic Caps & Closure Industry Revenue (billion) Forecast, by Application 2020 & 2033
- Table 35: South Africa APAC Plastic Caps & Closure Industry Revenue (billion) Forecast, by Application 2020 & 2033
- Table 36: Rest of Middle East & Africa APAC Plastic Caps & Closure Industry Revenue (billion) Forecast, by Application 2020 & 2033
- Table 37: Global APAC Plastic Caps & Closure Industry Revenue billion Forecast, by Material 2020 & 2033
- Table 38: Global APAC Plastic Caps & Closure Industry Revenue billion Forecast, by End-user Industry 2020 & 2033
- Table 39: Global APAC Plastic Caps & Closure Industry Revenue billion Forecast, by Country 2020 & 2033
- Table 40: China APAC Plastic Caps & Closure Industry Revenue (billion) Forecast, by Application 2020 & 2033
- Table 41: India APAC Plastic Caps & Closure Industry Revenue (billion) Forecast, by Application 2020 & 2033
- Table 42: Japan APAC Plastic Caps & Closure Industry Revenue (billion) Forecast, by Application 2020 & 2033
- Table 43: South Korea APAC Plastic Caps & Closure Industry Revenue (billion) Forecast, by Application 2020 & 2033
- Table 44: ASEAN APAC Plastic Caps & Closure Industry Revenue (billion) Forecast, by Application 2020 & 2033
- Table 45: Oceania APAC Plastic Caps & Closure Industry Revenue (billion) Forecast, by Application 2020 & 2033
- Table 46: Rest of Asia Pacific APAC Plastic Caps & Closure Industry Revenue (billion) Forecast, by Application 2020 & 2033
Frequently Asked Questions
1. What is the projected Compound Annual Growth Rate (CAGR) of the APAC Plastic Caps & Closure Industry?
The projected CAGR is approximately 5.52%.
2. Which companies are prominent players in the APAC Plastic Caps & Closure Industry?
Key companies in the market include Comar LLC, Pelliconi & C Spa*List Not Exhaustive, Guala Closures Group, SKS Bottle & Packaging Inc, Crown Holdings Inc, AptarGroup Inc, Albea Group, Coral Products PLC, Evergreen Packaging Inc, Nippon closures Co Ltd, BERICAP GmbH & Co KG, Tetra Pak International SA, Berry Global Inc, O Berk Company LLC, Silgan Holdings Inc, Closure Systems International, MJS Packaging, Amcor Ltd.
3. What are the main segments of the APAC Plastic Caps & Closure Industry?
The market segments include Material, End-user Industry.
4. Can you provide details about the market size?
The market size is estimated to be USD 85.2 billion as of 2022.
5. What are some drivers contributing to market growth?
Growing Consumption of Single Serve Beverages; Advent of Innovative Products.
6. What are the notable trends driving market growth?
PET is Expected to Witness Significant Growth.
7. Are there any restraints impacting market growth?
Regulations on Usage of Pet Bottles/Caps in Pharmaceutical Drugs and Food Packaging.
8. Can you provide examples of recent developments in the market?
June 2020 - Silgan Holdings Inc., a leading supplier of sustainable rigid packaging solutions for consumer goods products, acquired the dispensing business of the Albea Group for $900 million.
9. What pricing options are available for accessing the report?
Pricing options include single-user, multi-user, and enterprise licenses priced at USD 4750, USD 4950, and USD 6800 respectively.
10. Is the market size provided in terms of value or volume?
The market size is provided in terms of value, measured in billion.
11. Are there any specific market keywords associated with the report?
Yes, the market keyword associated with the report is "APAC Plastic Caps & Closure Industry," which aids in identifying and referencing the specific market segment covered.
12. How do I determine which pricing option suits my needs best?
The pricing options vary based on user requirements and access needs. Individual users may opt for single-user licenses, while businesses requiring broader access may choose multi-user or enterprise licenses for cost-effective access to the report.
13. Are there any additional resources or data provided in the APAC Plastic Caps & Closure Industry report?
While the report offers comprehensive insights, it's advisable to review the specific contents or supplementary materials provided to ascertain if additional resources or data are available.
14. How can I stay updated on further developments or reports in the APAC Plastic Caps & Closure Industry?
To stay informed about further developments, trends, and reports in the APAC Plastic Caps & Closure Industry, consider subscribing to industry newsletters, following relevant companies and organizations, or regularly checking reputable industry news sources and publications.
Methodology
Step 1 - Identification of Relevant Samples Size from Population Database


Step 2 - Approaches for Defining Global Market Size (Value, Volume* & Price*)

Note*: In applicable scenarios
Step 3 - Data Sources
Primary Research
- Web Analytics
- Survey Reports
- Research Institute
- Latest Research Reports
- Opinion Leaders
Secondary Research
- Annual Reports
- White Paper
- Latest Press Release
- Industry Association
- Paid Database
- Investor Presentations

Step 4 - Data Triangulation
Involves using different sources of information in order to increase the validity of a study
These sources are likely to be stakeholders in a program - participants, other researchers, program staff, other community members, and so on.
Then we put all data in single framework & apply various statistical tools to find out the dynamic on the market.
During the analysis stage, feedback from the stakeholder groups would be compared to determine areas of agreement as well as areas of divergence