

Key Insights
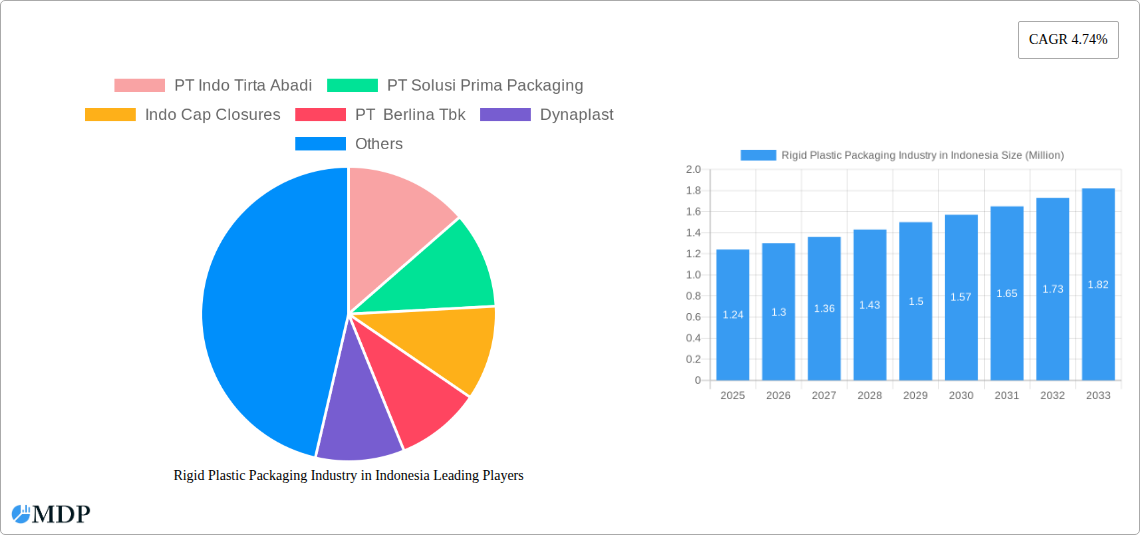
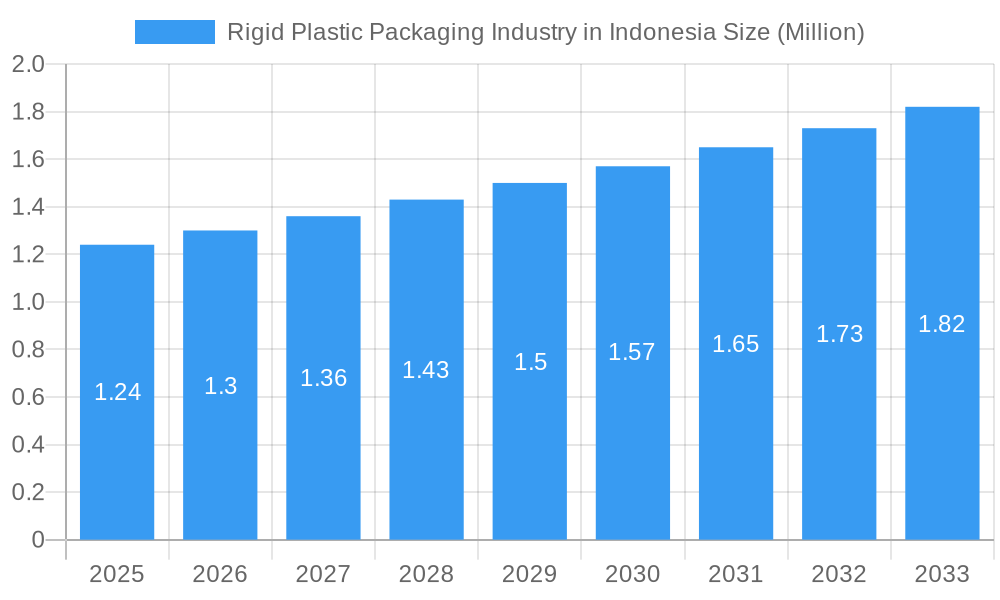
The Indonesian rigid plastic packaging market is forecast to reach USD 1.24 million by 2025, exhibiting a compound annual growth rate (CAGR) of 4.98%. This expansion is driven by increasing consumer demand in the food & beverage, healthcare, and personal care sectors. Growing urbanization and a rising middle class in Indonesia are boosting consumption of packaged goods, including bottles, jars, trays, containers, and caps & closures. Innovations in resin technology, offering more sustainable and functional solutions, are also expected to fuel market growth. Polyethylene (PE) and Polypropylene (PP) remain the dominant resin types due to their versatility and cost-effectiveness.
Rigid Plastic Packaging Industry in Indonesia Market Size (In Million)
Environmental concerns and stringent plastic waste management regulations pose challenges to market growth. This necessitates investment in recycling infrastructure, development of biodegradable alternatives, and promotion of a circular economy for plastic packaging. The industry is actively addressing these issues through innovative packaging designs and material science. The adoption of rigid plastic packaging in industrial applications and construction, in addition to its core use in food, beverage, and healthcare, highlights its adaptability. Key players such as Amcor PLC and Dynaplast are shaping the market through strategic investments and product development.
Rigid Plastic Packaging Industry in Indonesia Company Market Share
Gain comprehensive insights into the Indonesian rigid plastic packaging market with our in-depth report. Covering the period 2019 to 2033, the analysis includes historical data from 2019–2024, a base year of 2025, and a detailed forecast period of 2025–2033. Discover key market drivers, emerging trends, leading players, and future opportunities.
Rigid Plastic Packaging Industry in Indonesia Market Dynamics & Concentration
The Indonesian rigid plastic packaging market exhibits moderate concentration, with a blend of large multinational corporations and a significant number of domestic players vying for market share. Innovation drivers are primarily fueled by the escalating demand for convenient, sustainable, and cost-effective packaging solutions across diverse end-use industries. Regulatory frameworks are evolving, with a growing emphasis on environmental sustainability and waste management, influencing material choices and product designs. Product substitutes, such as flexible packaging and alternative materials like glass and paper, pose a competitive threat, necessitating continuous innovation in performance and cost-effectiveness. End-user trends are strongly dictated by the burgeoning middle class, urbanization, and the increasing sophistication of consumer preferences, driving demand for high-quality, visually appealing, and functional rigid plastic packaging. Merger and acquisition (M&A) activities are anticipated to increase as companies seek to expand their product portfolios, geographic reach, and technological capabilities. Market share is dynamically distributed, with key players holding varying percentages across different product segments and resin types. M&A deal counts are expected to rise, reflecting consolidation strategies and the pursuit of synergistic growth.
Rigid Plastic Packaging Industry in Indonesia Industry Trends & Analysis
The Indonesian rigid plastic packaging industry is poised for robust growth, projected to achieve a Compound Annual Growth Rate (CAGR) of approximately 6.5% from 2025 to 2033. This expansion is primarily propelled by the escalating demand for convenient and durable packaging solutions across a multitude of sectors, with the food and beverage industry representing the largest market segment. Technological disruptions are playing a pivotal role, with advancements in material science leading to the development of lighter, stronger, and more sustainable rigid plastic packaging. This includes the increasing adoption of recycled content and the development of biodegradable and compostable alternatives, catering to growing consumer awareness and regulatory pressures. Consumer preferences are shifting towards packaging that offers enhanced functionality, such as reclosability, tamper-evidence, and improved shelf appeal, alongside a strong inclination for sustainable options. The competitive dynamics are characterized by intense price competition, a focus on product differentiation, and strategic alliances aimed at enhancing market penetration and expanding product offerings. Market penetration for rigid plastic packaging in Indonesia remains high, driven by its cost-effectiveness, versatility, and widespread availability, making it the preferred choice for a vast array of products.
Leading Markets & Segments in Rigid Plastic Packaging Industry in Indonesia
The Food end-use industry stands as the dominant segment within the Indonesian rigid plastic packaging market, driven by the nation's large population and growing consumption of packaged food products. Within this segment, Bottles and Jars are the most significant product types, largely due to their extensive use in packaging beverages, sauces, and condiments. Polyethylene (PE), particularly High-Density Polyethylene (HDPE), dominates the resin type landscape, owing to its excellent barrier properties, durability, and cost-effectiveness, making it ideal for a wide range of applications.
Dominant Resin Type Drivers:
- Economic Policies: Government support for local manufacturing and investment in petrochemical infrastructure boosts the availability and affordability of PE resins.
- Infrastructure Development: Enhanced logistics and distribution networks facilitate the widespread use of PE-based packaging across the archipelago.
- Consumer Demand: The continuous demand for affordable and durable food and beverage packaging directly fuels PE resin consumption.
Dominant Product Type Drivers:
- Urbanization: The increasing urban population drives the demand for convenient, single-serving, and easily transportable packaged goods, favoring bottles and jars.
- Food Safety Standards: The need for secure and hygienic packaging for food products amplifies the demand for robust bottles and jars.
- E-commerce Growth: The rise of e-commerce necessitates sturdy packaging for shipping, further bolstering the market for bottles and jars.
Dominant End-Use Industry Drivers:
- Population Growth: Indonesia's substantial and growing population represents a massive consumer base for food products, directly impacting packaging demand.
- Rising Disposable Incomes: As incomes rise, consumers are increasingly purchasing processed and packaged foods, contributing to higher demand for rigid plastic packaging.
- Retail Modernization: The expansion of modern retail formats like supermarkets and hypermarkets creates a greater need for attractively packaged products, favoring rigid plastic solutions.
Rigid Plastic Packaging Industry in Indonesia Product Developments
Recent product developments in the Indonesian rigid plastic packaging sector are heavily influenced by sustainability initiatives and enhanced functionality. Innovations focus on lightweighting, the incorporation of recycled content, and the development of mono-material solutions for improved recyclability. For instance, advancements in barrier technologies allow for extended shelf life in food packaging, while design improvements enhance user convenience and product protection. Companies are also exploring bio-based and biodegradable plastics to meet growing environmental consciousness. The competitive advantage lies in offering packaging solutions that not only meet stringent performance requirements but also align with eco-friendly principles and evolving consumer expectations.
Key Drivers of Rigid Plastic Packaging Industry in Indonesia Growth
The growth of the rigid plastic packaging industry in Indonesia is propelled by several key factors. A rapidly expanding middle class with increasing disposable income fuels higher consumer spending on packaged goods. The burgeoning food and beverage sector, driven by domestic consumption and export opportunities, creates sustained demand for diverse packaging solutions. Furthermore, government initiatives promoting domestic manufacturing and investment in infrastructure development enhance the operational efficiency and market reach of packaging companies. Technological advancements in material science and processing technologies enable the production of more sustainable, functional, and cost-effective packaging, further driving market expansion.
Challenges in the Rigid Plastic Packaging Industry in Indonesia Market
Despite its growth, the Indonesian rigid plastic packaging market faces several challenges. Fluctuations in raw material prices, particularly for crude oil derivatives, can impact production costs and profitability. Environmental concerns and increasing consumer demand for sustainable alternatives necessitate significant investment in recycling infrastructure and the development of eco-friendly packaging solutions. Regulatory hurdles related to waste management and plastic pollution can also pose challenges, requiring companies to adapt their strategies and product offerings. Intense competition, both from domestic and international players, puts pressure on profit margins, demanding continuous innovation and operational efficiency.
Emerging Opportunities in Rigid Plastic Packaging Industry in Indonesia
Emerging opportunities within the Indonesian rigid plastic packaging industry are significant. The growing demand for sustainable packaging presents a substantial avenue for growth, with companies focusing on recycled content, biodegradable materials, and circular economy models. E-commerce expansion drives demand for robust and secure packaging solutions, creating opportunities for specialized rigid packaging designs. Furthermore, the increasing adoption of automation and digitalization in manufacturing processes offers potential for improved efficiency and cost reduction. Strategic partnerships and collaborations, both domestically and internationally, can facilitate technology transfer and market access, further accelerating growth.
Leading Players in the Rigid Plastic Packaging Industry in Indonesia Sector
- PT Indo Tirta Abadi
- PT Solusi Prima Packaging
- Indo Cap Closures
- PT Berlina Tbk
- Dynaplast
- PT Hasil Raya Industries
- Amcor PLC
Key Milestones in Rigid Plastic Packaging Industry in Indonesia Industry
- April 2022: Mondi launched a sustainable packaging solution for the food industry. Mono Formable PP is a semi-rigid plastic tray created from mono-material polypropylene (PP) that features a printed top web and a thermoformable semi-rigid bottom web. The packaging weighs 30% less than a comparable polyester (PET) tray and has features like easy-peel for convenient opening and reclosure.
- March 2022: Berry Global Group partnered with Koa to launch and introduce bottles for body moisturizers and cleaners composed of recycled plastic. Berry is an industry pioneer in sustainability and Koa shares. Berry's commitment to making a positive difference for the environment through streamlined business practices, consistently engaged partners, and improved goods. Koa chose Berry as their supplier for this project because of their shared commitment to environmentally friendly packaging.
Strategic Outlook for Rigid Plastic Packaging Industry in Indonesia Market
The strategic outlook for the rigid plastic packaging industry in Indonesia is highly positive, driven by a confluence of favorable economic and demographic trends. The continued expansion of the food and beverage, healthcare, and personal care sectors will sustain robust demand. Companies are strategically focusing on innovation in sustainable packaging solutions, including the increased use of recycled materials and the development of mono-material packaging for enhanced recyclability. Investments in advanced manufacturing technologies and automation will be crucial for maintaining competitiveness and operational efficiency. Strategic partnerships and collaborations will play a vital role in expanding market reach, accessing new technologies, and addressing regulatory challenges, positioning the industry for sustained and inclusive growth in the coming years.
Rigid Plastic Packaging Industry in Indonesia Segmentation
-
1. Resin Type
-
1.1. Polyethylene (PE)
- 1.1.1. Low-Dens
- 1.1.2. High Density Polyethylene (HDPE)
- 1.2. Polyethylene terephthalate (PET)
- 1.3. Polypropylene (PP)
- 1.4. Polystyrene (PS) and Expanded polystyrene (EPS)
- 1.5. Polyvinyl chloride (PVC)
- 1.6. Other Resin Types
-
1.1. Polyethylene (PE)
-
2. Product Type
- 2.1. Bottles and Jars
- 2.2. Trays and Containers
- 2.3. Caps and Closures
- 2.4. Intermediate Bulk Containers (IBCs)
- 2.5. Drums
- 2.6. Pallets
- 2.7. Other Product Types
-
3. End-use Industries
-
3.1. Food
- 3.1.1. Candy & Confectionery
- 3.1.2. Frozen Foods
- 3.1.3. Fresh Produce
- 3.1.4. Dairy Products
- 3.1.5. Dry Foods
- 3.1.6. Meat, Poultry, And Seafood
- 3.1.7. Pet Food
- 3.1.8. Other Food Products
- 3.2. Foodservice
- 3.3. Beverage
- 3.4. Healthcare
- 3.5. Cosmetics and Personal Care
- 3.6. Industrial
- 3.7. Building and Construction
- 3.8. Automotive
- 3.9. Other End User Industries
-
3.1. Food
Rigid Plastic Packaging Industry in Indonesia Segmentation By Geography
-
1. North America
- 1.1. United States
- 1.2. Canada
- 1.3. Mexico
-
2. South America
- 2.1. Brazil
- 2.2. Argentina
- 2.3. Rest of South America
-
3. Europe
- 3.1. United Kingdom
- 3.2. Germany
- 3.3. France
- 3.4. Italy
- 3.5. Spain
- 3.6. Russia
- 3.7. Benelux
- 3.8. Nordics
- 3.9. Rest of Europe
-
4. Middle East & Africa
- 4.1. Turkey
- 4.2. Israel
- 4.3. GCC
- 4.4. North Africa
- 4.5. South Africa
- 4.6. Rest of Middle East & Africa
-
5. Asia Pacific
- 5.1. China
- 5.2. India
- 5.3. Japan
- 5.4. South Korea
- 5.5. ASEAN
- 5.6. Oceania
- 5.7. Rest of Asia Pacific
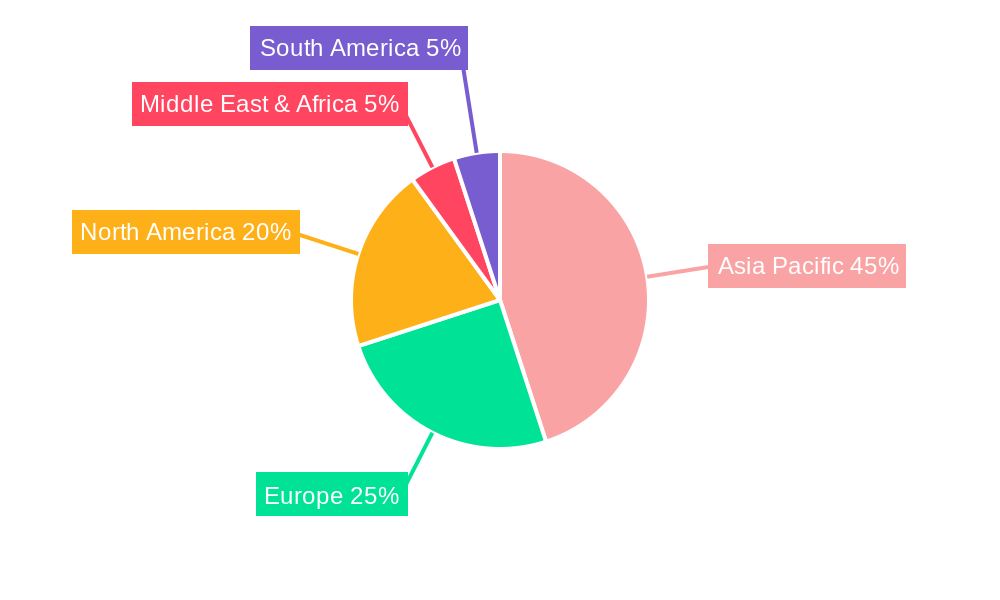
Rigid Plastic Packaging Industry in Indonesia Regional Market Share
Geographic Coverage of Rigid Plastic Packaging Industry in Indonesia
Rigid Plastic Packaging Industry in Indonesia REPORT HIGHLIGHTS
| Aspects | Details |
|---|---|
| Study Period | 2020-2034 |
| Base Year | 2025 |
| Estimated Year | 2026 |
| Forecast Period | 2026-2034 |
| Historical Period | 2020-2025 |
| Growth Rate | CAGR of 4.98% from 2020-2034 |
| Segmentation |
|
Table of Contents
- 1. Introduction
- 1.1. Research Scope
- 1.2. Market Segmentation
- 1.3. Research Objective
- 1.4. Definitions and Assumptions
- 2. Executive Summary
- 2.1. Market Snapshot
- 3. Market Dynamics
- 3.1. Market Drivers
- 3.2. Market Restrains
- 3.3. Market Trends
- 3.4. Market Opportunities
- 4. Market Factor Analysis
- 4.1. Porters Five Forces
- 4.1.1. Bargaining Power of Suppliers
- 4.1.2. Bargaining Power of Buyers
- 4.1.3. Threat of New Entrants
- 4.1.4. Threat of Substitutes
- 4.1.5. Competitive Rivalry
- 4.2. PESTEL analysis
- 4.3. BCG Analysis
- 4.3.1. Stars (High Growth, High Market Share)
- 4.3.2. Cash Cows (Low Growth, High Market Share)
- 4.3.3. Question Mark (High Growth, Low Market Share)
- 4.3.4. Dogs (Low Growth, Low Market Share)
- 4.4. Ansoff Matrix Analysis
- 4.5. Supply Chain Analysis
- 4.6. Regulatory Landscape
- 4.7. Current Market Potential and Opportunity Assessment (TAM–SAM–SOM Framework)
- 4.8. MDP Analyst Note
- 4.1. Porters Five Forces
- 5. Market Analysis, Insights and Forecast 2021-2033
- 5.1. Market Analysis, Insights and Forecast - by Resin Type
- 5.1.1. Polyethylene (PE)
- 5.1.1.1. Low-Dens
- 5.1.1.2. High Density Polyethylene (HDPE)
- 5.1.2. Polyethylene terephthalate (PET)
- 5.1.3. Polypropylene (PP)
- 5.1.4. Polystyrene (PS) and Expanded polystyrene (EPS)
- 5.1.5. Polyvinyl chloride (PVC)
- 5.1.6. Other Resin Types
- 5.1.1. Polyethylene (PE)
- 5.2. Market Analysis, Insights and Forecast - by Product Type
- 5.2.1. Bottles and Jars
- 5.2.2. Trays and Containers
- 5.2.3. Caps and Closures
- 5.2.4. Intermediate Bulk Containers (IBCs)
- 5.2.5. Drums
- 5.2.6. Pallets
- 5.2.7. Other Product Types
- 5.3. Market Analysis, Insights and Forecast - by End-use Industries
- 5.3.1. Food
- 5.3.1.1. Candy & Confectionery
- 5.3.1.2. Frozen Foods
- 5.3.1.3. Fresh Produce
- 5.3.1.4. Dairy Products
- 5.3.1.5. Dry Foods
- 5.3.1.6. Meat, Poultry, And Seafood
- 5.3.1.7. Pet Food
- 5.3.1.8. Other Food Products
- 5.3.2. Foodservice
- 5.3.3. Beverage
- 5.3.4. Healthcare
- 5.3.5. Cosmetics and Personal Care
- 5.3.6. Industrial
- 5.3.7. Building and Construction
- 5.3.8. Automotive
- 5.3.9. Other End User Industries
- 5.3.1. Food
- 5.4. Market Analysis, Insights and Forecast - by Region
- 5.4.1. North America
- 5.4.2. South America
- 5.4.3. Europe
- 5.4.4. Middle East & Africa
- 5.4.5. Asia Pacific
- 5.1. Market Analysis, Insights and Forecast - by Resin Type
- 6. Global Rigid Plastic Packaging Industry in Indonesia Analysis, Insights and Forecast, 2021-2033
- 6.1. Market Analysis, Insights and Forecast - by Resin Type
- 6.1.1. Polyethylene (PE)
- 6.1.1.1. Low-Dens
- 6.1.1.2. High Density Polyethylene (HDPE)
- 6.1.2. Polyethylene terephthalate (PET)
- 6.1.3. Polypropylene (PP)
- 6.1.4. Polystyrene (PS) and Expanded polystyrene (EPS)
- 6.1.5. Polyvinyl chloride (PVC)
- 6.1.6. Other Resin Types
- 6.1.1. Polyethylene (PE)
- 6.2. Market Analysis, Insights and Forecast - by Product Type
- 6.2.1. Bottles and Jars
- 6.2.2. Trays and Containers
- 6.2.3. Caps and Closures
- 6.2.4. Intermediate Bulk Containers (IBCs)
- 6.2.5. Drums
- 6.2.6. Pallets
- 6.2.7. Other Product Types
- 6.3. Market Analysis, Insights and Forecast - by End-use Industries
- 6.3.1. Food
- 6.3.1.1. Candy & Confectionery
- 6.3.1.2. Frozen Foods
- 6.3.1.3. Fresh Produce
- 6.3.1.4. Dairy Products
- 6.3.1.5. Dry Foods
- 6.3.1.6. Meat, Poultry, And Seafood
- 6.3.1.7. Pet Food
- 6.3.1.8. Other Food Products
- 6.3.2. Foodservice
- 6.3.3. Beverage
- 6.3.4. Healthcare
- 6.3.5. Cosmetics and Personal Care
- 6.3.6. Industrial
- 6.3.7. Building and Construction
- 6.3.8. Automotive
- 6.3.9. Other End User Industries
- 6.3.1. Food
- 6.1. Market Analysis, Insights and Forecast - by Resin Type
- 7. North America Rigid Plastic Packaging Industry in Indonesia Analysis, Insights and Forecast, 2020-2032
- 7.1. Market Analysis, Insights and Forecast - by Resin Type
- 7.1.1. Polyethylene (PE)
- 7.1.1.1. Low-Dens
- 7.1.1.2. High Density Polyethylene (HDPE)
- 7.1.2. Polyethylene terephthalate (PET)
- 7.1.3. Polypropylene (PP)
- 7.1.4. Polystyrene (PS) and Expanded polystyrene (EPS)
- 7.1.5. Polyvinyl chloride (PVC)
- 7.1.6. Other Resin Types
- 7.1.1. Polyethylene (PE)
- 7.2. Market Analysis, Insights and Forecast - by Product Type
- 7.2.1. Bottles and Jars
- 7.2.2. Trays and Containers
- 7.2.3. Caps and Closures
- 7.2.4. Intermediate Bulk Containers (IBCs)
- 7.2.5. Drums
- 7.2.6. Pallets
- 7.2.7. Other Product Types
- 7.3. Market Analysis, Insights and Forecast - by End-use Industries
- 7.3.1. Food
- 7.3.1.1. Candy & Confectionery
- 7.3.1.2. Frozen Foods
- 7.3.1.3. Fresh Produce
- 7.3.1.4. Dairy Products
- 7.3.1.5. Dry Foods
- 7.3.1.6. Meat, Poultry, And Seafood
- 7.3.1.7. Pet Food
- 7.3.1.8. Other Food Products
- 7.3.2. Foodservice
- 7.3.3. Beverage
- 7.3.4. Healthcare
- 7.3.5. Cosmetics and Personal Care
- 7.3.6. Industrial
- 7.3.7. Building and Construction
- 7.3.8. Automotive
- 7.3.9. Other End User Industries
- 7.3.1. Food
- 7.1. Market Analysis, Insights and Forecast - by Resin Type
- 8. South America Rigid Plastic Packaging Industry in Indonesia Analysis, Insights and Forecast, 2020-2032
- 8.1. Market Analysis, Insights and Forecast - by Resin Type
- 8.1.1. Polyethylene (PE)
- 8.1.1.1. Low-Dens
- 8.1.1.2. High Density Polyethylene (HDPE)
- 8.1.2. Polyethylene terephthalate (PET)
- 8.1.3. Polypropylene (PP)
- 8.1.4. Polystyrene (PS) and Expanded polystyrene (EPS)
- 8.1.5. Polyvinyl chloride (PVC)
- 8.1.6. Other Resin Types
- 8.1.1. Polyethylene (PE)
- 8.2. Market Analysis, Insights and Forecast - by Product Type
- 8.2.1. Bottles and Jars
- 8.2.2. Trays and Containers
- 8.2.3. Caps and Closures
- 8.2.4. Intermediate Bulk Containers (IBCs)
- 8.2.5. Drums
- 8.2.6. Pallets
- 8.2.7. Other Product Types
- 8.3. Market Analysis, Insights and Forecast - by End-use Industries
- 8.3.1. Food
- 8.3.1.1. Candy & Confectionery
- 8.3.1.2. Frozen Foods
- 8.3.1.3. Fresh Produce
- 8.3.1.4. Dairy Products
- 8.3.1.5. Dry Foods
- 8.3.1.6. Meat, Poultry, And Seafood
- 8.3.1.7. Pet Food
- 8.3.1.8. Other Food Products
- 8.3.2. Foodservice
- 8.3.3. Beverage
- 8.3.4. Healthcare
- 8.3.5. Cosmetics and Personal Care
- 8.3.6. Industrial
- 8.3.7. Building and Construction
- 8.3.8. Automotive
- 8.3.9. Other End User Industries
- 8.3.1. Food
- 8.1. Market Analysis, Insights and Forecast - by Resin Type
- 9. Europe Rigid Plastic Packaging Industry in Indonesia Analysis, Insights and Forecast, 2020-2032
- 9.1. Market Analysis, Insights and Forecast - by Resin Type
- 9.1.1. Polyethylene (PE)
- 9.1.1.1. Low-Dens
- 9.1.1.2. High Density Polyethylene (HDPE)
- 9.1.2. Polyethylene terephthalate (PET)
- 9.1.3. Polypropylene (PP)
- 9.1.4. Polystyrene (PS) and Expanded polystyrene (EPS)
- 9.1.5. Polyvinyl chloride (PVC)
- 9.1.6. Other Resin Types
- 9.1.1. Polyethylene (PE)
- 9.2. Market Analysis, Insights and Forecast - by Product Type
- 9.2.1. Bottles and Jars
- 9.2.2. Trays and Containers
- 9.2.3. Caps and Closures
- 9.2.4. Intermediate Bulk Containers (IBCs)
- 9.2.5. Drums
- 9.2.6. Pallets
- 9.2.7. Other Product Types
- 9.3. Market Analysis, Insights and Forecast - by End-use Industries
- 9.3.1. Food
- 9.3.1.1. Candy & Confectionery
- 9.3.1.2. Frozen Foods
- 9.3.1.3. Fresh Produce
- 9.3.1.4. Dairy Products
- 9.3.1.5. Dry Foods
- 9.3.1.6. Meat, Poultry, And Seafood
- 9.3.1.7. Pet Food
- 9.3.1.8. Other Food Products
- 9.3.2. Foodservice
- 9.3.3. Beverage
- 9.3.4. Healthcare
- 9.3.5. Cosmetics and Personal Care
- 9.3.6. Industrial
- 9.3.7. Building and Construction
- 9.3.8. Automotive
- 9.3.9. Other End User Industries
- 9.3.1. Food
- 9.1. Market Analysis, Insights and Forecast - by Resin Type
- 10. Middle East & Africa Rigid Plastic Packaging Industry in Indonesia Analysis, Insights and Forecast, 2020-2032
- 10.1. Market Analysis, Insights and Forecast - by Resin Type
- 10.1.1. Polyethylene (PE)
- 10.1.1.1. Low-Dens
- 10.1.1.2. High Density Polyethylene (HDPE)
- 10.1.2. Polyethylene terephthalate (PET)
- 10.1.3. Polypropylene (PP)
- 10.1.4. Polystyrene (PS) and Expanded polystyrene (EPS)
- 10.1.5. Polyvinyl chloride (PVC)
- 10.1.6. Other Resin Types
- 10.1.1. Polyethylene (PE)
- 10.2. Market Analysis, Insights and Forecast - by Product Type
- 10.2.1. Bottles and Jars
- 10.2.2. Trays and Containers
- 10.2.3. Caps and Closures
- 10.2.4. Intermediate Bulk Containers (IBCs)
- 10.2.5. Drums
- 10.2.6. Pallets
- 10.2.7. Other Product Types
- 10.3. Market Analysis, Insights and Forecast - by End-use Industries
- 10.3.1. Food
- 10.3.1.1. Candy & Confectionery
- 10.3.1.2. Frozen Foods
- 10.3.1.3. Fresh Produce
- 10.3.1.4. Dairy Products
- 10.3.1.5. Dry Foods
- 10.3.1.6. Meat, Poultry, And Seafood
- 10.3.1.7. Pet Food
- 10.3.1.8. Other Food Products
- 10.3.2. Foodservice
- 10.3.3. Beverage
- 10.3.4. Healthcare
- 10.3.5. Cosmetics and Personal Care
- 10.3.6. Industrial
- 10.3.7. Building and Construction
- 10.3.8. Automotive
- 10.3.9. Other End User Industries
- 10.3.1. Food
- 10.1. Market Analysis, Insights and Forecast - by Resin Type
- 11. Asia Pacific Rigid Plastic Packaging Industry in Indonesia Analysis, Insights and Forecast, 2020-2032
- 11.1. Market Analysis, Insights and Forecast - by Resin Type
- 11.1.1. Polyethylene (PE)
- 11.1.1.1. Low-Dens
- 11.1.1.2. High Density Polyethylene (HDPE)
- 11.1.2. Polyethylene terephthalate (PET)
- 11.1.3. Polypropylene (PP)
- 11.1.4. Polystyrene (PS) and Expanded polystyrene (EPS)
- 11.1.5. Polyvinyl chloride (PVC)
- 11.1.6. Other Resin Types
- 11.1.1. Polyethylene (PE)
- 11.2. Market Analysis, Insights and Forecast - by Product Type
- 11.2.1. Bottles and Jars
- 11.2.2. Trays and Containers
- 11.2.3. Caps and Closures
- 11.2.4. Intermediate Bulk Containers (IBCs)
- 11.2.5. Drums
- 11.2.6. Pallets
- 11.2.7. Other Product Types
- 11.3. Market Analysis, Insights and Forecast - by End-use Industries
- 11.3.1. Food
- 11.3.1.1. Candy & Confectionery
- 11.3.1.2. Frozen Foods
- 11.3.1.3. Fresh Produce
- 11.3.1.4. Dairy Products
- 11.3.1.5. Dry Foods
- 11.3.1.6. Meat, Poultry, And Seafood
- 11.3.1.7. Pet Food
- 11.3.1.8. Other Food Products
- 11.3.2. Foodservice
- 11.3.3. Beverage
- 11.3.4. Healthcare
- 11.3.5. Cosmetics and Personal Care
- 11.3.6. Industrial
- 11.3.7. Building and Construction
- 11.3.8. Automotive
- 11.3.9. Other End User Industries
- 11.3.1. Food
- 11.1. Market Analysis, Insights and Forecast - by Resin Type
- 12. Competitive Analysis
- 12.1. Company Profiles
- 12.1.1 PT Indo Tirta Abadi
- 12.1.1.1. Company Overview
- 12.1.1.2. Products
- 12.1.1.3. Company Financials
- 12.1.1.4. SWOT Analysis
- 12.1.2 PT Solusi Prima Packaging
- 12.1.2.1. Company Overview
- 12.1.2.2. Products
- 12.1.2.3. Company Financials
- 12.1.2.4. SWOT Analysis
- 12.1.3 Indo Cap Closures
- 12.1.3.1. Company Overview
- 12.1.3.2. Products
- 12.1.3.3. Company Financials
- 12.1.3.4. SWOT Analysis
- 12.1.4 PT Berlina Tbk
- 12.1.4.1. Company Overview
- 12.1.4.2. Products
- 12.1.4.3. Company Financials
- 12.1.4.4. SWOT Analysis
- 12.1.5 Dynaplast
- 12.1.5.1. Company Overview
- 12.1.5.2. Products
- 12.1.5.3. Company Financials
- 12.1.5.4. SWOT Analysis
- 12.1.6 PT Hasil Raya Industries
- 12.1.6.1. Company Overview
- 12.1.6.2. Products
- 12.1.6.3. Company Financials
- 12.1.6.4. SWOT Analysis
- 12.1.7 Amcor PLC*List Not Exhaustive
- 12.1.7.1. Company Overview
- 12.1.7.2. Products
- 12.1.7.3. Company Financials
- 12.1.7.4. SWOT Analysis
- 12.1.1 PT Indo Tirta Abadi
- 12.2. Market Entropy
- 12.2.1 Company's Key Areas Served
- 12.2.2 Recent Developments
- 12.3. Company Market Share Analysis 2025
- 12.3.1 Top 5 Companies Market Share Analysis
- 12.3.2 Top 3 Companies Market Share Analysis
- 12.4. List of Potential Customers
- 13. Research Methodology
List of Figures
- Figure 1: Global Rigid Plastic Packaging Industry in Indonesia Revenue Breakdown (million, %) by Region 2025 & 2033
- Figure 2: North America Rigid Plastic Packaging Industry in Indonesia Revenue (million), by Resin Type 2025 & 2033
- Figure 3: North America Rigid Plastic Packaging Industry in Indonesia Revenue Share (%), by Resin Type 2025 & 2033
- Figure 4: North America Rigid Plastic Packaging Industry in Indonesia Revenue (million), by Product Type 2025 & 2033
- Figure 5: North America Rigid Plastic Packaging Industry in Indonesia Revenue Share (%), by Product Type 2025 & 2033
- Figure 6: North America Rigid Plastic Packaging Industry in Indonesia Revenue (million), by End-use Industries 2025 & 2033
- Figure 7: North America Rigid Plastic Packaging Industry in Indonesia Revenue Share (%), by End-use Industries 2025 & 2033
- Figure 8: North America Rigid Plastic Packaging Industry in Indonesia Revenue (million), by Country 2025 & 2033
- Figure 9: North America Rigid Plastic Packaging Industry in Indonesia Revenue Share (%), by Country 2025 & 2033
- Figure 10: South America Rigid Plastic Packaging Industry in Indonesia Revenue (million), by Resin Type 2025 & 2033
- Figure 11: South America Rigid Plastic Packaging Industry in Indonesia Revenue Share (%), by Resin Type 2025 & 2033
- Figure 12: South America Rigid Plastic Packaging Industry in Indonesia Revenue (million), by Product Type 2025 & 2033
- Figure 13: South America Rigid Plastic Packaging Industry in Indonesia Revenue Share (%), by Product Type 2025 & 2033
- Figure 14: South America Rigid Plastic Packaging Industry in Indonesia Revenue (million), by End-use Industries 2025 & 2033
- Figure 15: South America Rigid Plastic Packaging Industry in Indonesia Revenue Share (%), by End-use Industries 2025 & 2033
- Figure 16: South America Rigid Plastic Packaging Industry in Indonesia Revenue (million), by Country 2025 & 2033
- Figure 17: South America Rigid Plastic Packaging Industry in Indonesia Revenue Share (%), by Country 2025 & 2033
- Figure 18: Europe Rigid Plastic Packaging Industry in Indonesia Revenue (million), by Resin Type 2025 & 2033
- Figure 19: Europe Rigid Plastic Packaging Industry in Indonesia Revenue Share (%), by Resin Type 2025 & 2033
- Figure 20: Europe Rigid Plastic Packaging Industry in Indonesia Revenue (million), by Product Type 2025 & 2033
- Figure 21: Europe Rigid Plastic Packaging Industry in Indonesia Revenue Share (%), by Product Type 2025 & 2033
- Figure 22: Europe Rigid Plastic Packaging Industry in Indonesia Revenue (million), by End-use Industries 2025 & 2033
- Figure 23: Europe Rigid Plastic Packaging Industry in Indonesia Revenue Share (%), by End-use Industries 2025 & 2033
- Figure 24: Europe Rigid Plastic Packaging Industry in Indonesia Revenue (million), by Country 2025 & 2033
- Figure 25: Europe Rigid Plastic Packaging Industry in Indonesia Revenue Share (%), by Country 2025 & 2033
- Figure 26: Middle East & Africa Rigid Plastic Packaging Industry in Indonesia Revenue (million), by Resin Type 2025 & 2033
- Figure 27: Middle East & Africa Rigid Plastic Packaging Industry in Indonesia Revenue Share (%), by Resin Type 2025 & 2033
- Figure 28: Middle East & Africa Rigid Plastic Packaging Industry in Indonesia Revenue (million), by Product Type 2025 & 2033
- Figure 29: Middle East & Africa Rigid Plastic Packaging Industry in Indonesia Revenue Share (%), by Product Type 2025 & 2033
- Figure 30: Middle East & Africa Rigid Plastic Packaging Industry in Indonesia Revenue (million), by End-use Industries 2025 & 2033
- Figure 31: Middle East & Africa Rigid Plastic Packaging Industry in Indonesia Revenue Share (%), by End-use Industries 2025 & 2033
- Figure 32: Middle East & Africa Rigid Plastic Packaging Industry in Indonesia Revenue (million), by Country 2025 & 2033
- Figure 33: Middle East & Africa Rigid Plastic Packaging Industry in Indonesia Revenue Share (%), by Country 2025 & 2033
- Figure 34: Asia Pacific Rigid Plastic Packaging Industry in Indonesia Revenue (million), by Resin Type 2025 & 2033
- Figure 35: Asia Pacific Rigid Plastic Packaging Industry in Indonesia Revenue Share (%), by Resin Type 2025 & 2033
- Figure 36: Asia Pacific Rigid Plastic Packaging Industry in Indonesia Revenue (million), by Product Type 2025 & 2033
- Figure 37: Asia Pacific Rigid Plastic Packaging Industry in Indonesia Revenue Share (%), by Product Type 2025 & 2033
- Figure 38: Asia Pacific Rigid Plastic Packaging Industry in Indonesia Revenue (million), by End-use Industries 2025 & 2033
- Figure 39: Asia Pacific Rigid Plastic Packaging Industry in Indonesia Revenue Share (%), by End-use Industries 2025 & 2033
- Figure 40: Asia Pacific Rigid Plastic Packaging Industry in Indonesia Revenue (million), by Country 2025 & 2033
- Figure 41: Asia Pacific Rigid Plastic Packaging Industry in Indonesia Revenue Share (%), by Country 2025 & 2033
List of Tables
- Table 1: Global Rigid Plastic Packaging Industry in Indonesia Revenue million Forecast, by Resin Type 2020 & 2033
- Table 2: Global Rigid Plastic Packaging Industry in Indonesia Revenue million Forecast, by Product Type 2020 & 2033
- Table 3: Global Rigid Plastic Packaging Industry in Indonesia Revenue million Forecast, by End-use Industries 2020 & 2033
- Table 4: Global Rigid Plastic Packaging Industry in Indonesia Revenue million Forecast, by Region 2020 & 2033
- Table 5: Global Rigid Plastic Packaging Industry in Indonesia Revenue million Forecast, by Resin Type 2020 & 2033
- Table 6: Global Rigid Plastic Packaging Industry in Indonesia Revenue million Forecast, by Product Type 2020 & 2033
- Table 7: Global Rigid Plastic Packaging Industry in Indonesia Revenue million Forecast, by End-use Industries 2020 & 2033
- Table 8: Global Rigid Plastic Packaging Industry in Indonesia Revenue million Forecast, by Country 2020 & 2033
- Table 9: United States Rigid Plastic Packaging Industry in Indonesia Revenue (million) Forecast, by Application 2020 & 2033
- Table 10: Canada Rigid Plastic Packaging Industry in Indonesia Revenue (million) Forecast, by Application 2020 & 2033
- Table 11: Mexico Rigid Plastic Packaging Industry in Indonesia Revenue (million) Forecast, by Application 2020 & 2033
- Table 12: Global Rigid Plastic Packaging Industry in Indonesia Revenue million Forecast, by Resin Type 2020 & 2033
- Table 13: Global Rigid Plastic Packaging Industry in Indonesia Revenue million Forecast, by Product Type 2020 & 2033
- Table 14: Global Rigid Plastic Packaging Industry in Indonesia Revenue million Forecast, by End-use Industries 2020 & 2033
- Table 15: Global Rigid Plastic Packaging Industry in Indonesia Revenue million Forecast, by Country 2020 & 2033
- Table 16: Brazil Rigid Plastic Packaging Industry in Indonesia Revenue (million) Forecast, by Application 2020 & 2033
- Table 17: Argentina Rigid Plastic Packaging Industry in Indonesia Revenue (million) Forecast, by Application 2020 & 2033
- Table 18: Rest of South America Rigid Plastic Packaging Industry in Indonesia Revenue (million) Forecast, by Application 2020 & 2033
- Table 19: Global Rigid Plastic Packaging Industry in Indonesia Revenue million Forecast, by Resin Type 2020 & 2033
- Table 20: Global Rigid Plastic Packaging Industry in Indonesia Revenue million Forecast, by Product Type 2020 & 2033
- Table 21: Global Rigid Plastic Packaging Industry in Indonesia Revenue million Forecast, by End-use Industries 2020 & 2033
- Table 22: Global Rigid Plastic Packaging Industry in Indonesia Revenue million Forecast, by Country 2020 & 2033
- Table 23: United Kingdom Rigid Plastic Packaging Industry in Indonesia Revenue (million) Forecast, by Application 2020 & 2033
- Table 24: Germany Rigid Plastic Packaging Industry in Indonesia Revenue (million) Forecast, by Application 2020 & 2033
- Table 25: France Rigid Plastic Packaging Industry in Indonesia Revenue (million) Forecast, by Application 2020 & 2033
- Table 26: Italy Rigid Plastic Packaging Industry in Indonesia Revenue (million) Forecast, by Application 2020 & 2033
- Table 27: Spain Rigid Plastic Packaging Industry in Indonesia Revenue (million) Forecast, by Application 2020 & 2033
- Table 28: Russia Rigid Plastic Packaging Industry in Indonesia Revenue (million) Forecast, by Application 2020 & 2033
- Table 29: Benelux Rigid Plastic Packaging Industry in Indonesia Revenue (million) Forecast, by Application 2020 & 2033
- Table 30: Nordics Rigid Plastic Packaging Industry in Indonesia Revenue (million) Forecast, by Application 2020 & 2033
- Table 31: Rest of Europe Rigid Plastic Packaging Industry in Indonesia Revenue (million) Forecast, by Application 2020 & 2033
- Table 32: Global Rigid Plastic Packaging Industry in Indonesia Revenue million Forecast, by Resin Type 2020 & 2033
- Table 33: Global Rigid Plastic Packaging Industry in Indonesia Revenue million Forecast, by Product Type 2020 & 2033
- Table 34: Global Rigid Plastic Packaging Industry in Indonesia Revenue million Forecast, by End-use Industries 2020 & 2033
- Table 35: Global Rigid Plastic Packaging Industry in Indonesia Revenue million Forecast, by Country 2020 & 2033
- Table 36: Turkey Rigid Plastic Packaging Industry in Indonesia Revenue (million) Forecast, by Application 2020 & 2033
- Table 37: Israel Rigid Plastic Packaging Industry in Indonesia Revenue (million) Forecast, by Application 2020 & 2033
- Table 38: GCC Rigid Plastic Packaging Industry in Indonesia Revenue (million) Forecast, by Application 2020 & 2033
- Table 39: North Africa Rigid Plastic Packaging Industry in Indonesia Revenue (million) Forecast, by Application 2020 & 2033
- Table 40: South Africa Rigid Plastic Packaging Industry in Indonesia Revenue (million) Forecast, by Application 2020 & 2033
- Table 41: Rest of Middle East & Africa Rigid Plastic Packaging Industry in Indonesia Revenue (million) Forecast, by Application 2020 & 2033
- Table 42: Global Rigid Plastic Packaging Industry in Indonesia Revenue million Forecast, by Resin Type 2020 & 2033
- Table 43: Global Rigid Plastic Packaging Industry in Indonesia Revenue million Forecast, by Product Type 2020 & 2033
- Table 44: Global Rigid Plastic Packaging Industry in Indonesia Revenue million Forecast, by End-use Industries 2020 & 2033
- Table 45: Global Rigid Plastic Packaging Industry in Indonesia Revenue million Forecast, by Country 2020 & 2033
- Table 46: China Rigid Plastic Packaging Industry in Indonesia Revenue (million) Forecast, by Application 2020 & 2033
- Table 47: India Rigid Plastic Packaging Industry in Indonesia Revenue (million) Forecast, by Application 2020 & 2033
- Table 48: Japan Rigid Plastic Packaging Industry in Indonesia Revenue (million) Forecast, by Application 2020 & 2033
- Table 49: South Korea Rigid Plastic Packaging Industry in Indonesia Revenue (million) Forecast, by Application 2020 & 2033
- Table 50: ASEAN Rigid Plastic Packaging Industry in Indonesia Revenue (million) Forecast, by Application 2020 & 2033
- Table 51: Oceania Rigid Plastic Packaging Industry in Indonesia Revenue (million) Forecast, by Application 2020 & 2033
- Table 52: Rest of Asia Pacific Rigid Plastic Packaging Industry in Indonesia Revenue (million) Forecast, by Application 2020 & 2033
Frequently Asked Questions
1. What is the projected Compound Annual Growth Rate (CAGR) of the Rigid Plastic Packaging Industry in Indonesia?
The projected CAGR is approximately 4.98%.
2. Which companies are prominent players in the Rigid Plastic Packaging Industry in Indonesia?
Key companies in the market include PT Indo Tirta Abadi, PT Solusi Prima Packaging, Indo Cap Closures, PT Berlina Tbk, Dynaplast, PT Hasil Raya Industries, Amcor PLC*List Not Exhaustive.
3. What are the main segments of the Rigid Plastic Packaging Industry in Indonesia?
The market segments include Resin Type, Product Type, End-use Industries.
4. Can you provide details about the market size?
The market size is estimated to be USD 1.24 million as of 2022.
5. What are some drivers contributing to market growth?
Strong Demand From the Food and Beverage Packaging Industry.
6. What are the notable trends driving market growth?
Polyethylene Terephthalate (PET) Expected to Witness Significant Growth.
7. Are there any restraints impacting market growth?
Stringent Laws & Regulations Pertaining to Plastic Industries; Competition From Flexible Plastic Packaging.
8. Can you provide examples of recent developments in the market?
April 2022: Mondi launched a sustainable packaging solution for the food industry. Mono Formable PP is a semi-rigid plastic tray created from mono-material polypropylene (PP) that features a printed top web and a thermoformable semi-rigid bottom web. The packaging weighs 30% less than a comparable polyester (PET) tray and has features like easy-peel for convenient opening and reclosure.
9. What pricing options are available for accessing the report?
Pricing options include single-user, multi-user, and enterprise licenses priced at USD 4750, USD 5250, and USD 8750 respectively.
10. Is the market size provided in terms of value or volume?
The market size is provided in terms of value, measured in million.
11. Are there any specific market keywords associated with the report?
Yes, the market keyword associated with the report is "Rigid Plastic Packaging Industry in Indonesia," which aids in identifying and referencing the specific market segment covered.
12. How do I determine which pricing option suits my needs best?
The pricing options vary based on user requirements and access needs. Individual users may opt for single-user licenses, while businesses requiring broader access may choose multi-user or enterprise licenses for cost-effective access to the report.
13. Are there any additional resources or data provided in the Rigid Plastic Packaging Industry in Indonesia report?
While the report offers comprehensive insights, it's advisable to review the specific contents or supplementary materials provided to ascertain if additional resources or data are available.
14. How can I stay updated on further developments or reports in the Rigid Plastic Packaging Industry in Indonesia?
To stay informed about further developments, trends, and reports in the Rigid Plastic Packaging Industry in Indonesia, consider subscribing to industry newsletters, following relevant companies and organizations, or regularly checking reputable industry news sources and publications.
Methodology
Step 1 - Identification of Relevant Samples Size from Population Database


Step 2 - Approaches for Defining Global Market Size (Value, Volume* & Price*)

Note*: In applicable scenarios
Step 3 - Data Sources
Primary Research
- Web Analytics
- Survey Reports
- Research Institute
- Latest Research Reports
- Opinion Leaders
Secondary Research
- Annual Reports
- White Paper
- Latest Press Release
- Industry Association
- Paid Database
- Investor Presentations

Step 4 - Data Triangulation
Involves using different sources of information in order to increase the validity of a study
These sources are likely to be stakeholders in a program - participants, other researchers, program staff, other community members, and so on.
Then we put all data in single framework & apply various statistical tools to find out the dynamic on the market.
During the analysis stage, feedback from the stakeholder groups would be compared to determine areas of agreement as well as areas of divergence