

Key Insights
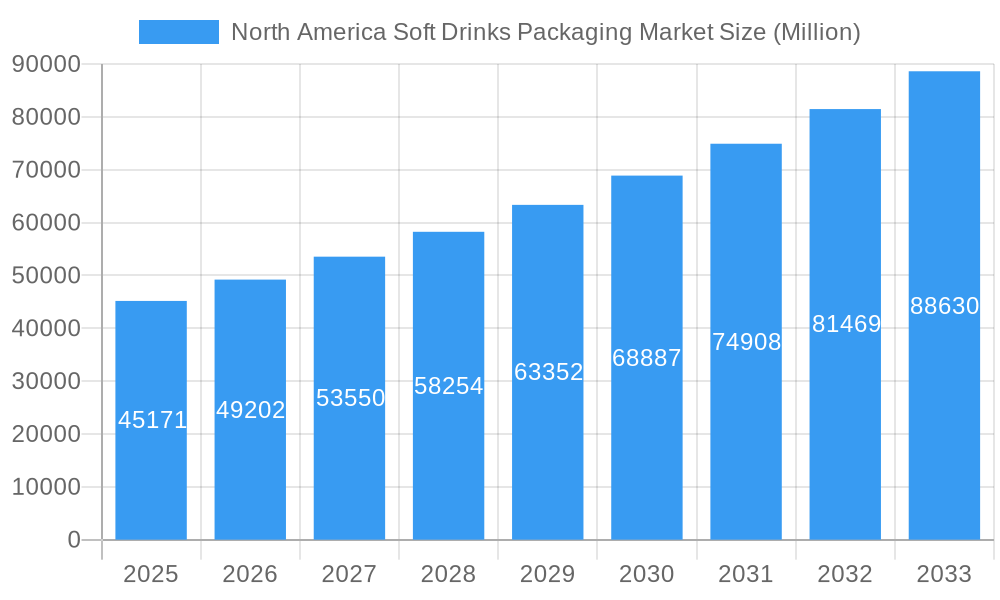
The North America soft drinks packaging market is projected to reach $42.16 billion by 2025, exhibiting a Compound Annual Growth Rate (CAGR) of 6.57% from 2019 to 2033. Growth is propelled by shifting consumer preferences for convenient single-serve options and the rising popularity of functional beverages, including sports and energy drinks. The active lifestyles in the United States and Canada necessitate portable and sustainable packaging. Key drivers include increasing disposable income, growing health awareness driving demand for healthier alternatives, and continuous innovation in packaging materials for enhanced shelf-life, portability, and aesthetics. The market is also experiencing a significant demand for eco-friendly packaging, with manufacturers prioritizing recyclable and biodegradable materials.
North America Soft Drinks Packaging Market Market Size (In Billion)
Market segmentation highlights opportunities and competitive dynamics. Plastic packaging, predominantly PET, remains dominant due to its cost-effectiveness, lightweight properties, and versatility for bottled water, carbonated drinks, and juices. However, environmental concerns and regulations are increasing the adoption of paper/paperboard, glass, and metal alternatives. Innovations in traditional materials, such as enhanced barrier properties for paper cartons and lightweighting for glass and metal, are improving their competitiveness. The "Other Materials" segment, including bioplastics and advanced composites, is growing as sustainability becomes a critical factor. Leading companies like WestRock Company, Ball Corporation, and Amcor Ltd are investing in research and development to offer sustainable and innovative packaging solutions for the North American soft drinks industry.
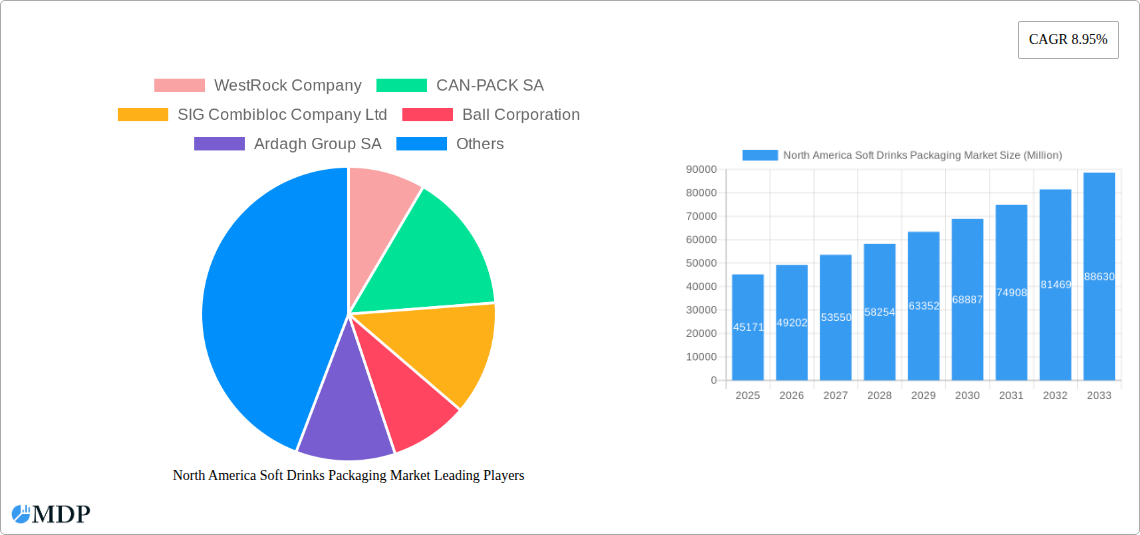
North America Soft Drinks Packaging Market Company Market Share
North America Soft Drinks Packaging Market Insights: 2019-2033
Access comprehensive insights into the North America soft drinks packaging market. This report, covering the historical period of 2019–2024 and a forecast from 2025–2033, details market segmentation, key drivers, emerging opportunities, and the competitive landscape. Explore innovations in plastic, paperboard, glass, and metal packaging influencing bottled water, carbonated drinks, juices, RTD beverages, and sports drinks across the United States and Canada. Essential for industry leaders, investors, and strategists targeting sustainable, convenient, and appealing soft drink packaging solutions.
North America Soft Drinks Packaging Market Market Dynamics & Concentration
The North America soft drinks packaging market is characterized by a moderate to high concentration, with a few key players holding significant market share. Innovation is a primary driver, fueled by the constant pursuit of enhanced sustainability, improved convenience, and superior product shelf appeal. Regulatory frameworks, particularly concerning recyclability, plastic reduction, and food-grade material safety, are increasingly influencing packaging choices and driving investment in eco-friendly alternatives. Product substitutes, such as a shift towards in-home beverage consumption and the rise of reusable containers, present both challenges and opportunities for traditional packaging formats. End-user trends, including a growing demand for healthier beverage options like water and functional drinks, are indirectly impacting packaging material choices and sizes. Mergers and acquisitions (M&A) activities continue to shape the competitive landscape, with an estimated XX M&A deals occurring between 2019 and 2024, as companies seek to expand their product portfolios, geographical reach, and technological capabilities. Key players like WestRock Company, Amcor Ltd, and Ball Corporation are at the forefront of these strategic moves, aiming to consolidate their market positions and leverage synergies. The market is projected to reach a valuation of over $XX Billion by 2033.
- Market Share Dominance: Top 5 players collectively hold approximately 60-70% market share.
- Innovation Drivers: Sustainability, lightweighting, enhanced barrier properties, smart packaging.
- Regulatory Influence: EPR schemes, single-use plastic bans, recycled content mandates.
- Product Substitute Threat: Growing popularity of bulk dispensers, reusable bottles, and concentrates.
- End-User Preferences: Health-conscious consumers, demand for single-serve, on-the-go options.
- M&A Activity: XX M&A deals recorded in the historical period.
North America Soft Drinks Packaging Market Industry Trends & Analysis
The North America soft drinks packaging market is poised for substantial growth, driven by a confluence of compelling trends. A significant growth driver is the escalating consumer preference for convenience and on-the-go consumption, which fuels demand for single-serve and easily portable packaging formats across all beverage categories, from carbonated soft drinks to ready-to-drink (RTD) beverages. Technological disruptions are revolutionizing the industry, with advancements in materials science leading to the development of lighter, stronger, and more sustainable packaging solutions. This includes the increasing adoption of recycled plastics (rPET), biodegradable materials, and innovative paper-based solutions that offer comparable performance to traditional plastics and metals. Consumer preferences are increasingly leaning towards health and wellness, translating into a higher demand for bottled water and natural juices, which in turn influences the types of packaging employed. The competitive dynamics within the market are intensifying, characterized by a continuous race for innovation, cost optimization, and market penetration. Companies are investing heavily in R&D to develop packaging that not only preserves product integrity but also enhances brand visibility and consumer engagement through novel designs and functionalities. The penetration of sustainable packaging solutions is expected to witness a CAGR of approximately 5-7% over the forecast period, becoming a non-negotiable aspect for brand manufacturers. The market is projected to grow at a healthy CAGR of XX% from 2025 to 2033, reaching an estimated market size of over $XX Billion by the end of the forecast period. The increasing demand for RTD beverages and the robust market for bottled water are significant contributors to this growth trajectory. Furthermore, the push towards circular economy principles is accelerating the adoption of advanced recycling technologies and the integration of post-consumer recycled content, impacting the material mix and design considerations across the value chain.
Leading Markets & Segments in North America Soft Drinks Packaging Market
The United States stands as the dominant market within North America for soft drinks packaging, accounting for over 80% of the total market value. This dominance is attributed to its vast consumer base, high disposable income, and a mature beverage industry with a wide array of product offerings. Canada represents a significant, albeit smaller, market, with its own unique consumer preferences and regulatory landscape influencing packaging trends.
Within the Packaging Material Type segment, Plastic, particularly PET (Polyethylene Terephthalate), continues to lead the market. Its versatility, lightweight nature, and cost-effectiveness make it the preferred choice for a majority of soft drink applications. However, the market is witnessing a gradual but significant shift towards Paper and Paperboard packaging, driven by strong sustainability mandates and a desire to reduce plastic waste. Metal packaging, primarily aluminum, is also experiencing a resurgence, particularly for carbonated beverages and the growing RTD segment, owing to its excellent recyclability and barrier properties. Glass packaging, while offering premium appeal and excellent inertness, faces challenges due to its weight and fragility, limiting its widespread adoption in high-volume segments.
- Dominant Geography: United States (over 80% market share).
- Key Drivers: Large population, high per capita beverage consumption, robust distribution networks, strong brand presence.
- Economic Policies: Favorable trade policies and consumer spending power.
- Infrastructure: Well-developed logistics and retail infrastructure supporting efficient product distribution.
- Dominant Packaging Material Type: Plastic (particularly PET).
- Key Drivers: Cost-effectiveness, versatility, lightweight properties, recyclability.
- Consumer Preferences: Demand for convenient, on-the-go packaging.
- Technological Advancements: Improved barrier properties and design flexibility.
- Dominant Product Type: Bottled Water and Carbonated Drinks.
- Key Drivers: Ubiquitous demand, health trends (bottled water), established market for carbonated beverages.
- Market Penetration: High penetration rates for these categories across all age demographics.
- Innovation: Continued innovation in flavor profiles and functional benefits driving packaging needs.
- Emerging Segment: RTD Beverages.
- Key Drivers: Changing lifestyles, demand for convenience, innovative product formulations.
- Packaging Needs: Focus on portability, resealability, and extended shelf life.
North America Soft Drinks Packaging Market Product Developments
Product innovations in the North America soft drinks packaging market are primarily focused on enhancing sustainability and consumer convenience. The development of advanced barrier coatings for paperboard packaging aims to provide extended shelf life comparable to plastic or metal. Lightweighting initiatives continue to reduce material usage in PET bottles and aluminum cans without compromising structural integrity. Furthermore, the integration of smart technologies, such as QR codes for supply chain traceability and interactive branding, is gaining traction. The competitive advantage lies in offering solutions that meet stringent environmental regulations, reduce carbon footprint, and cater to the evolving demands of health-conscious and eco-aware consumers.
Key Drivers of North America Soft Drinks Packaging Market Growth
Several key drivers are propelling the growth of the North America soft drinks packaging market. Firstly, the escalating demand for convenient, on-the-go beverage consumption, especially for bottled water and RTD beverages, is a significant factor. Secondly, increasing environmental consciousness among consumers and stringent government regulations promoting recyclability and reduced plastic usage are driving innovation in sustainable packaging materials like recycled PET and paper-based alternatives. Thirdly, technological advancements in packaging design and manufacturing, leading to lighter, more durable, and cost-effective solutions, are further bolstering market expansion. Finally, the continuous introduction of new beverage products and flavors by manufacturers necessitates adaptive and appealing packaging solutions to capture consumer attention.
Challenges in the North America Soft Drinks Packaging Market Market
Despite robust growth, the North America soft drinks packaging market faces several challenges. Fluctuations in raw material prices, particularly for PET and aluminum, can impact manufacturing costs and profit margins. Stringent and evolving environmental regulations, while driving innovation, can also create compliance burdens and necessitate significant investments in new technologies and infrastructure. Competitive pressures from alternative beverage formats and the increasing adoption of reusable packaging systems pose a threat to single-use packaging solutions. Furthermore, the complexities of global supply chains and potential disruptions can impact the availability and timely delivery of packaging materials.
Emerging Opportunities in North America Soft Drinks Packaging Market
Emerging opportunities in the North America soft drinks packaging market are abundant, driven by the growing imperative for circular economy solutions. The expansion of advanced recycling technologies, including chemical recycling, presents a significant opportunity to increase the supply of high-quality recycled content for plastic packaging. Strategic partnerships between packaging manufacturers and beverage brands to develop closed-loop systems and enhance collection and recycling infrastructure offer a pathway to greater sustainability and consumer engagement. The growing demand for premium and artisanal beverages is also creating opportunities for innovative and aesthetically pleasing packaging designs that enhance brand perception. Furthermore, market expansion into untapped regions within North America and the development of specialized packaging for niche beverage segments like functional drinks and adaptogens will drive long-term growth.
Leading Players in the North America Soft Drinks Packaging Market Sector
- WestRock Company
- CAN-PACK SA
- SIG Combibloc Company Ltd
- Ball Corporation
- Ardagh Group SA
- Alcoa Corporation
- Crown Holdings Inc
- Graham Packaging Company
- Tetra Pak International
- The Scoular Company
- Toyo Seikan Group Holdings Ltd
- Pactive LLC
- Placon Corporation
- Genpak LLC
- Owens-Illinois Inc
- Amcor Ltd
Key Milestones in North America Soft Drinks Packaging Market Industry
- May 2021: Ball Corporation announced the nationwide availability of the Ball Aluminum Cup for soft drinks across all 50 states in the United States, reaching over 18,000 retailers.
- April 2021: Amcor announced a strategic investment of approximately USD 10 to USD 15 million in ePac flexible packaging, enhancing its capabilities in high-quality, short-run digital printing.
Strategic Outlook for North America Soft Drinks Packaging Market Market
The strategic outlook for the North America soft drinks packaging market is one of sustained innovation and adaptation. Future growth will be largely fueled by the continued push towards sustainable packaging solutions, including increased use of recycled materials and the development of biodegradable and compostable alternatives. Companies that invest in advanced recycling technologies and collaborate with stakeholders to improve collection and recycling rates will gain a significant competitive advantage. Furthermore, the adoption of smart packaging features for enhanced consumer engagement and supply chain transparency will become increasingly crucial. Strategic partnerships and acquisitions aimed at expanding technological capabilities and market reach will remain a key strategy for leading players navigating this dynamic landscape. The focus on lightweighting, material efficiency, and designs that minimize environmental impact will define successful market strategies moving forward.
North America Soft Drinks Packaging Market Segmentation
-
1. Packaging Material Type
- 1.1. Plastic
- 1.2. Paper and Paperboard
- 1.3. Glass
- 1.4. Metal
- 1.5. Other Materials
-
2. Product Type
- 2.1. Bottled Water
- 2.2. Carbonated Drinks
- 2.3. Juices
- 2.4. RTD Beverages
- 2.5. Sports Drinks
- 2.6. Other Product Types
-
3. Geography
- 3.1. United States
- 3.2. Canada
North America Soft Drinks Packaging Market Segmentation By Geography
- 1. United States
- 2. Canada
North America Soft Drinks Packaging Market Regional Market Share
Geographic Coverage of North America Soft Drinks Packaging Market
North America Soft Drinks Packaging Market REPORT HIGHLIGHTS
| Aspects | Details |
|---|---|
| Study Period | 2020-2034 |
| Base Year | 2025 |
| Estimated Year | 2026 |
| Forecast Period | 2026-2034 |
| Historical Period | 2020-2025 |
| Growth Rate | CAGR of 6.57% from 2020-2034 |
| Segmentation |
|
Table of Contents
- 1. Introduction
- 1.1. Research Scope
- 1.2. Market Segmentation
- 1.3. Research Objective
- 1.4. Definitions and Assumptions
- 2. Executive Summary
- 2.1. Market Snapshot
- 3. Market Dynamics
- 3.1. Market Drivers
- 3.2. Market Restrains
- 3.3. Market Trends
- 3.4. Market Opportunities
- 4. Market Factor Analysis
- 4.1. Porters Five Forces
- 4.1.1. Bargaining Power of Suppliers
- 4.1.2. Bargaining Power of Buyers
- 4.1.3. Threat of New Entrants
- 4.1.4. Threat of Substitutes
- 4.1.5. Competitive Rivalry
- 4.2. PESTEL analysis
- 4.3. BCG Analysis
- 4.3.1. Stars (High Growth, High Market Share)
- 4.3.2. Cash Cows (Low Growth, High Market Share)
- 4.3.3. Question Mark (High Growth, Low Market Share)
- 4.3.4. Dogs (Low Growth, Low Market Share)
- 4.4. Ansoff Matrix Analysis
- 4.5. Supply Chain Analysis
- 4.6. Regulatory Landscape
- 4.7. Current Market Potential and Opportunity Assessment (TAM–SAM–SOM Framework)
- 4.8. MDP Analyst Note
- 4.1. Porters Five Forces
- 5. Market Analysis, Insights and Forecast 2021-2033
- 5.1. Market Analysis, Insights and Forecast - by Packaging Material Type
- 5.1.1. Plastic
- 5.1.2. Paper and Paperboard
- 5.1.3. Glass
- 5.1.4. Metal
- 5.1.5. Other Materials
- 5.2. Market Analysis, Insights and Forecast - by Product Type
- 5.2.1. Bottled Water
- 5.2.2. Carbonated Drinks
- 5.2.3. Juices
- 5.2.4. RTD Beverages
- 5.2.5. Sports Drinks
- 5.2.6. Other Product Types
- 5.3. Market Analysis, Insights and Forecast - by Geography
- 5.3.1. United States
- 5.3.2. Canada
- 5.4. Market Analysis, Insights and Forecast - by Region
- 5.4.1. United States
- 5.4.2. Canada
- 5.1. Market Analysis, Insights and Forecast - by Packaging Material Type
- 6. North America Soft Drinks Packaging Market Analysis, Insights and Forecast, 2021-2033
- 6.1. Market Analysis, Insights and Forecast - by Packaging Material Type
- 6.1.1. Plastic
- 6.1.2. Paper and Paperboard
- 6.1.3. Glass
- 6.1.4. Metal
- 6.1.5. Other Materials
- 6.2. Market Analysis, Insights and Forecast - by Product Type
- 6.2.1. Bottled Water
- 6.2.2. Carbonated Drinks
- 6.2.3. Juices
- 6.2.4. RTD Beverages
- 6.2.5. Sports Drinks
- 6.2.6. Other Product Types
- 6.3. Market Analysis, Insights and Forecast - by Geography
- 6.3.1. United States
- 6.3.2. Canada
- 6.1. Market Analysis, Insights and Forecast - by Packaging Material Type
- 7. United States North America Soft Drinks Packaging Market Analysis, Insights and Forecast, 2020-2032
- 7.1. Market Analysis, Insights and Forecast - by Packaging Material Type
- 7.1.1. Plastic
- 7.1.2. Paper and Paperboard
- 7.1.3. Glass
- 7.1.4. Metal
- 7.1.5. Other Materials
- 7.2. Market Analysis, Insights and Forecast - by Product Type
- 7.2.1. Bottled Water
- 7.2.2. Carbonated Drinks
- 7.2.3. Juices
- 7.2.4. RTD Beverages
- 7.2.5. Sports Drinks
- 7.2.6. Other Product Types
- 7.3. Market Analysis, Insights and Forecast - by Geography
- 7.3.1. United States
- 7.3.2. Canada
- 7.1. Market Analysis, Insights and Forecast - by Packaging Material Type
- 8. Canada North America Soft Drinks Packaging Market Analysis, Insights and Forecast, 2020-2032
- 8.1. Market Analysis, Insights and Forecast - by Packaging Material Type
- 8.1.1. Plastic
- 8.1.2. Paper and Paperboard
- 8.1.3. Glass
- 8.1.4. Metal
- 8.1.5. Other Materials
- 8.2. Market Analysis, Insights and Forecast - by Product Type
- 8.2.1. Bottled Water
- 8.2.2. Carbonated Drinks
- 8.2.3. Juices
- 8.2.4. RTD Beverages
- 8.2.5. Sports Drinks
- 8.2.6. Other Product Types
- 8.3. Market Analysis, Insights and Forecast - by Geography
- 8.3.1. United States
- 8.3.2. Canada
- 8.1. Market Analysis, Insights and Forecast - by Packaging Material Type
- 9. Competitive Analysis
- 9.1. Company Profiles
- 9.1.1 WestRock Company
- 9.1.1.1. Company Overview
- 9.1.1.2. Products
- 9.1.1.3. Company Financials
- 9.1.1.4. SWOT Analysis
- 9.1.2 CAN-PACK SA
- 9.1.2.1. Company Overview
- 9.1.2.2. Products
- 9.1.2.3. Company Financials
- 9.1.2.4. SWOT Analysis
- 9.1.3 SIG Combibloc Company Ltd
- 9.1.3.1. Company Overview
- 9.1.3.2. Products
- 9.1.3.3. Company Financials
- 9.1.3.4. SWOT Analysis
- 9.1.4 Ball Corporation
- 9.1.4.1. Company Overview
- 9.1.4.2. Products
- 9.1.4.3. Company Financials
- 9.1.4.4. SWOT Analysis
- 9.1.5 Ardagh Group SA
- 9.1.5.1. Company Overview
- 9.1.5.2. Products
- 9.1.5.3. Company Financials
- 9.1.5.4. SWOT Analysis
- 9.1.6 Alcoa Corporation*List Not Exhaustive
- 9.1.6.1. Company Overview
- 9.1.6.2. Products
- 9.1.6.3. Company Financials
- 9.1.6.4. SWOT Analysis
- 9.1.7 Crown Holdings Inc
- 9.1.7.1. Company Overview
- 9.1.7.2. Products
- 9.1.7.3. Company Financials
- 9.1.7.4. SWOT Analysis
- 9.1.8 Graham Packaging Company
- 9.1.8.1. Company Overview
- 9.1.8.2. Products
- 9.1.8.3. Company Financials
- 9.1.8.4. SWOT Analysis
- 9.1.9 Tetra Pak International
- 9.1.9.1. Company Overview
- 9.1.9.2. Products
- 9.1.9.3. Company Financials
- 9.1.9.4. SWOT Analysis
- 9.1.10 The Scoular Company
- 9.1.10.1. Company Overview
- 9.1.10.2. Products
- 9.1.10.3. Company Financials
- 9.1.10.4. SWOT Analysis
- 9.1.11 Toyo Seikan Group Holdings Ltd
- 9.1.11.1. Company Overview
- 9.1.11.2. Products
- 9.1.11.3. Company Financials
- 9.1.11.4. SWOT Analysis
- 9.1.12 Pactive LLC
- 9.1.12.1. Company Overview
- 9.1.12.2. Products
- 9.1.12.3. Company Financials
- 9.1.12.4. SWOT Analysis
- 9.1.13 Placon Corporation
- 9.1.13.1. Company Overview
- 9.1.13.2. Products
- 9.1.13.3. Company Financials
- 9.1.13.4. SWOT Analysis
- 9.1.14 Genpak LLC
- 9.1.14.1. Company Overview
- 9.1.14.2. Products
- 9.1.14.3. Company Financials
- 9.1.14.4. SWOT Analysis
- 9.1.15 Owens-Illinois Inc
- 9.1.15.1. Company Overview
- 9.1.15.2. Products
- 9.1.15.3. Company Financials
- 9.1.15.4. SWOT Analysis
- 9.1.16 Amcor Ltd
- 9.1.16.1. Company Overview
- 9.1.16.2. Products
- 9.1.16.3. Company Financials
- 9.1.16.4. SWOT Analysis
- 9.1.1 WestRock Company
- 9.2. Market Entropy
- 9.2.1 Company's Key Areas Served
- 9.2.2 Recent Developments
- 9.3. Company Market Share Analysis 2025
- 9.3.1 Top 5 Companies Market Share Analysis
- 9.3.2 Top 3 Companies Market Share Analysis
- 9.4. List of Potential Customers
- 10. Research Methodology
List of Figures
- Figure 1: North America Soft Drinks Packaging Market Revenue Breakdown (billion, %) by Product 2025 & 2033
- Figure 2: North America Soft Drinks Packaging Market Share (%) by Company 2025
List of Tables
- Table 1: North America Soft Drinks Packaging Market Revenue billion Forecast, by Packaging Material Type 2020 & 2033
- Table 2: North America Soft Drinks Packaging Market Revenue billion Forecast, by Product Type 2020 & 2033
- Table 3: North America Soft Drinks Packaging Market Revenue billion Forecast, by Geography 2020 & 2033
- Table 4: North America Soft Drinks Packaging Market Revenue billion Forecast, by Region 2020 & 2033
- Table 5: North America Soft Drinks Packaging Market Revenue billion Forecast, by Packaging Material Type 2020 & 2033
- Table 6: North America Soft Drinks Packaging Market Revenue billion Forecast, by Product Type 2020 & 2033
- Table 7: North America Soft Drinks Packaging Market Revenue billion Forecast, by Geography 2020 & 2033
- Table 8: North America Soft Drinks Packaging Market Revenue billion Forecast, by Country 2020 & 2033
- Table 9: North America Soft Drinks Packaging Market Revenue billion Forecast, by Packaging Material Type 2020 & 2033
- Table 10: North America Soft Drinks Packaging Market Revenue billion Forecast, by Product Type 2020 & 2033
- Table 11: North America Soft Drinks Packaging Market Revenue billion Forecast, by Geography 2020 & 2033
- Table 12: North America Soft Drinks Packaging Market Revenue billion Forecast, by Country 2020 & 2033
Frequently Asked Questions
1. What is the projected Compound Annual Growth Rate (CAGR) of the North America Soft Drinks Packaging Market?
The projected CAGR is approximately 6.57%.
2. Which companies are prominent players in the North America Soft Drinks Packaging Market?
Key companies in the market include WestRock Company, CAN-PACK SA, SIG Combibloc Company Ltd, Ball Corporation, Ardagh Group SA, Alcoa Corporation*List Not Exhaustive, Crown Holdings Inc, Graham Packaging Company, Tetra Pak International, The Scoular Company, Toyo Seikan Group Holdings Ltd, Pactive LLC, Placon Corporation, Genpak LLC, Owens-Illinois Inc, Amcor Ltd.
3. What are the main segments of the North America Soft Drinks Packaging Market?
The market segments include Packaging Material Type, Product Type, Geography.
4. Can you provide details about the market size?
The market size is estimated to be USD 42.16 billion as of 2022.
5. What are some drivers contributing to market growth?
Increasing Soft Drink Consumption; Increased Demand for Convenience Packaging from Consumers.
6. What are the notable trends driving market growth?
The RTD Beverages Segment is Expected to Hold a Significant Market Share.
7. Are there any restraints impacting market growth?
Environmental Concerns Regarding Usage of Plastic; Stringent Government Regulations.
8. Can you provide examples of recent developments in the market?
In May 2021, Ball Corporation announced the availability of the first-of-its-kind Ball Aluminum Cup for soft drinks at major retailers in all 50 states across the United States. The product was made available between May and June for the first time to more than 18,000 food, drug, and mass retailers, including Kroger, Target, Albertsons, CVS, and others. The nationwide retail rollout follows the success of a limited pilot that began in 2019. Since then, the cups have been available in select retailers, restaurants, and major sports and entertainment venues such as Ball Arena in Denver, SoFi Stadium in Inglewood, and Allegiant Stadium in Las Vegas.
9. What pricing options are available for accessing the report?
Pricing options include single-user, multi-user, and enterprise licenses priced at USD 4750, USD 5250, and USD 8750 respectively.
10. Is the market size provided in terms of value or volume?
The market size is provided in terms of value, measured in billion.
11. Are there any specific market keywords associated with the report?
Yes, the market keyword associated with the report is "North America Soft Drinks Packaging Market," which aids in identifying and referencing the specific market segment covered.
12. How do I determine which pricing option suits my needs best?
The pricing options vary based on user requirements and access needs. Individual users may opt for single-user licenses, while businesses requiring broader access may choose multi-user or enterprise licenses for cost-effective access to the report.
13. Are there any additional resources or data provided in the North America Soft Drinks Packaging Market report?
While the report offers comprehensive insights, it's advisable to review the specific contents or supplementary materials provided to ascertain if additional resources or data are available.
14. How can I stay updated on further developments or reports in the North America Soft Drinks Packaging Market?
To stay informed about further developments, trends, and reports in the North America Soft Drinks Packaging Market, consider subscribing to industry newsletters, following relevant companies and organizations, or regularly checking reputable industry news sources and publications.
Methodology
Step 1 - Identification of Relevant Samples Size from Population Database


Step 2 - Approaches for Defining Global Market Size (Value, Volume* & Price*)

Note*: In applicable scenarios
Step 3 - Data Sources
Primary Research
- Web Analytics
- Survey Reports
- Research Institute
- Latest Research Reports
- Opinion Leaders
Secondary Research
- Annual Reports
- White Paper
- Latest Press Release
- Industry Association
- Paid Database
- Investor Presentations

Step 4 - Data Triangulation
Involves using different sources of information in order to increase the validity of a study
These sources are likely to be stakeholders in a program - participants, other researchers, program staff, other community members, and so on.
Then we put all data in single framework & apply various statistical tools to find out the dynamic on the market.
During the analysis stage, feedback from the stakeholder groups would be compared to determine areas of agreement as well as areas of divergence