

Key Insights
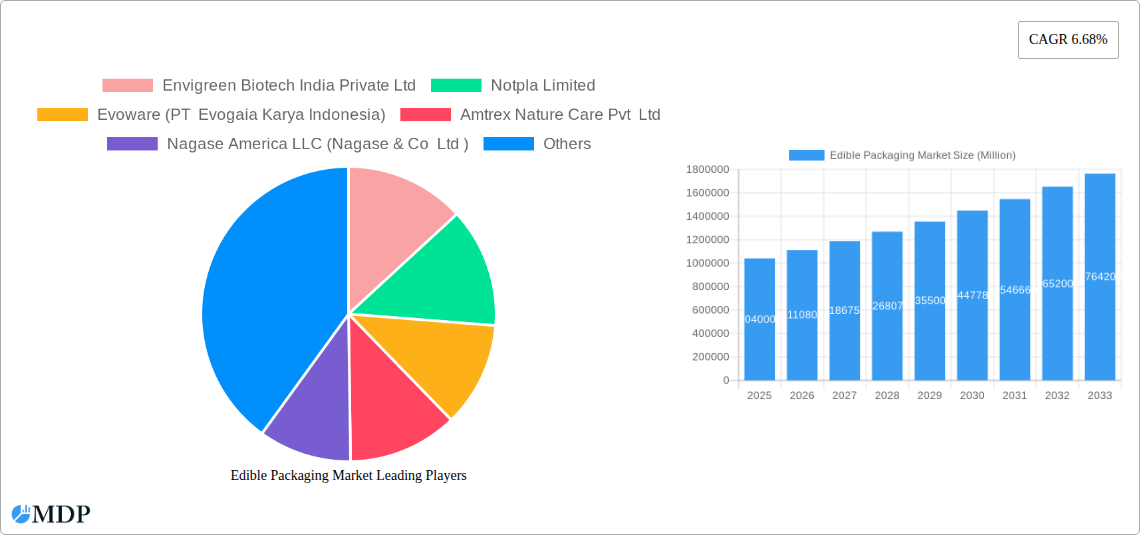
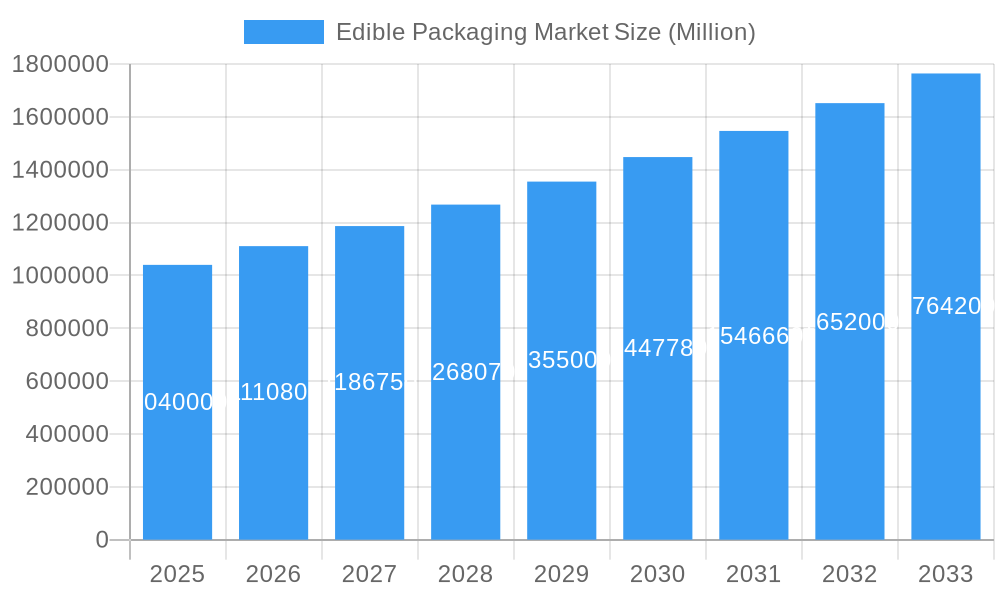
The global edible packaging market is poised for significant expansion, projected to reach an estimated 1.04 million units in 2025 and surge forward with a robust Compound Annual Growth Rate (CAGR) of 6.68% through 2033. This dynamic growth is primarily propelled by an increasing consumer demand for sustainable and eco-friendly packaging alternatives, driven by growing environmental consciousness and stringent regulations against single-use plastics. The market's evolution is further fueled by advancements in material science, leading to the development of innovative edible films and coatings derived from a variety of sources including plants, animals, proteins, polysaccharides, and lipids. These materials offer functional benefits such as extending shelf life and preserving product freshness, making them increasingly attractive for the food and beverage industries. Emerging trends such as personalized nutrition, functional ingredients embedded within packaging, and a shift towards biodegradable solutions are also contributing to market momentum.
Edible Packaging Market Market Size (In Million)
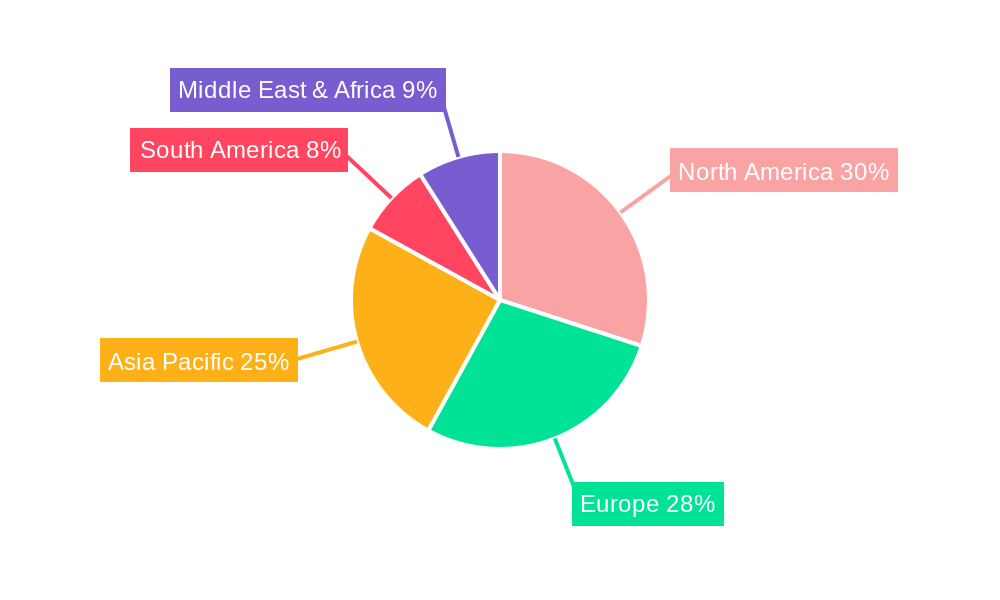
Despite the optimistic outlook, the edible packaging market faces certain restraints. High production costs compared to conventional packaging, challenges in scalability for mass production, and potential consumer acceptance hurdles related to taste, texture, and food safety concerns require continuous innovation and consumer education. The pharmaceutical industry, while showing promise, also presents complex regulatory pathways and stringent quality control demands that can slow adoption. Geographically, North America and Europe are anticipated to lead market share due to established sustainability initiatives and higher disposable incomes, while the Asia Pacific region is expected to exhibit the fastest growth due to its large population, increasing environmental awareness, and a burgeoning food processing sector. Key players like Envigreen Biotech India Private Ltd, Notpla Limited, and Evoware are actively investing in research and development to overcome these challenges and capitalize on the burgeoning opportunities.
Edible Packaging Market Company Market Share
This comprehensive report offers an in-depth analysis of the global edible packaging market, projected to reach $XX Billion by 2033, exhibiting a Compound Annual Growth Rate (CAGR) of XX% from 2025. The study covers the historical period of 2019–2024, the base year of 2025, and forecasts growth through 2033. We delve into the market dynamics, key trends, leading segments, product developments, growth drivers, challenges, emerging opportunities, and the strategic outlook for this rapidly evolving sector. Gain actionable insights into market concentration, innovation, regulatory landscapes, and the competitive strategies of major players like Envigreen Biotech India Private Ltd, Notpla Limited, Evoware (PT Evogaia Karya Indonesia), and many others.
Edible Packaging Market Market Dynamics & Concentration
The edible packaging market is characterized by moderate concentration, with a few key innovators driving significant advancements. Innovation is primarily fueled by the urgent global demand for sustainable packaging solutions, advancements in material science, and a growing consumer preference for eco-friendly products. Regulatory frameworks are increasingly favoring biodegradable and compostable alternatives, creating a fertile ground for edible packaging. However, product substitutes like traditional plastics and other biodegradable materials pose a competitive challenge, necessitating continuous innovation in terms of cost-effectiveness, functionality, and consumer appeal. End-user trends indicate a strong pull from the food and beverage sectors, seeking to reduce plastic waste and enhance brand image. Mergers and acquisition (M&A) activities, while still nascent, are expected to accelerate as larger corporations seek to integrate innovative edible packaging technologies. Currently, the M&A deal count stands at approximately XX significant transactions between 2019 and 2024, with market share distribution showing the top 5 players holding around XX% of the market.
Edible Packaging Market Industry Trends & Analysis
The edible packaging market is poised for significant expansion, driven by a confluence of technological breakthroughs, evolving consumer preferences, and a global imperative to curb plastic pollution. Market growth is robust, with projections indicating a CAGR of XX% through 2033. A key trend is the diversification of raw materials, moving beyond traditional starches to include proteins and lipids, offering enhanced barrier properties and nutritional benefits. Technological advancements are focused on improving the shelf-life, taste neutrality, and mechanical strength of edible films and coatings, making them viable alternatives for a wider range of products. Consumer preferences are increasingly skewed towards convenience and sustainability; hence, edible packaging that eliminates the need for disposal resonates strongly. The competitive landscape is intensifying, with both established packaging manufacturers and agile startups investing heavily in R&D. Market penetration is steadily increasing, particularly in niche applications within the food and beverage industries, where the "zero-waste" aspect offers a distinct competitive advantage. Innovations in encapsulation technologies for active ingredients within edible packaging are also gaining traction, promising extended product freshness and added nutritional value. The pharmaceutical sector is also exploring edible formats for drug delivery systems, further broadening the market's scope. The overall market penetration is currently estimated at XX%, with significant potential for further growth.
Leading Markets & Segments in Edible Packaging Market
The edible packaging market demonstrates a clear dominance in regions and segments driven by strong environmental policies and high consumer awareness regarding plastic waste. The Plant-derived source segment, particularly from sources like corn starch, seaweed, and rice, is leading the market due to its wide availability and cost-effectiveness. Within raw materials, Polysaccharides are the most dominant, forming the backbone of many edible films and coatings. The Food end-user industry holds the largest market share, driven by the immense demand for sustainable packaging for snacks, confectionery, and ready-to-eat meals.
- Dominant Region: North America and Europe are leading markets due to stringent regulations on single-use plastics and high consumer adoption of sustainable products. Government initiatives promoting biodegradable materials and substantial investments in research and development further bolster their leadership.
- Dominant Country: The United States, with its large consumer base and proactive approach to environmental sustainability, is a significant market leader. Supportive economic policies, coupled with a robust innovation ecosystem, contribute to its dominant position.
- Dominant Source: Plant-based edible packaging commands the largest share. This is attributed to the scalability of plant-based raw materials, their versatility, and their perceived natural appeal by consumers.
- Dominant Raw Material: Polysaccharides, such as starch, cellulose, and alginates, are extensively used due to their film-forming properties, affordability, and biodegradability. Their ability to be modified for various applications makes them a preferred choice.
- Dominant End-User Industry: The food industry is the primary consumer of edible packaging, encompassing segments like baked goods, dairy products, confectioneries, and convenience foods. The beverage industry is also a rapidly growing segment, with applications in water sachets and cocktail capsules.
Edible Packaging Market Product Developments
Product innovations in the edible packaging market are rapidly transforming consumer goods. Advancements focus on creating versatile edible films and coatings with enhanced barrier properties against moisture, oxygen, and light. Examples include edible sachets for liquids, biodegradable wrappers for confectionery, and coatings for fruits and vegetables that extend shelf life. The competitive advantage lies in offering novel solutions that are not only sustainable but also improve product freshness and consumer convenience. The integration of active ingredients like antioxidants and antimicrobials within edible packaging further enhances its market fit and appeal.
Key Drivers of Edible Packaging Market Growth
The growth of the edible packaging market is primarily propelled by an intensifying global focus on environmental sustainability and the urgent need to reduce plastic waste. Stringent government regulations worldwide, aimed at phasing out single-use plastics, are creating a significant market pull for eco-friendly alternatives. Technological advancements in material science are enabling the development of more functional, cost-effective, and diverse edible packaging solutions. Furthermore, a rising consumer consciousness regarding environmental impact and a preference for sustainable brands are powerful drivers, encouraging widespread adoption across various end-user industries, especially food and beverages.
Challenges in the Edible Packaging Market Market
Despite its immense potential, the edible packaging market faces several challenges. Regulatory hurdles related to food safety standards for edible materials can slow down market entry. High production costs compared to conventional plastics remain a significant barrier, impacting price competitiveness. Furthermore, limited shelf-life and functional limitations, such as susceptibility to moisture and heat, necessitate ongoing research and development. Supply chain complexities for novel raw materials and consumer acceptance of edibility as a primary packaging feature also present challenges that need to be addressed for widespread adoption.
Emerging Opportunities in Edible Packaging Market
Emerging opportunities in the edible packaging market are centered around technological breakthroughs and strategic market expansion. The development of advanced edible films with improved barrier properties and extended shelf-life will unlock new applications, particularly in the pharmaceutical and medical device sectors. Strategic partnerships between packaging manufacturers, material suppliers, and food and beverage companies are crucial for scaling production and market penetration. Furthermore, exploring untapped emerging markets with growing environmental awareness and consumer demand for sustainable solutions presents a significant growth catalyst.
Leading Players in the Edible Packaging Market Sector
- Envigreen Biotech India Private Ltd
- Notpla Limited
- Evoware (PT Evogaia Karya Indonesia)
- Amtrex Nature Care Pvt Ltd
- Nagase America LLC (Nagase & Co Ltd )
- TSUKIOKA FILM PHARMA CO LTD
- ECOLOTEC LIMITED
- Devro PLC (Saria Nederland BV)
- Tipa Corp Ltd
- JRF Technology LLC
- Glanbia Plc
Key Milestones in Edible Packaging Market Industry
- 2019: Increased R&D investments in seaweed-based edible films and coatings.
- 2020: Launch of innovative edible packaging for single-serve food items in select markets.
- 2021: Stringent regulations on single-use plastics introduced in several key regions, boosting demand for alternatives.
- 2022: Significant advancements in developing edible packaging with improved oxygen and moisture barrier properties.
- 2023: Strategic collaborations between edible packaging startups and major food and beverage conglomerates.
- 2024: Growing interest from the pharmaceutical sector for edible drug delivery systems.
Strategic Outlook for Edible Packaging Market Market
The strategic outlook for the edible packaging market is exceptionally positive, fueled by ongoing innovation and increasing global commitment to sustainability. Growth accelerators include the continuous refinement of material science to enhance functionality and reduce costs, making edible packaging more competitive. Expansion into new end-user industries, beyond food and beverage into pharmaceuticals and cosmetics, will be a key growth lever. Furthermore, strategic partnerships and a focus on consumer education regarding the benefits of edible packaging will be crucial for driving market adoption and solidifying its position as a sustainable packaging solution for the future.
Edible Packaging Market Segmentation
-
1. Source
- 1.1. Plant
- 1.2. Animal
-
2. Raw Material
- 2.1. Protein
- 2.2. Polysaccharides
- 2.3. Lipids
- 2.4. Other Raw Materials
-
3. End-User Industry
- 3.1. Food
- 3.2. Bevergae
- 3.3. Pharmaceutical
Edible Packaging Market Segmentation By Geography
-
1. North America
- 1.1. United States
- 1.2. Canada
- 1.3. Mexico
-
2. South America
- 2.1. Brazil
- 2.2. Argentina
- 2.3. Rest of South America
-
3. Europe
- 3.1. United Kingdom
- 3.2. Germany
- 3.3. France
- 3.4. Italy
- 3.5. Spain
- 3.6. Russia
- 3.7. Benelux
- 3.8. Nordics
- 3.9. Rest of Europe
-
4. Middle East & Africa
- 4.1. Turkey
- 4.2. Israel
- 4.3. GCC
- 4.4. North Africa
- 4.5. South Africa
- 4.6. Rest of Middle East & Africa
-
5. Asia Pacific
- 5.1. China
- 5.2. India
- 5.3. Japan
- 5.4. South Korea
- 5.5. ASEAN
- 5.6. Oceania
- 5.7. Rest of Asia Pacific
Edible Packaging Market Regional Market Share
Geographic Coverage of Edible Packaging Market
Edible Packaging Market REPORT HIGHLIGHTS
| Aspects | Details |
|---|---|
| Study Period | 2020-2034 |
| Base Year | 2025 |
| Estimated Year | 2026 |
| Forecast Period | 2026-2034 |
| Historical Period | 2020-2025 |
| Growth Rate | CAGR of 6.68% from 2020-2034 |
| Segmentation |
|
Table of Contents
- 1. Introduction
- 1.1. Research Scope
- 1.2. Market Segmentation
- 1.3. Research Objective
- 1.4. Definitions and Assumptions
- 2. Executive Summary
- 2.1. Market Snapshot
- 3. Market Dynamics
- 3.1. Market Drivers
- 3.2. Market Restrains
- 3.3. Market Trends
- 3.4. Market Opportunities
- 4. Market Factor Analysis
- 4.1. Porters Five Forces
- 4.1.1. Bargaining Power of Suppliers
- 4.1.2. Bargaining Power of Buyers
- 4.1.3. Threat of New Entrants
- 4.1.4. Threat of Substitutes
- 4.1.5. Competitive Rivalry
- 4.2. PESTEL analysis
- 4.3. BCG Analysis
- 4.3.1. Stars (High Growth, High Market Share)
- 4.3.2. Cash Cows (Low Growth, High Market Share)
- 4.3.3. Question Mark (High Growth, Low Market Share)
- 4.3.4. Dogs (Low Growth, Low Market Share)
- 4.4. Ansoff Matrix Analysis
- 4.5. Supply Chain Analysis
- 4.6. Regulatory Landscape
- 4.7. Current Market Potential and Opportunity Assessment (TAM–SAM–SOM Framework)
- 4.8. MDP Analyst Note
- 4.1. Porters Five Forces
- 5. Market Analysis, Insights and Forecast 2021-2033
- 5.1. Market Analysis, Insights and Forecast - by Source
- 5.1.1. Plant
- 5.1.2. Animal
- 5.2. Market Analysis, Insights and Forecast - by Raw Material
- 5.2.1. Protein
- 5.2.2. Polysaccharides
- 5.2.3. Lipids
- 5.2.4. Other Raw Materials
- 5.3. Market Analysis, Insights and Forecast - by End-User Industry
- 5.3.1. Food
- 5.3.2. Bevergae
- 5.3.3. Pharmaceutical
- 5.4. Market Analysis, Insights and Forecast - by Region
- 5.4.1. North America
- 5.4.2. South America
- 5.4.3. Europe
- 5.4.4. Middle East & Africa
- 5.4.5. Asia Pacific
- 5.1. Market Analysis, Insights and Forecast - by Source
- 6. Global Edible Packaging Market Analysis, Insights and Forecast, 2021-2033
- 6.1. Market Analysis, Insights and Forecast - by Source
- 6.1.1. Plant
- 6.1.2. Animal
- 6.2. Market Analysis, Insights and Forecast - by Raw Material
- 6.2.1. Protein
- 6.2.2. Polysaccharides
- 6.2.3. Lipids
- 6.2.4. Other Raw Materials
- 6.3. Market Analysis, Insights and Forecast - by End-User Industry
- 6.3.1. Food
- 6.3.2. Bevergae
- 6.3.3. Pharmaceutical
- 6.1. Market Analysis, Insights and Forecast - by Source
- 7. North America Edible Packaging Market Analysis, Insights and Forecast, 2020-2032
- 7.1. Market Analysis, Insights and Forecast - by Source
- 7.1.1. Plant
- 7.1.2. Animal
- 7.2. Market Analysis, Insights and Forecast - by Raw Material
- 7.2.1. Protein
- 7.2.2. Polysaccharides
- 7.2.3. Lipids
- 7.2.4. Other Raw Materials
- 7.3. Market Analysis, Insights and Forecast - by End-User Industry
- 7.3.1. Food
- 7.3.2. Bevergae
- 7.3.3. Pharmaceutical
- 7.1. Market Analysis, Insights and Forecast - by Source
- 8. South America Edible Packaging Market Analysis, Insights and Forecast, 2020-2032
- 8.1. Market Analysis, Insights and Forecast - by Source
- 8.1.1. Plant
- 8.1.2. Animal
- 8.2. Market Analysis, Insights and Forecast - by Raw Material
- 8.2.1. Protein
- 8.2.2. Polysaccharides
- 8.2.3. Lipids
- 8.2.4. Other Raw Materials
- 8.3. Market Analysis, Insights and Forecast - by End-User Industry
- 8.3.1. Food
- 8.3.2. Bevergae
- 8.3.3. Pharmaceutical
- 8.1. Market Analysis, Insights and Forecast - by Source
- 9. Europe Edible Packaging Market Analysis, Insights and Forecast, 2020-2032
- 9.1. Market Analysis, Insights and Forecast - by Source
- 9.1.1. Plant
- 9.1.2. Animal
- 9.2. Market Analysis, Insights and Forecast - by Raw Material
- 9.2.1. Protein
- 9.2.2. Polysaccharides
- 9.2.3. Lipids
- 9.2.4. Other Raw Materials
- 9.3. Market Analysis, Insights and Forecast - by End-User Industry
- 9.3.1. Food
- 9.3.2. Bevergae
- 9.3.3. Pharmaceutical
- 9.1. Market Analysis, Insights and Forecast - by Source
- 10. Middle East & Africa Edible Packaging Market Analysis, Insights and Forecast, 2020-2032
- 10.1. Market Analysis, Insights and Forecast - by Source
- 10.1.1. Plant
- 10.1.2. Animal
- 10.2. Market Analysis, Insights and Forecast - by Raw Material
- 10.2.1. Protein
- 10.2.2. Polysaccharides
- 10.2.3. Lipids
- 10.2.4. Other Raw Materials
- 10.3. Market Analysis, Insights and Forecast - by End-User Industry
- 10.3.1. Food
- 10.3.2. Bevergae
- 10.3.3. Pharmaceutical
- 10.1. Market Analysis, Insights and Forecast - by Source
- 11. Asia Pacific Edible Packaging Market Analysis, Insights and Forecast, 2020-2032
- 11.1. Market Analysis, Insights and Forecast - by Source
- 11.1.1. Plant
- 11.1.2. Animal
- 11.2. Market Analysis, Insights and Forecast - by Raw Material
- 11.2.1. Protein
- 11.2.2. Polysaccharides
- 11.2.3. Lipids
- 11.2.4. Other Raw Materials
- 11.3. Market Analysis, Insights and Forecast - by End-User Industry
- 11.3.1. Food
- 11.3.2. Bevergae
- 11.3.3. Pharmaceutical
- 11.1. Market Analysis, Insights and Forecast - by Source
- 12. Competitive Analysis
- 12.1. Company Profiles
- 12.1.1 Envigreen Biotech India Private Ltd
- 12.1.1.1. Company Overview
- 12.1.1.2. Products
- 12.1.1.3. Company Financials
- 12.1.1.4. SWOT Analysis
- 12.1.2 Notpla Limited
- 12.1.2.1. Company Overview
- 12.1.2.2. Products
- 12.1.2.3. Company Financials
- 12.1.2.4. SWOT Analysis
- 12.1.3 Evoware (PT Evogaia Karya Indonesia)
- 12.1.3.1. Company Overview
- 12.1.3.2. Products
- 12.1.3.3. Company Financials
- 12.1.3.4. SWOT Analysis
- 12.1.4 Amtrex Nature Care Pvt Ltd
- 12.1.4.1. Company Overview
- 12.1.4.2. Products
- 12.1.4.3. Company Financials
- 12.1.4.4. SWOT Analysis
- 12.1.5 Nagase America LLC (Nagase & Co Ltd )
- 12.1.5.1. Company Overview
- 12.1.5.2. Products
- 12.1.5.3. Company Financials
- 12.1.5.4. SWOT Analysis
- 12.1.6 TSUKIOKA FILM PHARMA CO LTD
- 12.1.6.1. Company Overview
- 12.1.6.2. Products
- 12.1.6.3. Company Financials
- 12.1.6.4. SWOT Analysis
- 12.1.7 ECOLOTEC LIMITED
- 12.1.7.1. Company Overview
- 12.1.7.2. Products
- 12.1.7.3. Company Financials
- 12.1.7.4. SWOT Analysis
- 12.1.8 Devro PLC (Saria Nederland BV)
- 12.1.8.1. Company Overview
- 12.1.8.2. Products
- 12.1.8.3. Company Financials
- 12.1.8.4. SWOT Analysis
- 12.1.9 Tipa Corp Ltd
- 12.1.9.1. Company Overview
- 12.1.9.2. Products
- 12.1.9.3. Company Financials
- 12.1.9.4. SWOT Analysis
- 12.1.10 JRF Technology LLC
- 12.1.10.1. Company Overview
- 12.1.10.2. Products
- 12.1.10.3. Company Financials
- 12.1.10.4. SWOT Analysis
- 12.1.11 Glanbia Plc
- 12.1.11.1. Company Overview
- 12.1.11.2. Products
- 12.1.11.3. Company Financials
- 12.1.11.4. SWOT Analysis
- 12.1.1 Envigreen Biotech India Private Ltd
- 12.2. Market Entropy
- 12.2.1 Company's Key Areas Served
- 12.2.2 Recent Developments
- 12.3. Company Market Share Analysis 2025
- 12.3.1 Top 5 Companies Market Share Analysis
- 12.3.2 Top 3 Companies Market Share Analysis
- 12.4. List of Potential Customers
- 13. Research Methodology
List of Figures
- Figure 1: Global Edible Packaging Market Revenue Breakdown (Million, %) by Region 2025 & 2033
- Figure 2: Global Edible Packaging Market Volume Breakdown (K Tons, %) by Region 2025 & 2033
- Figure 3: North America Edible Packaging Market Revenue (Million), by Source 2025 & 2033
- Figure 4: North America Edible Packaging Market Volume (K Tons), by Source 2025 & 2033
- Figure 5: North America Edible Packaging Market Revenue Share (%), by Source 2025 & 2033
- Figure 6: North America Edible Packaging Market Volume Share (%), by Source 2025 & 2033
- Figure 7: North America Edible Packaging Market Revenue (Million), by Raw Material 2025 & 2033
- Figure 8: North America Edible Packaging Market Volume (K Tons), by Raw Material 2025 & 2033
- Figure 9: North America Edible Packaging Market Revenue Share (%), by Raw Material 2025 & 2033
- Figure 10: North America Edible Packaging Market Volume Share (%), by Raw Material 2025 & 2033
- Figure 11: North America Edible Packaging Market Revenue (Million), by End-User Industry 2025 & 2033
- Figure 12: North America Edible Packaging Market Volume (K Tons), by End-User Industry 2025 & 2033
- Figure 13: North America Edible Packaging Market Revenue Share (%), by End-User Industry 2025 & 2033
- Figure 14: North America Edible Packaging Market Volume Share (%), by End-User Industry 2025 & 2033
- Figure 15: North America Edible Packaging Market Revenue (Million), by Country 2025 & 2033
- Figure 16: North America Edible Packaging Market Volume (K Tons), by Country 2025 & 2033
- Figure 17: North America Edible Packaging Market Revenue Share (%), by Country 2025 & 2033
- Figure 18: North America Edible Packaging Market Volume Share (%), by Country 2025 & 2033
- Figure 19: South America Edible Packaging Market Revenue (Million), by Source 2025 & 2033
- Figure 20: South America Edible Packaging Market Volume (K Tons), by Source 2025 & 2033
- Figure 21: South America Edible Packaging Market Revenue Share (%), by Source 2025 & 2033
- Figure 22: South America Edible Packaging Market Volume Share (%), by Source 2025 & 2033
- Figure 23: South America Edible Packaging Market Revenue (Million), by Raw Material 2025 & 2033
- Figure 24: South America Edible Packaging Market Volume (K Tons), by Raw Material 2025 & 2033
- Figure 25: South America Edible Packaging Market Revenue Share (%), by Raw Material 2025 & 2033
- Figure 26: South America Edible Packaging Market Volume Share (%), by Raw Material 2025 & 2033
- Figure 27: South America Edible Packaging Market Revenue (Million), by End-User Industry 2025 & 2033
- Figure 28: South America Edible Packaging Market Volume (K Tons), by End-User Industry 2025 & 2033
- Figure 29: South America Edible Packaging Market Revenue Share (%), by End-User Industry 2025 & 2033
- Figure 30: South America Edible Packaging Market Volume Share (%), by End-User Industry 2025 & 2033
- Figure 31: South America Edible Packaging Market Revenue (Million), by Country 2025 & 2033
- Figure 32: South America Edible Packaging Market Volume (K Tons), by Country 2025 & 2033
- Figure 33: South America Edible Packaging Market Revenue Share (%), by Country 2025 & 2033
- Figure 34: South America Edible Packaging Market Volume Share (%), by Country 2025 & 2033
- Figure 35: Europe Edible Packaging Market Revenue (Million), by Source 2025 & 2033
- Figure 36: Europe Edible Packaging Market Volume (K Tons), by Source 2025 & 2033
- Figure 37: Europe Edible Packaging Market Revenue Share (%), by Source 2025 & 2033
- Figure 38: Europe Edible Packaging Market Volume Share (%), by Source 2025 & 2033
- Figure 39: Europe Edible Packaging Market Revenue (Million), by Raw Material 2025 & 2033
- Figure 40: Europe Edible Packaging Market Volume (K Tons), by Raw Material 2025 & 2033
- Figure 41: Europe Edible Packaging Market Revenue Share (%), by Raw Material 2025 & 2033
- Figure 42: Europe Edible Packaging Market Volume Share (%), by Raw Material 2025 & 2033
- Figure 43: Europe Edible Packaging Market Revenue (Million), by End-User Industry 2025 & 2033
- Figure 44: Europe Edible Packaging Market Volume (K Tons), by End-User Industry 2025 & 2033
- Figure 45: Europe Edible Packaging Market Revenue Share (%), by End-User Industry 2025 & 2033
- Figure 46: Europe Edible Packaging Market Volume Share (%), by End-User Industry 2025 & 2033
- Figure 47: Europe Edible Packaging Market Revenue (Million), by Country 2025 & 2033
- Figure 48: Europe Edible Packaging Market Volume (K Tons), by Country 2025 & 2033
- Figure 49: Europe Edible Packaging Market Revenue Share (%), by Country 2025 & 2033
- Figure 50: Europe Edible Packaging Market Volume Share (%), by Country 2025 & 2033
- Figure 51: Middle East & Africa Edible Packaging Market Revenue (Million), by Source 2025 & 2033
- Figure 52: Middle East & Africa Edible Packaging Market Volume (K Tons), by Source 2025 & 2033
- Figure 53: Middle East & Africa Edible Packaging Market Revenue Share (%), by Source 2025 & 2033
- Figure 54: Middle East & Africa Edible Packaging Market Volume Share (%), by Source 2025 & 2033
- Figure 55: Middle East & Africa Edible Packaging Market Revenue (Million), by Raw Material 2025 & 2033
- Figure 56: Middle East & Africa Edible Packaging Market Volume (K Tons), by Raw Material 2025 & 2033
- Figure 57: Middle East & Africa Edible Packaging Market Revenue Share (%), by Raw Material 2025 & 2033
- Figure 58: Middle East & Africa Edible Packaging Market Volume Share (%), by Raw Material 2025 & 2033
- Figure 59: Middle East & Africa Edible Packaging Market Revenue (Million), by End-User Industry 2025 & 2033
- Figure 60: Middle East & Africa Edible Packaging Market Volume (K Tons), by End-User Industry 2025 & 2033
- Figure 61: Middle East & Africa Edible Packaging Market Revenue Share (%), by End-User Industry 2025 & 2033
- Figure 62: Middle East & Africa Edible Packaging Market Volume Share (%), by End-User Industry 2025 & 2033
- Figure 63: Middle East & Africa Edible Packaging Market Revenue (Million), by Country 2025 & 2033
- Figure 64: Middle East & Africa Edible Packaging Market Volume (K Tons), by Country 2025 & 2033
- Figure 65: Middle East & Africa Edible Packaging Market Revenue Share (%), by Country 2025 & 2033
- Figure 66: Middle East & Africa Edible Packaging Market Volume Share (%), by Country 2025 & 2033
- Figure 67: Asia Pacific Edible Packaging Market Revenue (Million), by Source 2025 & 2033
- Figure 68: Asia Pacific Edible Packaging Market Volume (K Tons), by Source 2025 & 2033
- Figure 69: Asia Pacific Edible Packaging Market Revenue Share (%), by Source 2025 & 2033
- Figure 70: Asia Pacific Edible Packaging Market Volume Share (%), by Source 2025 & 2033
- Figure 71: Asia Pacific Edible Packaging Market Revenue (Million), by Raw Material 2025 & 2033
- Figure 72: Asia Pacific Edible Packaging Market Volume (K Tons), by Raw Material 2025 & 2033
- Figure 73: Asia Pacific Edible Packaging Market Revenue Share (%), by Raw Material 2025 & 2033
- Figure 74: Asia Pacific Edible Packaging Market Volume Share (%), by Raw Material 2025 & 2033
- Figure 75: Asia Pacific Edible Packaging Market Revenue (Million), by End-User Industry 2025 & 2033
- Figure 76: Asia Pacific Edible Packaging Market Volume (K Tons), by End-User Industry 2025 & 2033
- Figure 77: Asia Pacific Edible Packaging Market Revenue Share (%), by End-User Industry 2025 & 2033
- Figure 78: Asia Pacific Edible Packaging Market Volume Share (%), by End-User Industry 2025 & 2033
- Figure 79: Asia Pacific Edible Packaging Market Revenue (Million), by Country 2025 & 2033
- Figure 80: Asia Pacific Edible Packaging Market Volume (K Tons), by Country 2025 & 2033
- Figure 81: Asia Pacific Edible Packaging Market Revenue Share (%), by Country 2025 & 2033
- Figure 82: Asia Pacific Edible Packaging Market Volume Share (%), by Country 2025 & 2033
List of Tables
- Table 1: Global Edible Packaging Market Revenue Million Forecast, by Source 2020 & 2033
- Table 2: Global Edible Packaging Market Volume K Tons Forecast, by Source 2020 & 2033
- Table 3: Global Edible Packaging Market Revenue Million Forecast, by Raw Material 2020 & 2033
- Table 4: Global Edible Packaging Market Volume K Tons Forecast, by Raw Material 2020 & 2033
- Table 5: Global Edible Packaging Market Revenue Million Forecast, by End-User Industry 2020 & 2033
- Table 6: Global Edible Packaging Market Volume K Tons Forecast, by End-User Industry 2020 & 2033
- Table 7: Global Edible Packaging Market Revenue Million Forecast, by Region 2020 & 2033
- Table 8: Global Edible Packaging Market Volume K Tons Forecast, by Region 2020 & 2033
- Table 9: Global Edible Packaging Market Revenue Million Forecast, by Source 2020 & 2033
- Table 10: Global Edible Packaging Market Volume K Tons Forecast, by Source 2020 & 2033
- Table 11: Global Edible Packaging Market Revenue Million Forecast, by Raw Material 2020 & 2033
- Table 12: Global Edible Packaging Market Volume K Tons Forecast, by Raw Material 2020 & 2033
- Table 13: Global Edible Packaging Market Revenue Million Forecast, by End-User Industry 2020 & 2033
- Table 14: Global Edible Packaging Market Volume K Tons Forecast, by End-User Industry 2020 & 2033
- Table 15: Global Edible Packaging Market Revenue Million Forecast, by Country 2020 & 2033
- Table 16: Global Edible Packaging Market Volume K Tons Forecast, by Country 2020 & 2033
- Table 17: United States Edible Packaging Market Revenue (Million) Forecast, by Application 2020 & 2033
- Table 18: United States Edible Packaging Market Volume (K Tons) Forecast, by Application 2020 & 2033
- Table 19: Canada Edible Packaging Market Revenue (Million) Forecast, by Application 2020 & 2033
- Table 20: Canada Edible Packaging Market Volume (K Tons) Forecast, by Application 2020 & 2033
- Table 21: Mexico Edible Packaging Market Revenue (Million) Forecast, by Application 2020 & 2033
- Table 22: Mexico Edible Packaging Market Volume (K Tons) Forecast, by Application 2020 & 2033
- Table 23: Global Edible Packaging Market Revenue Million Forecast, by Source 2020 & 2033
- Table 24: Global Edible Packaging Market Volume K Tons Forecast, by Source 2020 & 2033
- Table 25: Global Edible Packaging Market Revenue Million Forecast, by Raw Material 2020 & 2033
- Table 26: Global Edible Packaging Market Volume K Tons Forecast, by Raw Material 2020 & 2033
- Table 27: Global Edible Packaging Market Revenue Million Forecast, by End-User Industry 2020 & 2033
- Table 28: Global Edible Packaging Market Volume K Tons Forecast, by End-User Industry 2020 & 2033
- Table 29: Global Edible Packaging Market Revenue Million Forecast, by Country 2020 & 2033
- Table 30: Global Edible Packaging Market Volume K Tons Forecast, by Country 2020 & 2033
- Table 31: Brazil Edible Packaging Market Revenue (Million) Forecast, by Application 2020 & 2033
- Table 32: Brazil Edible Packaging Market Volume (K Tons) Forecast, by Application 2020 & 2033
- Table 33: Argentina Edible Packaging Market Revenue (Million) Forecast, by Application 2020 & 2033
- Table 34: Argentina Edible Packaging Market Volume (K Tons) Forecast, by Application 2020 & 2033
- Table 35: Rest of South America Edible Packaging Market Revenue (Million) Forecast, by Application 2020 & 2033
- Table 36: Rest of South America Edible Packaging Market Volume (K Tons) Forecast, by Application 2020 & 2033
- Table 37: Global Edible Packaging Market Revenue Million Forecast, by Source 2020 & 2033
- Table 38: Global Edible Packaging Market Volume K Tons Forecast, by Source 2020 & 2033
- Table 39: Global Edible Packaging Market Revenue Million Forecast, by Raw Material 2020 & 2033
- Table 40: Global Edible Packaging Market Volume K Tons Forecast, by Raw Material 2020 & 2033
- Table 41: Global Edible Packaging Market Revenue Million Forecast, by End-User Industry 2020 & 2033
- Table 42: Global Edible Packaging Market Volume K Tons Forecast, by End-User Industry 2020 & 2033
- Table 43: Global Edible Packaging Market Revenue Million Forecast, by Country 2020 & 2033
- Table 44: Global Edible Packaging Market Volume K Tons Forecast, by Country 2020 & 2033
- Table 45: United Kingdom Edible Packaging Market Revenue (Million) Forecast, by Application 2020 & 2033
- Table 46: United Kingdom Edible Packaging Market Volume (K Tons) Forecast, by Application 2020 & 2033
- Table 47: Germany Edible Packaging Market Revenue (Million) Forecast, by Application 2020 & 2033
- Table 48: Germany Edible Packaging Market Volume (K Tons) Forecast, by Application 2020 & 2033
- Table 49: France Edible Packaging Market Revenue (Million) Forecast, by Application 2020 & 2033
- Table 50: France Edible Packaging Market Volume (K Tons) Forecast, by Application 2020 & 2033
- Table 51: Italy Edible Packaging Market Revenue (Million) Forecast, by Application 2020 & 2033
- Table 52: Italy Edible Packaging Market Volume (K Tons) Forecast, by Application 2020 & 2033
- Table 53: Spain Edible Packaging Market Revenue (Million) Forecast, by Application 2020 & 2033
- Table 54: Spain Edible Packaging Market Volume (K Tons) Forecast, by Application 2020 & 2033
- Table 55: Russia Edible Packaging Market Revenue (Million) Forecast, by Application 2020 & 2033
- Table 56: Russia Edible Packaging Market Volume (K Tons) Forecast, by Application 2020 & 2033
- Table 57: Benelux Edible Packaging Market Revenue (Million) Forecast, by Application 2020 & 2033
- Table 58: Benelux Edible Packaging Market Volume (K Tons) Forecast, by Application 2020 & 2033
- Table 59: Nordics Edible Packaging Market Revenue (Million) Forecast, by Application 2020 & 2033
- Table 60: Nordics Edible Packaging Market Volume (K Tons) Forecast, by Application 2020 & 2033
- Table 61: Rest of Europe Edible Packaging Market Revenue (Million) Forecast, by Application 2020 & 2033
- Table 62: Rest of Europe Edible Packaging Market Volume (K Tons) Forecast, by Application 2020 & 2033
- Table 63: Global Edible Packaging Market Revenue Million Forecast, by Source 2020 & 2033
- Table 64: Global Edible Packaging Market Volume K Tons Forecast, by Source 2020 & 2033
- Table 65: Global Edible Packaging Market Revenue Million Forecast, by Raw Material 2020 & 2033
- Table 66: Global Edible Packaging Market Volume K Tons Forecast, by Raw Material 2020 & 2033
- Table 67: Global Edible Packaging Market Revenue Million Forecast, by End-User Industry 2020 & 2033
- Table 68: Global Edible Packaging Market Volume K Tons Forecast, by End-User Industry 2020 & 2033
- Table 69: Global Edible Packaging Market Revenue Million Forecast, by Country 2020 & 2033
- Table 70: Global Edible Packaging Market Volume K Tons Forecast, by Country 2020 & 2033
- Table 71: Turkey Edible Packaging Market Revenue (Million) Forecast, by Application 2020 & 2033
- Table 72: Turkey Edible Packaging Market Volume (K Tons) Forecast, by Application 2020 & 2033
- Table 73: Israel Edible Packaging Market Revenue (Million) Forecast, by Application 2020 & 2033
- Table 74: Israel Edible Packaging Market Volume (K Tons) Forecast, by Application 2020 & 2033
- Table 75: GCC Edible Packaging Market Revenue (Million) Forecast, by Application 2020 & 2033
- Table 76: GCC Edible Packaging Market Volume (K Tons) Forecast, by Application 2020 & 2033
- Table 77: North Africa Edible Packaging Market Revenue (Million) Forecast, by Application 2020 & 2033
- Table 78: North Africa Edible Packaging Market Volume (K Tons) Forecast, by Application 2020 & 2033
- Table 79: South Africa Edible Packaging Market Revenue (Million) Forecast, by Application 2020 & 2033
- Table 80: South Africa Edible Packaging Market Volume (K Tons) Forecast, by Application 2020 & 2033
- Table 81: Rest of Middle East & Africa Edible Packaging Market Revenue (Million) Forecast, by Application 2020 & 2033
- Table 82: Rest of Middle East & Africa Edible Packaging Market Volume (K Tons) Forecast, by Application 2020 & 2033
- Table 83: Global Edible Packaging Market Revenue Million Forecast, by Source 2020 & 2033
- Table 84: Global Edible Packaging Market Volume K Tons Forecast, by Source 2020 & 2033
- Table 85: Global Edible Packaging Market Revenue Million Forecast, by Raw Material 2020 & 2033
- Table 86: Global Edible Packaging Market Volume K Tons Forecast, by Raw Material 2020 & 2033
- Table 87: Global Edible Packaging Market Revenue Million Forecast, by End-User Industry 2020 & 2033
- Table 88: Global Edible Packaging Market Volume K Tons Forecast, by End-User Industry 2020 & 2033
- Table 89: Global Edible Packaging Market Revenue Million Forecast, by Country 2020 & 2033
- Table 90: Global Edible Packaging Market Volume K Tons Forecast, by Country 2020 & 2033
- Table 91: China Edible Packaging Market Revenue (Million) Forecast, by Application 2020 & 2033
- Table 92: China Edible Packaging Market Volume (K Tons) Forecast, by Application 2020 & 2033
- Table 93: India Edible Packaging Market Revenue (Million) Forecast, by Application 2020 & 2033
- Table 94: India Edible Packaging Market Volume (K Tons) Forecast, by Application 2020 & 2033
- Table 95: Japan Edible Packaging Market Revenue (Million) Forecast, by Application 2020 & 2033
- Table 96: Japan Edible Packaging Market Volume (K Tons) Forecast, by Application 2020 & 2033
- Table 97: South Korea Edible Packaging Market Revenue (Million) Forecast, by Application 2020 & 2033
- Table 98: South Korea Edible Packaging Market Volume (K Tons) Forecast, by Application 2020 & 2033
- Table 99: ASEAN Edible Packaging Market Revenue (Million) Forecast, by Application 2020 & 2033
- Table 100: ASEAN Edible Packaging Market Volume (K Tons) Forecast, by Application 2020 & 2033
- Table 101: Oceania Edible Packaging Market Revenue (Million) Forecast, by Application 2020 & 2033
- Table 102: Oceania Edible Packaging Market Volume (K Tons) Forecast, by Application 2020 & 2033
- Table 103: Rest of Asia Pacific Edible Packaging Market Revenue (Million) Forecast, by Application 2020 & 2033
- Table 104: Rest of Asia Pacific Edible Packaging Market Volume (K Tons) Forecast, by Application 2020 & 2033
Frequently Asked Questions
1. What is the projected Compound Annual Growth Rate (CAGR) of the Edible Packaging Market?
The projected CAGR is approximately 6.68%.
2. Which companies are prominent players in the Edible Packaging Market?
Key companies in the market include Envigreen Biotech India Private Ltd, Notpla Limited, Evoware (PT Evogaia Karya Indonesia), Amtrex Nature Care Pvt Ltd, Nagase America LLC (Nagase & Co Ltd ), TSUKIOKA FILM PHARMA CO LTD, ECOLOTEC LIMITED, Devro PLC (Saria Nederland BV), Tipa Corp Ltd, JRF Technology LLC, Glanbia Plc.
3. What are the main segments of the Edible Packaging Market?
The market segments include Source, Raw Material, End-User Industry.
4. Can you provide details about the market size?
The market size is estimated to be USD 1.04 Million as of 2022.
5. What are some drivers contributing to market growth?
Need to Eliminate Type Waste Cycle and Increase Shelf-Life of the Product; Ban on Single-Use-Plastic and Growing Sustainability Concern.
6. What are the notable trends driving market growth?
The Increasing Demand for Sustainable Solutions and the Need for Extended Product Shelf-Life are helping drive market growth.
7. Are there any restraints impacting market growth?
High Cost of Production.
8. Can you provide examples of recent developments in the market?
N/A
9. What pricing options are available for accessing the report?
Pricing options include single-user, multi-user, and enterprise licenses priced at USD 4750, USD 5250, and USD 8750 respectively.
10. Is the market size provided in terms of value or volume?
The market size is provided in terms of value, measured in Million and volume, measured in K Tons.
11. Are there any specific market keywords associated with the report?
Yes, the market keyword associated with the report is "Edible Packaging Market," which aids in identifying and referencing the specific market segment covered.
12. How do I determine which pricing option suits my needs best?
The pricing options vary based on user requirements and access needs. Individual users may opt for single-user licenses, while businesses requiring broader access may choose multi-user or enterprise licenses for cost-effective access to the report.
13. Are there any additional resources or data provided in the Edible Packaging Market report?
While the report offers comprehensive insights, it's advisable to review the specific contents or supplementary materials provided to ascertain if additional resources or data are available.
14. How can I stay updated on further developments or reports in the Edible Packaging Market?
To stay informed about further developments, trends, and reports in the Edible Packaging Market, consider subscribing to industry newsletters, following relevant companies and organizations, or regularly checking reputable industry news sources and publications.
Methodology
Step 1 - Identification of Relevant Samples Size from Population Database


Step 2 - Approaches for Defining Global Market Size (Value, Volume* & Price*)

Note*: In applicable scenarios
Step 3 - Data Sources
Primary Research
- Web Analytics
- Survey Reports
- Research Institute
- Latest Research Reports
- Opinion Leaders
Secondary Research
- Annual Reports
- White Paper
- Latest Press Release
- Industry Association
- Paid Database
- Investor Presentations

Step 4 - Data Triangulation
Involves using different sources of information in order to increase the validity of a study
These sources are likely to be stakeholders in a program - participants, other researchers, program staff, other community members, and so on.
Then we put all data in single framework & apply various statistical tools to find out the dynamic on the market.
During the analysis stage, feedback from the stakeholder groups would be compared to determine areas of agreement as well as areas of divergence