

Key Insights
The US dairy packaging market is poised for robust growth, projected to reach $36.45 billion in 2025. This expansion is fueled by a steady Compound Annual Growth Rate (CAGR) of 5.2% over the forecast period from 2025 to 2033. Key drivers for this upward trajectory include the increasing consumer demand for convenient and portable dairy products, a growing preference for sustainable packaging solutions, and ongoing innovation in packaging materials and designs. The market is witnessing a significant shift towards eco-friendly options, with paper and paperboard, along with enhanced plastic formulations, gaining prominence. Furthermore, the rising popularity of value-added dairy products like Greek yogurt and specialty cheeses, which often require specialized packaging to maintain freshness and extend shelf life, is contributing to market expansion. The dynamic nature of consumer preferences and the relentless pursuit of product differentiation among dairy manufacturers are continuously shaping the landscape of dairy packaging.
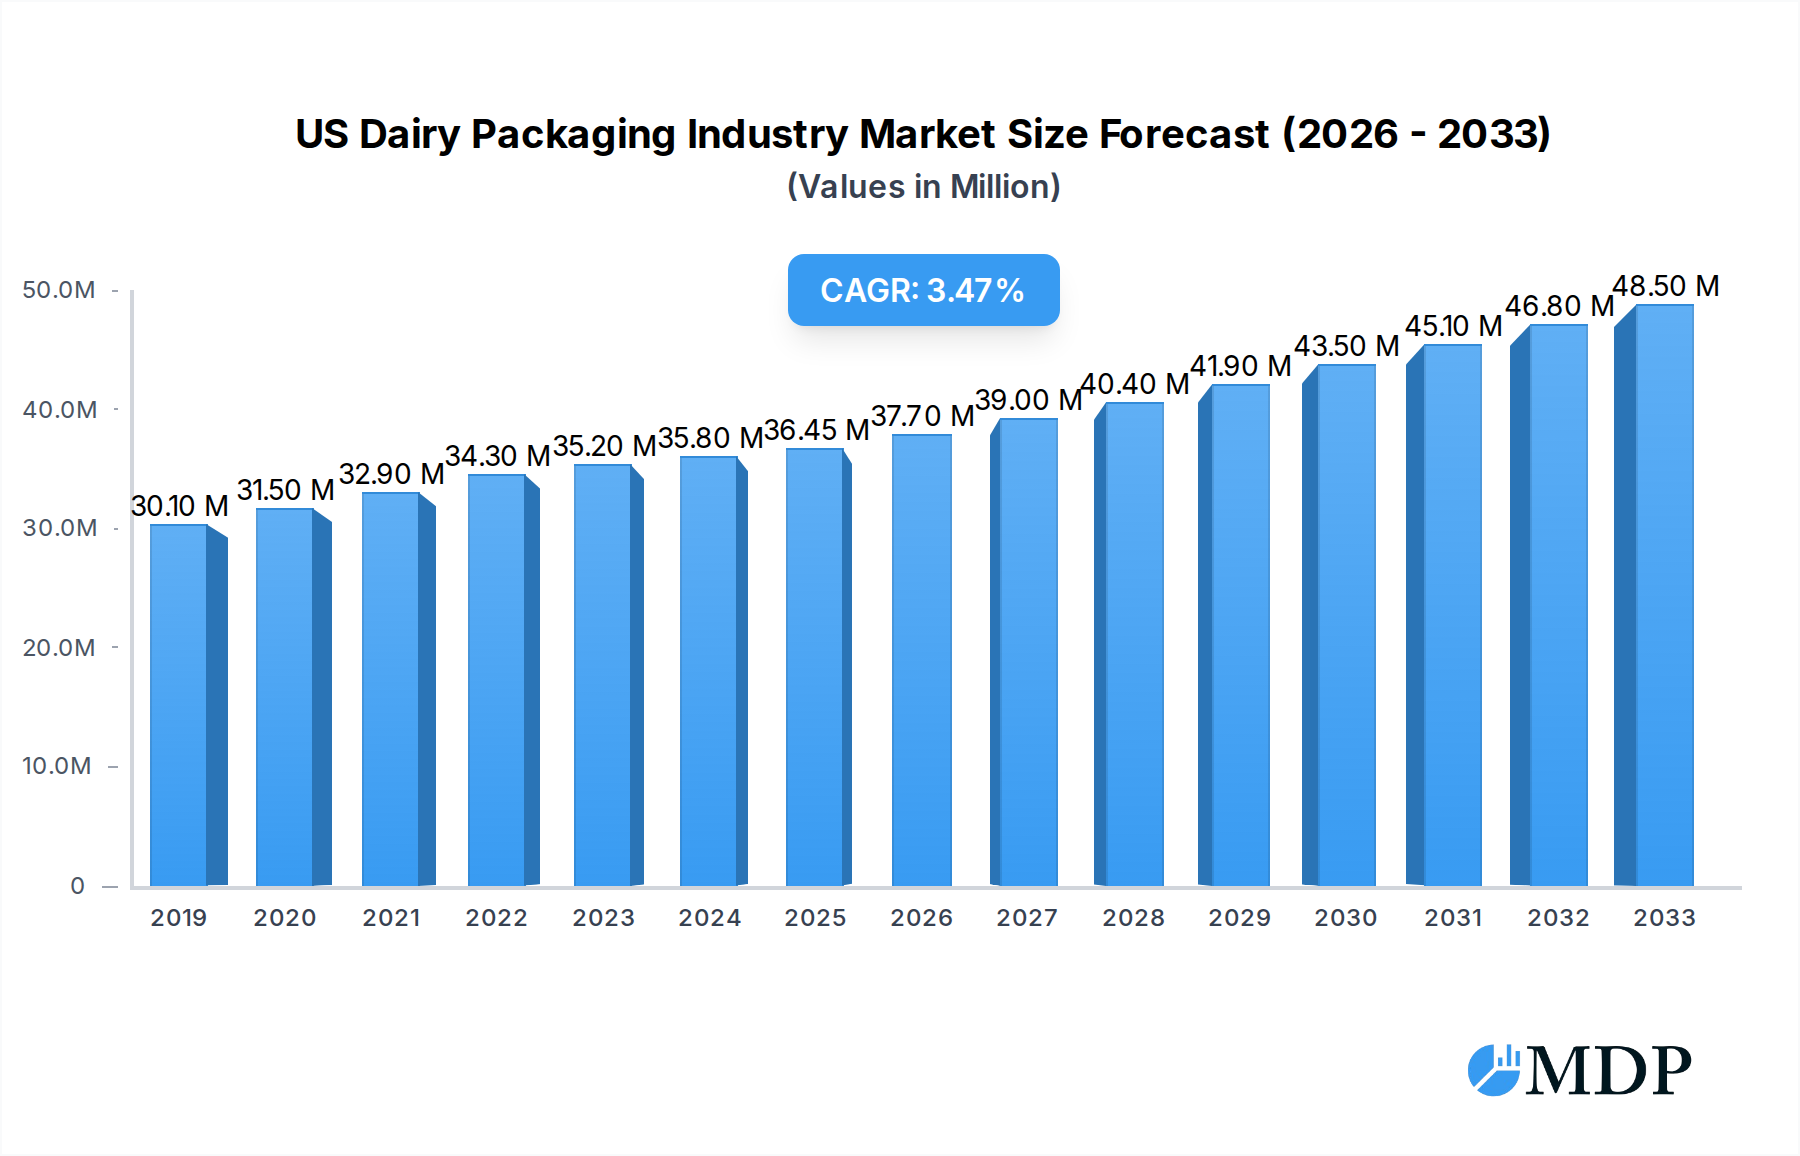
US Dairy Packaging Industry Market Size (In Million)
The US dairy packaging industry is segmented across diverse material types, product categories, and packaging formats, offering a comprehensive market for various stakeholders. Dominant material types include plastic, which benefits from its versatility and cost-effectiveness, and paper and paperboard, increasingly favored for its recyclability and biodegradability. In terms of product types, milk remains a significant segment, but the growth in cheese, frozen dairy products, and cultured products is noteworthy. Packaging types such as cartons and boxes, along with pouches, are experiencing increased adoption due to their functional benefits and consumer appeal. Leading companies like Amcor Plc, Berry Global Group Inc., and Tetra Pak International SA are actively innovating and expanding their offerings to cater to these evolving market demands. The competitive landscape is characterized by strategic partnerships, mergers, and acquisitions aimed at enhancing market reach and technological capabilities.

US Dairy Packaging Industry Company Market Share
Unveiling the Future of Dairy Packaging: A Comprehensive US Market Report
This in-depth report provides an unparalleled analysis of the US Dairy Packaging Industry, a multi-billion dollar sector crucial for the preservation, distribution, and market appeal of dairy products. With a projected market size exceeding USD 50 billion by 2033, this study navigates the intricate landscape of materials, products, and packaging types, offering critical insights for manufacturers, suppliers, dairy producers, and investors. Examining the period from 2019 to 2033, with a base year of 2025, this report delves into market dynamics, trends, leading segments, product innovations, growth drivers, challenges, opportunities, and the strategic outlook for this vital industry.
US Dairy Packaging Industry Market Dynamics & Concentration
The US dairy packaging market, valued at an estimated USD 35 billion in the base year of 2025, exhibits a moderate level of concentration, with several key players dominating specific segments. Innovation serves as a primary driver, fueled by increasing consumer demand for sustainable, convenient, and functional packaging solutions. Regulatory frameworks, particularly those concerning food safety and environmental impact, significantly influence material choices and design. Product substitutes, such as alternative protein beverages impacting traditional dairy consumption, indirectly affect packaging demand. End-user trends, including the rise of e-commerce and a growing preference for single-serve formats, are reshaping packaging requirements. Mergers and acquisition (M&A) activities, while not as high in volume as in some other sectors, strategically consolidate market share and expand capabilities. For instance, a recent undisclosed M&A deal in the flexible packaging segment involving two mid-sized players aimed to bolster their sustainable offerings and broaden their customer base. The market share distribution currently sees plastic dominating with over 60% share, followed by paper and paperboard. The M&A deal count for the historical period of 2019-2024 averaged 3-4 significant transactions annually, primarily focused on enhancing sustainability and expanding geographical reach.
- Key Concentration Factors:
- Dominance of a few large, integrated packaging manufacturers.
- Strategic consolidation through M&A to gain market share and technological expertise.
- Regional specialization in production and distribution.
- Innovation Drivers:
- Demand for recyclable and biodegradable materials.
- Development of barrier technologies for extended shelf life.
- Smart packaging solutions for traceability and consumer engagement.
- Regulatory Frameworks:
- FDA regulations for food contact materials.
- State and federal initiatives promoting plastic reduction and recycling.
- Extended Producer Responsibility (EPR) schemes influencing packaging design.
- Product Substitutes' Impact:
- Growth of plant-based milk alternatives influencing packaging material diversification.
- Shifting consumer preferences impacting demand for traditional dairy packaging formats.
- End-User Trends:
- Growth of direct-to-consumer (DTC) models requiring robust and convenient packaging.
- Preference for portion-controlled and grab-and-go dairy products.
- M&A Activities:
- Acquisitions aimed at acquiring sustainable technology or market access.
- Consolidation to achieve economies of scale and operational efficiencies.
- Key M&A activities in the historical period focused on companies with strong portfolios in PET and paperboard packaging.
US Dairy Packaging Industry Industry Trends & Analysis
The US Dairy Packaging Industry is experiencing robust growth, projected to achieve a Compound Annual Growth Rate (CAGR) of approximately 4.5% during the forecast period of 2025–2033. This expansion is primarily driven by escalating consumer demand for dairy products, coupled with an increasing emphasis on packaging that offers enhanced functionality, convenience, and environmental sustainability. The market penetration of advanced packaging technologies, such as those incorporating recycled content and improved barrier properties, is steadily rising, catering to both consumer preferences and regulatory mandates. Technological disruptions are continually reshaping the industry, with a significant focus on lightweighting materials to reduce transportation costs and environmental footprints. Innovations in plastic packaging, particularly the development of advanced PET (Polyethylene Terephthalate) solutions with superior barrier properties, are gaining traction. The integration of digital technologies for enhanced traceability and consumer interaction through smart packaging is another burgeoning trend. Consumer preferences are a pivotal force, with a pronounced shift towards packaging that is not only aesthetically appealing but also demonstrably eco-friendly. This includes a demand for easily recyclable materials, reduced plastic usage, and the adoption of circular economy principles. Competitive dynamics are intensifying, with both established players and new entrants vying for market share through product innovation, strategic partnerships, and aggressive marketing strategies. Companies are investing heavily in research and development to stay ahead of evolving consumer expectations and to comply with stringent environmental regulations. The market penetration of sustainable packaging solutions has seen a significant uptick, now estimated at over 25% of the total market share in 2025, a figure expected to rise considerably. The adoption of paper-based packaging alternatives for certain dairy products is also gaining momentum, driven by sustainability initiatives and consumer perception. The development of sophisticated closure systems for enhanced product safety and extended shelf life is another critical trend. The market value is anticipated to surpass USD 50 billion by 2033, reflecting sustained demand and industry evolution.
Leading Markets & Segments in US Dairy Packaging Industry
The US Dairy Packaging Industry is characterized by the dominance of specific segments and regions, driven by a confluence of economic policies, infrastructure, and consumer behavior.
Material Type: Plastic materials currently hold the largest market share, estimated at over 60% in the base year of 2025. This dominance is attributed to their versatility, cost-effectiveness, and ability to provide excellent barrier properties crucial for dairy product preservation.
- Plastic:
- Key Drivers: Durability, low cost, excellent barrier properties for shelf-life extension, lightweight nature reducing transportation costs.
- Dominance Analysis: PET and HDPE (High-Density Polyethylene) are widely used for milk jugs, yogurt cups, and cheese containers. Innovations in recycled PET (rPET) and bio-plastics are increasingly shaping this segment, addressing sustainability concerns. The e-commerce trend further bolsters plastic's dominance due to its robustness in shipping.
Paper and paperboard materials represent a growing segment, driven by sustainability initiatives and consumer preference for renewable resources.
- Paper and Paperboard:
- Key Drivers: Environmental friendliness, recyclability, biodegradability, consumer perception of natural materials.
- Dominance Analysis: Cartons for milk and cultured products, along with paperboard boxes for cheese and frozen items, are key applications. The increasing adoption of coated and lined paperboard solutions with enhanced moisture and grease resistance is expanding its reach.
Glass packaging, while historically significant, currently holds a smaller but stable market share, primarily for premium or specialty dairy products.
- Glass:
- Key Drivers: Premium perception, inertness, 100% recyclability, no flavor transfer.
- Dominance Analysis: Favored for niche products like artisanal yogurts, milk in returnable bottles, and certain cultured dairy items where a premium feel is desired. Its weight and fragility remain challenges for widespread adoption.
Metal packaging is a niche segment, primarily used for specific dairy product categories.
- Metal:
- Key Drivers: Excellent barrier properties, durability, recyclability.
- Dominance Analysis: Used for condensed milk, evaporated milk, and some infant formula packaging. Its high cost and limited flexibility for dairy applications restrict its broader market penetration.
Product Type: Milk remains the largest product segment, driving significant demand for various packaging formats.
- Milk:
- Key Drivers: High per capita consumption, need for extended shelf life, convenience in single-serve and family sizes.
- Dominance Analysis: Primarily packaged in HDPE and PET bottles, as well as gable-top cartons. Innovations focus on lightweighting and improved recyclability.
Cheese packaging is a diverse segment with varying needs based on product type.
- Cheese:
- Key Drivers: Preservation of freshness, prevention of moisture loss, shelf appeal, convenience for various formats (sliced, shredded, blocks).
- Dominance Analysis: Utilizes a range of materials including flexible films, pouches, rigid plastic containers, and paperboard boxes. Barrier properties are crucial for extending shelf life and maintaining product quality.
Frozen products require packaging that ensures product integrity under low-temperature conditions.
- Frozen Products:
- Key Drivers: Protection from freezer burn, moisture resistance, ease of handling and storage.
- Dominance Analysis: Typically packaged in flexible films, bags, pouches, and coated paperboard cartons designed to withstand cryogenic temperatures and prevent damage.
Cultured products, such as yogurt and sour cream, have specific packaging needs related to texture and product separation.
- Cultured Products:
- Key Drivers: Prevention of leakage, ease of opening, portion control, visual appeal.
- Dominance Analysis: Predominantly packaged in plastic cups and tubs, often with foil or plastic lids. Pouches are also gaining traction for convenience.
Packaging Type: Bottles are a dominant packaging type, particularly for liquid dairy products.
- Bottles:
- Key Drivers: Ease of pouring, portability, established consumer preference for milk and beverages.
- Dominance Analysis: Primarily made from PET and HDPE. Innovations focus on tamper-evident features and lightweight designs.
Pouches are a rapidly growing segment, offering versatility and sustainability benefits.
- Pouches:
- Key Drivers: Lightweight, reduced material usage, flexibility in design and dispensing, suitability for single-serve portions and bulk packaging.
- Dominance Analysis: Used for yogurt, cheese, milk, and other dairy products, particularly for on-the-go consumption and aseptic packaging applications.
Cartons and boxes are essential for a wide array of dairy products.
- Cartons and Boxes:
- Key Drivers: Efficient stacking and warehousing, brand visibility, protection for solid and semi-solid products, sustainability benefits of paperboard.
- Dominance Analysis: Widely used for milk, juice, cultured products, cheese, and frozen dairy items. Gable-top cartons for milk and aseptic cartons are significant sub-segments.
Bags and wraps offer flexibility and cost-effectiveness for certain dairy applications.
- Bags and Wraps:
- Key Drivers: Cost-effectiveness, flexibility for irregularly shaped products, protection against moisture and oxygen.
- Dominance Analysis: Used for shredded cheese, butter, and as liners for boxes.
US Dairy Packaging Industry Product Developments
Product innovation in the US dairy packaging industry is rapidly evolving, driven by the pursuit of enhanced sustainability, improved functionality, and greater consumer appeal. Companies are actively developing advanced PET barrier solutions, like Amcor's DairySeal range with ClearCor, which not only increases recyclability up to 80% but also maintains superior flavor and function, facilitating e-commerce and convenience store distribution. Furthermore, the industry is witnessing a surge in initiatives focused on minimizing virgin plastic usage and reducing the overall environmental impact of dairy supply chains. Grants awarded for dairy product packaging innovation are stimulating research into new materials and designs that align with growing consumer demand for eco-friendly alternatives, fostering collaborations that accelerate the adoption of sustainable packaging solutions across various scales and product varieties.
Key Drivers of US Dairy Packaging Industry Growth
Several key drivers are propelling the growth of the US Dairy Packaging Industry. Technological advancements in material science are enabling the development of more sustainable, lightweight, and high-performance packaging solutions. The increasing consumer demand for convenience and on-the-go consumption is fostering the growth of single-serve formats and flexible packaging. Stringent environmental regulations and a growing societal emphasis on sustainability are pushing manufacturers to adopt recyclable, biodegradable, and compostable materials, thereby creating opportunities for eco-friendly packaging innovations. Furthermore, the expanding e-commerce landscape necessitates packaging that ensures product integrity during transit and provides a positive unboxing experience. Economic growth and rising disposable incomes also contribute to increased dairy consumption, directly impacting packaging demand.
- Technological Advancements: Development of advanced barrier films, lightweighting materials, and smart packaging for traceability.
- Consumer Preferences: Growing demand for sustainable, convenient, and aesthetically pleasing packaging, including single-serve options.
- Regulatory Landscape: Environmental mandates promoting recycling, reduced plastic usage, and circular economy principles.
- E-commerce Growth: Need for robust and protective packaging to support direct-to-consumer and retail distribution channels.
- Economic Factors: Increasing disposable income leading to higher dairy consumption and demand for premium packaging.
Challenges in the US Dairy Packaging Industry Market
Despite robust growth, the US Dairy Packaging Industry faces significant challenges that can impede its progress. Fluctuating raw material costs, particularly for plastics and paper, can impact profitability and necessitate price adjustments that may affect market demand. The complex and evolving regulatory landscape, with varying state and federal mandates on packaging sustainability, can create compliance burdens and require ongoing investment in adaptation. Supply chain disruptions, exacerbated by global events, can lead to material shortages and increased lead times, affecting production schedules. Furthermore, intense competition from both established players and emerging sustainable alternatives puts pressure on pricing and margins. The high capital investment required for adopting new, sustainable packaging technologies can also be a barrier for smaller manufacturers.
- Raw Material Volatility: Price fluctuations of plastics, paper, and other key packaging inputs.
- Regulatory Complexity: Navigating diverse and changing environmental and food safety regulations.
- Supply Chain Vulnerability: Potential for disruptions in material sourcing and logistics.
- Competitive Pressures: Intense market competition leading to price erosion and margin constraints.
- Capital Investment: High costs associated with adopting new sustainable packaging technologies.
Emerging Opportunities in US Dairy Packaging Industry
The US Dairy Packaging Industry is ripe with emerging opportunities driven by innovation and evolving consumer expectations. The burgeoning demand for sustainable packaging presents a significant avenue for growth, with companies investing in biodegradable, compostable, and high-recycled-content materials. The expansion of e-commerce for dairy products opens doors for specialized packaging solutions that ensure product integrity and enhance the unboxing experience. Technological breakthroughs in smart packaging, offering features like real-time temperature monitoring and authenticity verification, are creating new value propositions. Strategic partnerships between dairy producers and packaging manufacturers are fostering collaborative innovation, leading to customized solutions that meet specific market needs. Furthermore, the increasing focus on the circular economy presents opportunities for developing closed-loop systems and innovative recycling technologies.
Leading Players in the US Dairy Packaging Industry Sector
- Polytainers Inc
- Ball Corporation
- Amcor Plc
- Altium Packaging LLC (Loews Corporation)
- Berry Global Group Inc
- Winpak Ltd
- International Paper Company
- Smurfit Kappa Group PLC
- Tetra Pak International SA
- Sealed Air Corporation
- Huhtamaki Oyj
Key Milestones in US Dairy Packaging Industry Industry
- September 2022: Amcor Rigid Packaging (ARP) launches its DairySeal range featuring ClearCor, an advanced PET barrier. This innovation allows for up to 80% recyclable materials in packaging, enhancing flavor and function, and providing easy access to e-commerce and convenience store distribution channels with designs optimized for refrigerator shelves.
- August 2022: The Vermont Agency of Agriculture, Food and Markets, through the Northeast Dairy Business Innovation Center (NE-DBIC), awards USD 1.1 million in Dairy Product Packaging Innovation Grants to five recipients. This funding supports research, packaging development, and consumer receptivity analysis to minimize virgin plastic usage and environmental impact, with awardees committed to sharing their findings to promote sustainable packaging adoption within the dairy industry, especially for small and medium-sized processors.
Strategic Outlook for US Dairy Packaging Industry Market
The strategic outlook for the US Dairy Packaging Industry is characterized by sustained growth fueled by innovation and a heightened focus on sustainability. Key growth accelerators include the continued development and adoption of eco-friendly packaging materials, such as recycled plastics and paper-based alternatives, which align with consumer preferences and regulatory imperatives. The expansion of e-commerce channels will drive demand for resilient and convenient packaging solutions. Strategic investments in advanced manufacturing technologies and smart packaging will enhance product traceability, safety, and consumer engagement, offering a competitive edge. Collaboration between industry stakeholders to foster a circular economy, coupled with a proactive approach to regulatory changes, will be crucial for long-term success and market leadership in this dynamic sector.
US Dairy Packaging Industry Segmentation
-
1. Material Type
- 1.1. Plastic
- 1.2. Paper and Paperboard
- 1.3. Glass
- 1.4. Metal
-
2. Product Type
- 2.1. Milk
- 2.2. Cheese
- 2.3. Frozen Products
- 2.4. Cultured Products
- 2.5. Other Product Types
-
3. Packaging Type
- 3.1. Bottles
- 3.2. Pouches
- 3.3. Cartons and Boxes
- 3.4. Bags and Wraps
- 3.5. Other Packaging Types
US Dairy Packaging Industry Segmentation By Geography
-
1. North America
- 1.1. United States
- 1.2. Canada
- 1.3. Mexico
-
2. South America
- 2.1. Brazil
- 2.2. Argentina
- 2.3. Rest of South America
-
3. Europe
- 3.1. United Kingdom
- 3.2. Germany
- 3.3. France
- 3.4. Italy
- 3.5. Spain
- 3.6. Russia
- 3.7. Benelux
- 3.8. Nordics
- 3.9. Rest of Europe
-
4. Middle East & Africa
- 4.1. Turkey
- 4.2. Israel
- 4.3. GCC
- 4.4. North Africa
- 4.5. South Africa
- 4.6. Rest of Middle East & Africa
-
5. Asia Pacific
- 5.1. China
- 5.2. India
- 5.3. Japan
- 5.4. South Korea
- 5.5. ASEAN
- 5.6. Oceania
- 5.7. Rest of Asia Pacific
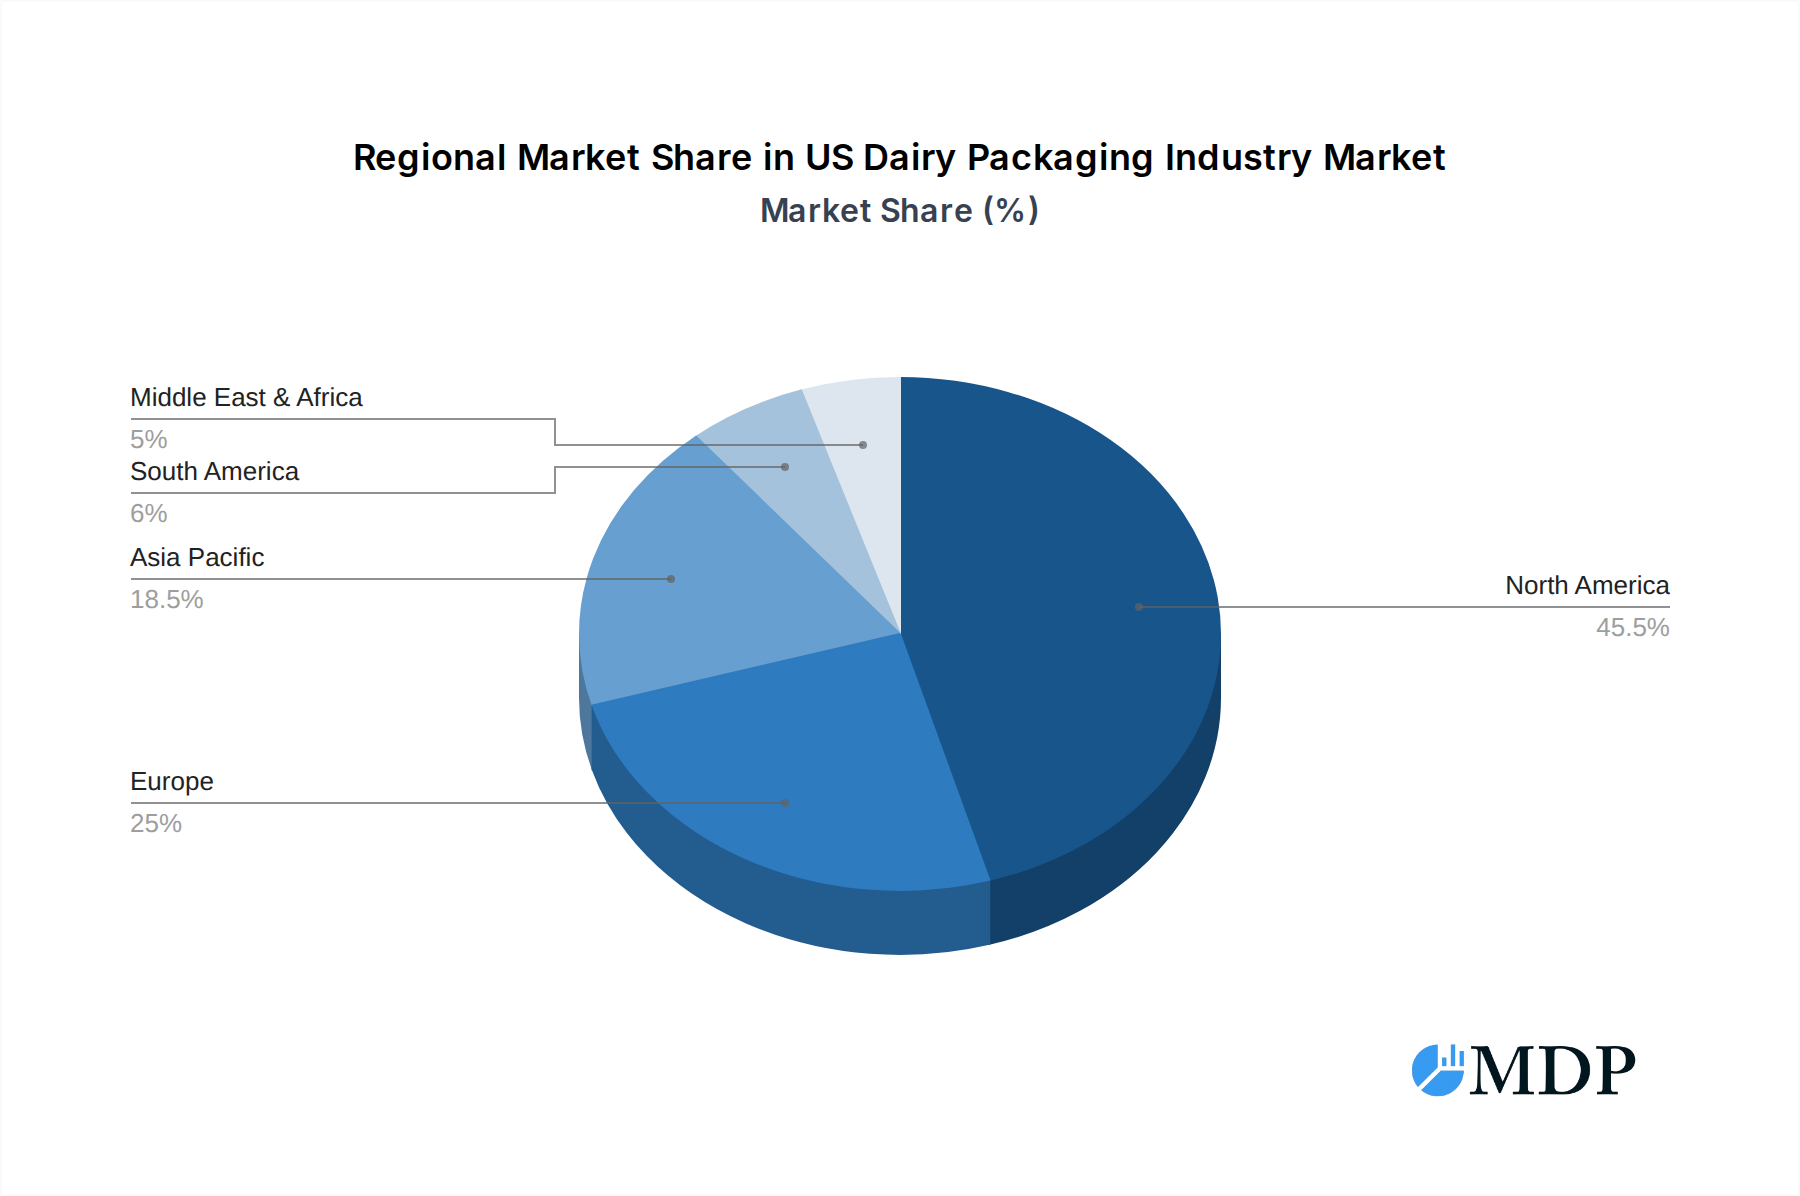
US Dairy Packaging Industry Regional Market Share
Geographic Coverage of US Dairy Packaging Industry
US Dairy Packaging Industry REPORT HIGHLIGHTS
| Aspects | Details |
|---|---|
| Study Period | 2020-2034 |
| Base Year | 2025 |
| Estimated Year | 2026 |
| Forecast Period | 2026-2034 |
| Historical Period | 2020-2025 |
| Growth Rate | CAGR of 2.7% from 2020-2034 |
| Segmentation |
|
Table of Contents
- 1. Introduction
- 1.1. Research Scope
- 1.2. Market Segmentation
- 1.3. Research Objective
- 1.4. Definitions and Assumptions
- 2. Executive Summary
- 2.1. Market Snapshot
- 3. Market Dynamics
- 3.1. Market Drivers
- 3.2. Market Restrains
- 3.3. Market Trends
- 3.4. Market Opportunities
- 4. Market Factor Analysis
- 4.1. Porters Five Forces
- 4.1.1. Bargaining Power of Suppliers
- 4.1.2. Bargaining Power of Buyers
- 4.1.3. Threat of New Entrants
- 4.1.4. Threat of Substitutes
- 4.1.5. Competitive Rivalry
- 4.2. PESTEL analysis
- 4.3. BCG Analysis
- 4.3.1. Stars (High Growth, High Market Share)
- 4.3.2. Cash Cows (Low Growth, High Market Share)
- 4.3.3. Question Mark (High Growth, Low Market Share)
- 4.3.4. Dogs (Low Growth, Low Market Share)
- 4.4. Ansoff Matrix Analysis
- 4.5. Supply Chain Analysis
- 4.6. Regulatory Landscape
- 4.7. Current Market Potential and Opportunity Assessment (TAM–SAM–SOM Framework)
- 4.8. MDP Analyst Note
- 4.1. Porters Five Forces
- 5. Market Analysis, Insights and Forecast 2021-2033
- 5.1. Market Analysis, Insights and Forecast - by Material Type
- 5.1.1. Plastic
- 5.1.2. Paper and Paperboard
- 5.1.3. Glass
- 5.1.4. Metal
- 5.2. Market Analysis, Insights and Forecast - by Product Type
- 5.2.1. Milk
- 5.2.2. Cheese
- 5.2.3. Frozen Products
- 5.2.4. Cultured Products
- 5.2.5. Other Product Types
- 5.3. Market Analysis, Insights and Forecast - by Packaging Type
- 5.3.1. Bottles
- 5.3.2. Pouches
- 5.3.3. Cartons and Boxes
- 5.3.4. Bags and Wraps
- 5.3.5. Other Packaging Types
- 5.4. Market Analysis, Insights and Forecast - by Region
- 5.4.1. North America
- 5.4.2. South America
- 5.4.3. Europe
- 5.4.4. Middle East & Africa
- 5.4.5. Asia Pacific
- 5.1. Market Analysis, Insights and Forecast - by Material Type
- 6. Global US Dairy Packaging Industry Analysis, Insights and Forecast, 2021-2033
- 6.1. Market Analysis, Insights and Forecast - by Material Type
- 6.1.1. Plastic
- 6.1.2. Paper and Paperboard
- 6.1.3. Glass
- 6.1.4. Metal
- 6.2. Market Analysis, Insights and Forecast - by Product Type
- 6.2.1. Milk
- 6.2.2. Cheese
- 6.2.3. Frozen Products
- 6.2.4. Cultured Products
- 6.2.5. Other Product Types
- 6.3. Market Analysis, Insights and Forecast - by Packaging Type
- 6.3.1. Bottles
- 6.3.2. Pouches
- 6.3.3. Cartons and Boxes
- 6.3.4. Bags and Wraps
- 6.3.5. Other Packaging Types
- 6.1. Market Analysis, Insights and Forecast - by Material Type
- 7. North America US Dairy Packaging Industry Analysis, Insights and Forecast, 2020-2032
- 7.1. Market Analysis, Insights and Forecast - by Material Type
- 7.1.1. Plastic
- 7.1.2. Paper and Paperboard
- 7.1.3. Glass
- 7.1.4. Metal
- 7.2. Market Analysis, Insights and Forecast - by Product Type
- 7.2.1. Milk
- 7.2.2. Cheese
- 7.2.3. Frozen Products
- 7.2.4. Cultured Products
- 7.2.5. Other Product Types
- 7.3. Market Analysis, Insights and Forecast - by Packaging Type
- 7.3.1. Bottles
- 7.3.2. Pouches
- 7.3.3. Cartons and Boxes
- 7.3.4. Bags and Wraps
- 7.3.5. Other Packaging Types
- 7.1. Market Analysis, Insights and Forecast - by Material Type
- 8. South America US Dairy Packaging Industry Analysis, Insights and Forecast, 2020-2032
- 8.1. Market Analysis, Insights and Forecast - by Material Type
- 8.1.1. Plastic
- 8.1.2. Paper and Paperboard
- 8.1.3. Glass
- 8.1.4. Metal
- 8.2. Market Analysis, Insights and Forecast - by Product Type
- 8.2.1. Milk
- 8.2.2. Cheese
- 8.2.3. Frozen Products
- 8.2.4. Cultured Products
- 8.2.5. Other Product Types
- 8.3. Market Analysis, Insights and Forecast - by Packaging Type
- 8.3.1. Bottles
- 8.3.2. Pouches
- 8.3.3. Cartons and Boxes
- 8.3.4. Bags and Wraps
- 8.3.5. Other Packaging Types
- 8.1. Market Analysis, Insights and Forecast - by Material Type
- 9. Europe US Dairy Packaging Industry Analysis, Insights and Forecast, 2020-2032
- 9.1. Market Analysis, Insights and Forecast - by Material Type
- 9.1.1. Plastic
- 9.1.2. Paper and Paperboard
- 9.1.3. Glass
- 9.1.4. Metal
- 9.2. Market Analysis, Insights and Forecast - by Product Type
- 9.2.1. Milk
- 9.2.2. Cheese
- 9.2.3. Frozen Products
- 9.2.4. Cultured Products
- 9.2.5. Other Product Types
- 9.3. Market Analysis, Insights and Forecast - by Packaging Type
- 9.3.1. Bottles
- 9.3.2. Pouches
- 9.3.3. Cartons and Boxes
- 9.3.4. Bags and Wraps
- 9.3.5. Other Packaging Types
- 9.1. Market Analysis, Insights and Forecast - by Material Type
- 10. Middle East & Africa US Dairy Packaging Industry Analysis, Insights and Forecast, 2020-2032
- 10.1. Market Analysis, Insights and Forecast - by Material Type
- 10.1.1. Plastic
- 10.1.2. Paper and Paperboard
- 10.1.3. Glass
- 10.1.4. Metal
- 10.2. Market Analysis, Insights and Forecast - by Product Type
- 10.2.1. Milk
- 10.2.2. Cheese
- 10.2.3. Frozen Products
- 10.2.4. Cultured Products
- 10.2.5. Other Product Types
- 10.3. Market Analysis, Insights and Forecast - by Packaging Type
- 10.3.1. Bottles
- 10.3.2. Pouches
- 10.3.3. Cartons and Boxes
- 10.3.4. Bags and Wraps
- 10.3.5. Other Packaging Types
- 10.1. Market Analysis, Insights and Forecast - by Material Type
- 11. Asia Pacific US Dairy Packaging Industry Analysis, Insights and Forecast, 2020-2032
- 11.1. Market Analysis, Insights and Forecast - by Material Type
- 11.1.1. Plastic
- 11.1.2. Paper and Paperboard
- 11.1.3. Glass
- 11.1.4. Metal
- 11.2. Market Analysis, Insights and Forecast - by Product Type
- 11.2.1. Milk
- 11.2.2. Cheese
- 11.2.3. Frozen Products
- 11.2.4. Cultured Products
- 11.2.5. Other Product Types
- 11.3. Market Analysis, Insights and Forecast - by Packaging Type
- 11.3.1. Bottles
- 11.3.2. Pouches
- 11.3.3. Cartons and Boxes
- 11.3.4. Bags and Wraps
- 11.3.5. Other Packaging Types
- 11.1. Market Analysis, Insights and Forecast - by Material Type
- 12. Competitive Analysis
- 12.1. Company Profiles
- 12.1.1 Polytainers Inc
- 12.1.1.1. Company Overview
- 12.1.1.2. Products
- 12.1.1.3. Company Financials
- 12.1.1.4. SWOT Analysis
- 12.1.2 Ball Corporation
- 12.1.2.1. Company Overview
- 12.1.2.2. Products
- 12.1.2.3. Company Financials
- 12.1.2.4. SWOT Analysis
- 12.1.3 Amcor Plc
- 12.1.3.1. Company Overview
- 12.1.3.2. Products
- 12.1.3.3. Company Financials
- 12.1.3.4. SWOT Analysis
- 12.1.4 Altium Packaging LLC (Loews Corporation)
- 12.1.4.1. Company Overview
- 12.1.4.2. Products
- 12.1.4.3. Company Financials
- 12.1.4.4. SWOT Analysis
- 12.1.5 Berry Global Group Inc
- 12.1.5.1. Company Overview
- 12.1.5.2. Products
- 12.1.5.3. Company Financials
- 12.1.5.4. SWOT Analysis
- 12.1.6 Winpak Ltd
- 12.1.6.1. Company Overview
- 12.1.6.2. Products
- 12.1.6.3. Company Financials
- 12.1.6.4. SWOT Analysis
- 12.1.7 International Paper Company
- 12.1.7.1. Company Overview
- 12.1.7.2. Products
- 12.1.7.3. Company Financials
- 12.1.7.4. SWOT Analysis
- 12.1.8 Smurfit Kappa Group PLC
- 12.1.8.1. Company Overview
- 12.1.8.2. Products
- 12.1.8.3. Company Financials
- 12.1.8.4. SWOT Analysis
- 12.1.9 Tetra Pak International SA*List Not Exhaustive
- 12.1.9.1. Company Overview
- 12.1.9.2. Products
- 12.1.9.3. Company Financials
- 12.1.9.4. SWOT Analysis
- 12.1.10 Sealed Air Corporation
- 12.1.10.1. Company Overview
- 12.1.10.2. Products
- 12.1.10.3. Company Financials
- 12.1.10.4. SWOT Analysis
- 12.1.11 Huhtamaki Oyj
- 12.1.11.1. Company Overview
- 12.1.11.2. Products
- 12.1.11.3. Company Financials
- 12.1.11.4. SWOT Analysis
- 12.1.1 Polytainers Inc
- 12.2. Market Entropy
- 12.2.1 Company's Key Areas Served
- 12.2.2 Recent Developments
- 12.3. Company Market Share Analysis 2025
- 12.3.1 Top 5 Companies Market Share Analysis
- 12.3.2 Top 3 Companies Market Share Analysis
- 12.4. List of Potential Customers
- 13. Research Methodology
List of Figures
- Figure 1: Global US Dairy Packaging Industry Revenue Breakdown (billion, %) by Region 2025 & 2033
- Figure 2: North America US Dairy Packaging Industry Revenue (billion), by Material Type 2025 & 2033
- Figure 3: North America US Dairy Packaging Industry Revenue Share (%), by Material Type 2025 & 2033
- Figure 4: North America US Dairy Packaging Industry Revenue (billion), by Product Type 2025 & 2033
- Figure 5: North America US Dairy Packaging Industry Revenue Share (%), by Product Type 2025 & 2033
- Figure 6: North America US Dairy Packaging Industry Revenue (billion), by Packaging Type 2025 & 2033
- Figure 7: North America US Dairy Packaging Industry Revenue Share (%), by Packaging Type 2025 & 2033
- Figure 8: North America US Dairy Packaging Industry Revenue (billion), by Country 2025 & 2033
- Figure 9: North America US Dairy Packaging Industry Revenue Share (%), by Country 2025 & 2033
- Figure 10: South America US Dairy Packaging Industry Revenue (billion), by Material Type 2025 & 2033
- Figure 11: South America US Dairy Packaging Industry Revenue Share (%), by Material Type 2025 & 2033
- Figure 12: South America US Dairy Packaging Industry Revenue (billion), by Product Type 2025 & 2033
- Figure 13: South America US Dairy Packaging Industry Revenue Share (%), by Product Type 2025 & 2033
- Figure 14: South America US Dairy Packaging Industry Revenue (billion), by Packaging Type 2025 & 2033
- Figure 15: South America US Dairy Packaging Industry Revenue Share (%), by Packaging Type 2025 & 2033
- Figure 16: South America US Dairy Packaging Industry Revenue (billion), by Country 2025 & 2033
- Figure 17: South America US Dairy Packaging Industry Revenue Share (%), by Country 2025 & 2033
- Figure 18: Europe US Dairy Packaging Industry Revenue (billion), by Material Type 2025 & 2033
- Figure 19: Europe US Dairy Packaging Industry Revenue Share (%), by Material Type 2025 & 2033
- Figure 20: Europe US Dairy Packaging Industry Revenue (billion), by Product Type 2025 & 2033
- Figure 21: Europe US Dairy Packaging Industry Revenue Share (%), by Product Type 2025 & 2033
- Figure 22: Europe US Dairy Packaging Industry Revenue (billion), by Packaging Type 2025 & 2033
- Figure 23: Europe US Dairy Packaging Industry Revenue Share (%), by Packaging Type 2025 & 2033
- Figure 24: Europe US Dairy Packaging Industry Revenue (billion), by Country 2025 & 2033
- Figure 25: Europe US Dairy Packaging Industry Revenue Share (%), by Country 2025 & 2033
- Figure 26: Middle East & Africa US Dairy Packaging Industry Revenue (billion), by Material Type 2025 & 2033
- Figure 27: Middle East & Africa US Dairy Packaging Industry Revenue Share (%), by Material Type 2025 & 2033
- Figure 28: Middle East & Africa US Dairy Packaging Industry Revenue (billion), by Product Type 2025 & 2033
- Figure 29: Middle East & Africa US Dairy Packaging Industry Revenue Share (%), by Product Type 2025 & 2033
- Figure 30: Middle East & Africa US Dairy Packaging Industry Revenue (billion), by Packaging Type 2025 & 2033
- Figure 31: Middle East & Africa US Dairy Packaging Industry Revenue Share (%), by Packaging Type 2025 & 2033
- Figure 32: Middle East & Africa US Dairy Packaging Industry Revenue (billion), by Country 2025 & 2033
- Figure 33: Middle East & Africa US Dairy Packaging Industry Revenue Share (%), by Country 2025 & 2033
- Figure 34: Asia Pacific US Dairy Packaging Industry Revenue (billion), by Material Type 2025 & 2033
- Figure 35: Asia Pacific US Dairy Packaging Industry Revenue Share (%), by Material Type 2025 & 2033
- Figure 36: Asia Pacific US Dairy Packaging Industry Revenue (billion), by Product Type 2025 & 2033
- Figure 37: Asia Pacific US Dairy Packaging Industry Revenue Share (%), by Product Type 2025 & 2033
- Figure 38: Asia Pacific US Dairy Packaging Industry Revenue (billion), by Packaging Type 2025 & 2033
- Figure 39: Asia Pacific US Dairy Packaging Industry Revenue Share (%), by Packaging Type 2025 & 2033
- Figure 40: Asia Pacific US Dairy Packaging Industry Revenue (billion), by Country 2025 & 2033
- Figure 41: Asia Pacific US Dairy Packaging Industry Revenue Share (%), by Country 2025 & 2033
List of Tables
- Table 1: Global US Dairy Packaging Industry Revenue billion Forecast, by Material Type 2020 & 2033
- Table 2: Global US Dairy Packaging Industry Revenue billion Forecast, by Product Type 2020 & 2033
- Table 3: Global US Dairy Packaging Industry Revenue billion Forecast, by Packaging Type 2020 & 2033
- Table 4: Global US Dairy Packaging Industry Revenue billion Forecast, by Region 2020 & 2033
- Table 5: Global US Dairy Packaging Industry Revenue billion Forecast, by Material Type 2020 & 2033
- Table 6: Global US Dairy Packaging Industry Revenue billion Forecast, by Product Type 2020 & 2033
- Table 7: Global US Dairy Packaging Industry Revenue billion Forecast, by Packaging Type 2020 & 2033
- Table 8: Global US Dairy Packaging Industry Revenue billion Forecast, by Country 2020 & 2033
- Table 9: United States US Dairy Packaging Industry Revenue (billion) Forecast, by Application 2020 & 2033
- Table 10: Canada US Dairy Packaging Industry Revenue (billion) Forecast, by Application 2020 & 2033
- Table 11: Mexico US Dairy Packaging Industry Revenue (billion) Forecast, by Application 2020 & 2033
- Table 12: Global US Dairy Packaging Industry Revenue billion Forecast, by Material Type 2020 & 2033
- Table 13: Global US Dairy Packaging Industry Revenue billion Forecast, by Product Type 2020 & 2033
- Table 14: Global US Dairy Packaging Industry Revenue billion Forecast, by Packaging Type 2020 & 2033
- Table 15: Global US Dairy Packaging Industry Revenue billion Forecast, by Country 2020 & 2033
- Table 16: Brazil US Dairy Packaging Industry Revenue (billion) Forecast, by Application 2020 & 2033
- Table 17: Argentina US Dairy Packaging Industry Revenue (billion) Forecast, by Application 2020 & 2033
- Table 18: Rest of South America US Dairy Packaging Industry Revenue (billion) Forecast, by Application 2020 & 2033
- Table 19: Global US Dairy Packaging Industry Revenue billion Forecast, by Material Type 2020 & 2033
- Table 20: Global US Dairy Packaging Industry Revenue billion Forecast, by Product Type 2020 & 2033
- Table 21: Global US Dairy Packaging Industry Revenue billion Forecast, by Packaging Type 2020 & 2033
- Table 22: Global US Dairy Packaging Industry Revenue billion Forecast, by Country 2020 & 2033
- Table 23: United Kingdom US Dairy Packaging Industry Revenue (billion) Forecast, by Application 2020 & 2033
- Table 24: Germany US Dairy Packaging Industry Revenue (billion) Forecast, by Application 2020 & 2033
- Table 25: France US Dairy Packaging Industry Revenue (billion) Forecast, by Application 2020 & 2033
- Table 26: Italy US Dairy Packaging Industry Revenue (billion) Forecast, by Application 2020 & 2033
- Table 27: Spain US Dairy Packaging Industry Revenue (billion) Forecast, by Application 2020 & 2033
- Table 28: Russia US Dairy Packaging Industry Revenue (billion) Forecast, by Application 2020 & 2033
- Table 29: Benelux US Dairy Packaging Industry Revenue (billion) Forecast, by Application 2020 & 2033
- Table 30: Nordics US Dairy Packaging Industry Revenue (billion) Forecast, by Application 2020 & 2033
- Table 31: Rest of Europe US Dairy Packaging Industry Revenue (billion) Forecast, by Application 2020 & 2033
- Table 32: Global US Dairy Packaging Industry Revenue billion Forecast, by Material Type 2020 & 2033
- Table 33: Global US Dairy Packaging Industry Revenue billion Forecast, by Product Type 2020 & 2033
- Table 34: Global US Dairy Packaging Industry Revenue billion Forecast, by Packaging Type 2020 & 2033
- Table 35: Global US Dairy Packaging Industry Revenue billion Forecast, by Country 2020 & 2033
- Table 36: Turkey US Dairy Packaging Industry Revenue (billion) Forecast, by Application 2020 & 2033
- Table 37: Israel US Dairy Packaging Industry Revenue (billion) Forecast, by Application 2020 & 2033
- Table 38: GCC US Dairy Packaging Industry Revenue (billion) Forecast, by Application 2020 & 2033
- Table 39: North Africa US Dairy Packaging Industry Revenue (billion) Forecast, by Application 2020 & 2033
- Table 40: South Africa US Dairy Packaging Industry Revenue (billion) Forecast, by Application 2020 & 2033
- Table 41: Rest of Middle East & Africa US Dairy Packaging Industry Revenue (billion) Forecast, by Application 2020 & 2033
- Table 42: Global US Dairy Packaging Industry Revenue billion Forecast, by Material Type 2020 & 2033
- Table 43: Global US Dairy Packaging Industry Revenue billion Forecast, by Product Type 2020 & 2033
- Table 44: Global US Dairy Packaging Industry Revenue billion Forecast, by Packaging Type 2020 & 2033
- Table 45: Global US Dairy Packaging Industry Revenue billion Forecast, by Country 2020 & 2033
- Table 46: China US Dairy Packaging Industry Revenue (billion) Forecast, by Application 2020 & 2033
- Table 47: India US Dairy Packaging Industry Revenue (billion) Forecast, by Application 2020 & 2033
- Table 48: Japan US Dairy Packaging Industry Revenue (billion) Forecast, by Application 2020 & 2033
- Table 49: South Korea US Dairy Packaging Industry Revenue (billion) Forecast, by Application 2020 & 2033
- Table 50: ASEAN US Dairy Packaging Industry Revenue (billion) Forecast, by Application 2020 & 2033
- Table 51: Oceania US Dairy Packaging Industry Revenue (billion) Forecast, by Application 2020 & 2033
- Table 52: Rest of Asia Pacific US Dairy Packaging Industry Revenue (billion) Forecast, by Application 2020 & 2033
Frequently Asked Questions
1. What is the projected Compound Annual Growth Rate (CAGR) of the US Dairy Packaging Industry?
The projected CAGR is approximately 2.7%.
2. Which companies are prominent players in the US Dairy Packaging Industry?
Key companies in the market include Polytainers Inc, Ball Corporation, Amcor Plc, Altium Packaging LLC (Loews Corporation), Berry Global Group Inc, Winpak Ltd, International Paper Company, Smurfit Kappa Group PLC, Tetra Pak International SA*List Not Exhaustive, Sealed Air Corporation, Huhtamaki Oyj.
3. What are the main segments of the US Dairy Packaging Industry?
The market segments include Material Type, Product Type, Packaging Type.
4. Can you provide details about the market size?
The market size is estimated to be USD 33.9 billion as of 2022.
5. What are some drivers contributing to market growth?
Increasing Consumer Preference Toward Protein-based Products; Increasing Adoption of In-house Packaging Methods; Increasing Adoption of Packages Incorporating Small Portion Size.
6. What are the notable trends driving market growth?
Increasing Consumer Preference Toward Protein-based Products.
7. Are there any restraints impacting market growth?
Greenhouse Gas Emission due to Dairy Activities Leading to Legislative Issues.
8. Can you provide examples of recent developments in the market?
September 2022: The DairySeal range from Amcor Rigid Packaging (ARP) contains ClearCor, an advanced PET barrier. The DairySeal series of packaging may be produced using up to 80% recyclable materials while still providing the brand with better flavor and function. The DairySeal line in PET provides businesses with simple access to e-commerce and convenience store distribution channels, where round, firm plastic bottles are intended to fit on refrigerator shelves.
9. What pricing options are available for accessing the report?
Pricing options include single-user, multi-user, and enterprise licenses priced at USD 3800, USD 4500, and USD 5800 respectively.
10. Is the market size provided in terms of value or volume?
The market size is provided in terms of value, measured in billion.
11. Are there any specific market keywords associated with the report?
Yes, the market keyword associated with the report is "US Dairy Packaging Industry," which aids in identifying and referencing the specific market segment covered.
12. How do I determine which pricing option suits my needs best?
The pricing options vary based on user requirements and access needs. Individual users may opt for single-user licenses, while businesses requiring broader access may choose multi-user or enterprise licenses for cost-effective access to the report.
13. Are there any additional resources or data provided in the US Dairy Packaging Industry report?
While the report offers comprehensive insights, it's advisable to review the specific contents or supplementary materials provided to ascertain if additional resources or data are available.
14. How can I stay updated on further developments or reports in the US Dairy Packaging Industry?
To stay informed about further developments, trends, and reports in the US Dairy Packaging Industry, consider subscribing to industry newsletters, following relevant companies and organizations, or regularly checking reputable industry news sources and publications.
Methodology
Step 1 - Identification of Relevant Samples Size from Population Database


Step 2 - Approaches for Defining Global Market Size (Value, Volume* & Price*)

Note*: In applicable scenarios
Step 3 - Data Sources
Primary Research
- Web Analytics
- Survey Reports
- Research Institute
- Latest Research Reports
- Opinion Leaders
Secondary Research
- Annual Reports
- White Paper
- Latest Press Release
- Industry Association
- Paid Database
- Investor Presentations

Step 4 - Data Triangulation
Involves using different sources of information in order to increase the validity of a study
These sources are likely to be stakeholders in a program - participants, other researchers, program staff, other community members, and so on.
Then we put all data in single framework & apply various statistical tools to find out the dynamic on the market.
During the analysis stage, feedback from the stakeholder groups would be compared to determine areas of agreement as well as areas of divergence