

Key Insights
The US beverage packaging market is poised for robust growth, projected to reach $42.16 billion in 2025 and expand at a Compound Annual Growth Rate (CAGR) of 6.57% through 2033. This expansion is significantly driven by the increasing demand for alcoholic beverages, particularly craft beers and spirits, alongside the sustained popularity of milk and the burgeoning energy drink sector. The versatility and aesthetic appeal of plastic, metal, and glass packaging continue to dominate, with bottles and cans being the primary formats. Consumer preferences for convenience, sustainability, and product preservation are shaping innovation in this space, leading to advancements in lightweight materials and recyclable options. The market is also witnessing a growing emphasis on premium and functional packaging solutions that enhance brand perception and consumer experience, thereby fueling further market penetration across various beverage categories.
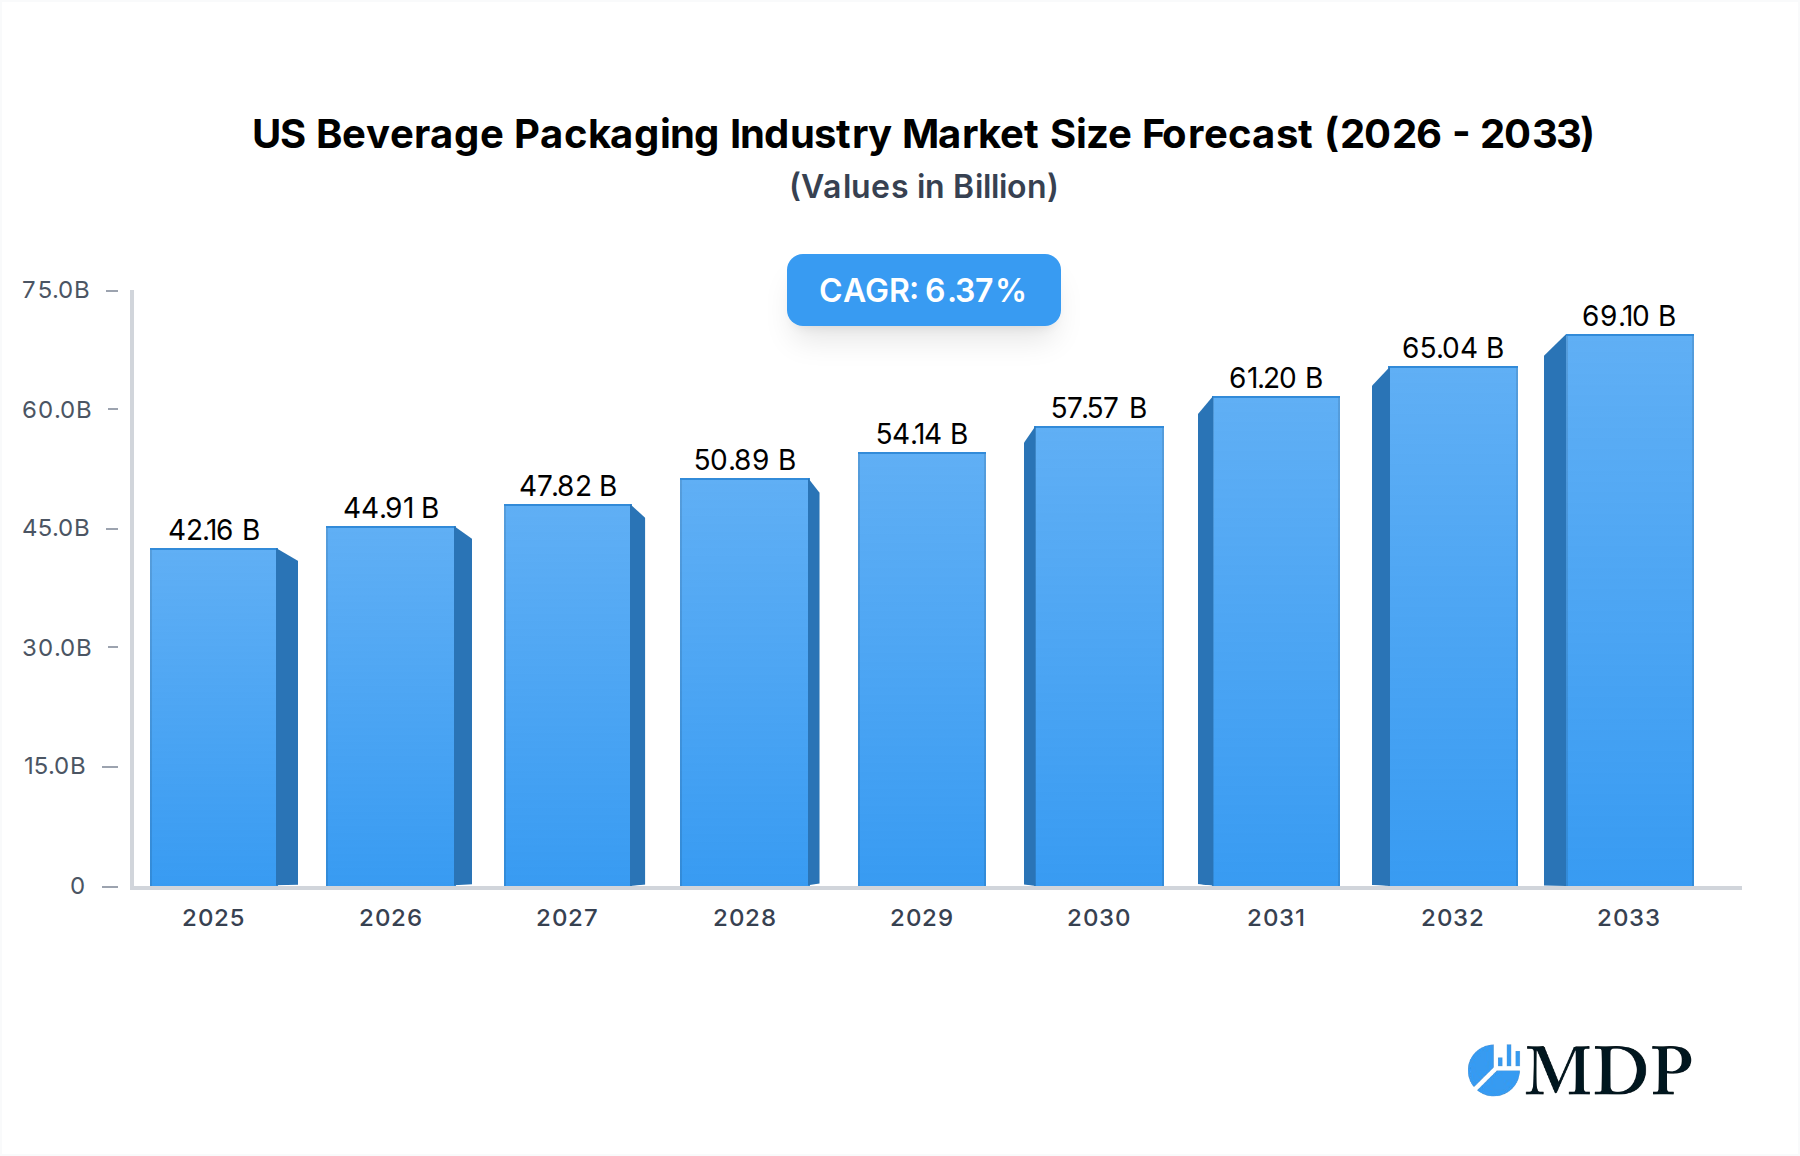
US Beverage Packaging Industry Market Size (In Billion)
Several factors are propelling the US beverage packaging industry forward. The growing health consciousness among consumers is boosting the demand for functional beverages and nutritional drinks, which in turn requires specialized packaging solutions. Furthermore, the rise of e-commerce and direct-to-consumer sales models necessitates robust and protective packaging that ensures product integrity during transit, further stimulating market growth. Companies are investing in sustainable packaging alternatives, such as recycled content and biodegradable materials, to align with environmental regulations and consumer expectations, positioning these as key market differentiators. While the market is generally expanding, potential challenges include fluctuating raw material costs, intense competition among packaging manufacturers, and evolving regulatory landscapes concerning material usage and recyclability, all of which require strategic adaptation by key industry players like Ardagh Group, Ball Corporation, and Amcor Limited.

US Beverage Packaging Industry Company Market Share
US Beverage Packaging Industry Market Analysis: Unveiling Opportunities and Growth Trajectories (2019–2033)
This comprehensive report delves into the dynamic US Beverage Packaging Industry, providing critical insights for stakeholders navigating this multi-billion dollar market. Covering the historical period of 2019–2024 and projecting growth through 2033, this analysis offers actionable intelligence on market dynamics, industry trends, leading segments, product developments, growth drivers, challenges, emerging opportunities, key players, and strategic outlooks. With a base and estimated year of 2025, this report is your definitive guide to understanding the forces shaping the future of beverage packaging in the United States.
US Beverage Packaging Industry Market Dynamics & Concentration
The US Beverage Packaging Industry is characterized by moderate to high concentration, with a few dominant players like Ardagh Group, Ball Corporation, Crown Holdings Inc., and Amcor Limited holding significant market share, estimated to be over 60% of the total market value. Innovation drivers are multifaceted, primarily fueled by the escalating demand for sustainable packaging solutions, advancements in material science leading to lighter and more resilient options, and the ever-evolving preferences of consumers for convenience and premiumization. Regulatory frameworks, particularly those concerning environmental impact and material recyclability, play a crucial role in shaping industry strategies. Product substitutes, while present, face increasing competition from innovative packaging designs and materials that offer enhanced performance and consumer appeal. End-user trends are heavily influenced by lifestyle shifts, with a growing preference for single-serve formats, on-the-go consumption, and a conscious effort towards reduced environmental footprints. Mergers and acquisitions (M&A) activities remain a significant aspect of market concentration, with an estimated XX number of significant deals recorded between 2020 and 2024, aimed at expanding product portfolios, geographical reach, and technological capabilities.
US Beverage Packaging Industry Industry Trends & Analysis
The US Beverage Packaging Industry is poised for robust growth, projected to expand at a Compound Annual Growth Rate (CAGR) of approximately X.X% from 2025 to 2033, reaching a market value projected to exceed several hundred billion dollars. This growth is propelled by several key market drivers. The increasing consumer demand for convenient and on-the-go beverage options continues to fuel the market for single-serve bottles and cans. Furthermore, a significant shift towards sustainable packaging is revolutionizing the industry, with a surge in demand for recyclable, reusable, and biodegradable materials. This trend is not only driven by consumer awareness but also by stringent environmental regulations and corporate sustainability initiatives. Technological disruptions are also playing a pivotal role. Advancements in material science are leading to the development of lighter, stronger, and more functional packaging solutions. Innovations in printing and labeling technologies are enabling enhanced product differentiation and brand storytelling. The rise of functional beverages, including energy drinks and enhanced waters, is contributing to market expansion, requiring specialized packaging that maintains product integrity and appeal. Competitive dynamics within the industry are intense, with companies focusing on cost optimization, supply chain efficiency, and product innovation to gain a competitive edge. Market penetration for sustainable packaging solutions is expected to rise dramatically, driven by both consumer preference and regulatory mandates. The increasing adoption of smart packaging technologies, offering features such as traceability and authenticity verification, is another emerging trend that will shape market dynamics. The overall market penetration for beverage packaging in the US is expected to remain high, driven by the essential nature of these products in daily life and the continuous innovation within the sector.
Leading Markets & Segments in US Beverage Packaging Industry
The Metal segment is a dominant force within the US Beverage Packaging Industry, largely driven by the enduring popularity and recyclability of aluminum cans. This segment is projected to account for a substantial portion of the market value, exceeding several tens of billions of dollars in the forecast period. Key drivers for the dominance of metal packaging include:
- Consumer Preference for Cans: The convenience, portability, and rapid chilling capabilities of cans make them a preferred choice for a wide array of beverages, including carbonated soft drinks, beer, hard seltzers, and energy drinks.
- Sustainability Initiatives: Aluminum's high recycling rates and infinite recyclability align perfectly with growing environmental consciousness and regulatory pressures, making it a favored material for eco-conscious brands and consumers.
- Technological Advancements: Innovations in can manufacturing, such as lightweighting and improved lining technologies, enhance efficiency and product protection.
- Growth of Ready-to-Drink (RTD) Beverages: The burgeoning RTD cocktail and coffee markets are increasingly opting for the can format, further bolstering this segment's growth.
In terms of Product Type, Bottles and Cans collectively hold the largest market share. Bottles, encompassing both plastic and glass, cater to a vast spectrum of beverages, from water and juices to milk and spirits. The Plastic segment, particularly PET, continues to hold a significant presence due to its cost-effectiveness, versatility, and lightweight properties, although it faces increasing scrutiny regarding its environmental impact. Glass bottles maintain their premium appeal for certain segments like craft beers, wines, and spirits, where perceived quality and aesthetics are paramount.
The Alcoholic Beverages and Other Applications segments, which include energy drinks, functional beverages, and non-alcoholic alternatives, are significant contributors to the overall market value. The alcoholic beverage sector consistently drives demand for both cans and bottles, while the rapidly expanding energy drink and functional beverage markets showcase a strong preference for cans and innovative pouch formats.
US Beverage Packaging Industry Product Developments
Product developments in the US Beverage Packaging Industry are characterized by a relentless pursuit of sustainability, enhanced functionality, and improved consumer experience. Innovations include the introduction of lightweighted aluminum cans, advancements in barrier technologies for plastic bottles to extend shelf life, and the growing adoption of recyclable and compostable paperboard cartons. Smart packaging solutions are also emerging, offering features like temperature indicators and tamper-evident seals. Companies are actively developing and deploying multi-material solutions to optimize performance and cost, while also focusing on aesthetically pleasing designs that capture consumer attention on crowded retail shelves. These developments are crucial for meeting evolving consumer demands and staying competitive.
Key Drivers of US Beverage Packaging Industry Growth
The US Beverage Packaging Industry's growth is primarily propelled by several interconnected factors. Growing consumer demand for convenience and on-the-go consumption fuels the market for single-serve formats like cans and small bottles. The escalating consumer awareness and demand for sustainable packaging solutions, driven by environmental concerns and regulatory pushes, is a significant catalyst, favoring recyclable and reusable materials. Technological advancements in materials science and manufacturing processes are enabling the creation of lighter, more durable, and cost-effective packaging. Furthermore, the expansion of the functional beverage and ready-to-drink (RTD) markets is creating new avenues for packaging innovation.
Challenges in the US Beverage Packaging Industry Market
The US Beverage Packaging Industry faces several hurdles that can impede growth. Increasing regulatory stringency regarding plastic waste and recyclability poses a challenge, necessitating significant investment in alternative materials and recycling infrastructure. Volatility in raw material prices, particularly for plastics and metals, can impact manufacturing costs and profitability. Supply chain disruptions, as evidenced by recent global events, can lead to production delays and increased logistical expenses. Intense competition from both established players and emerging innovators drives down profit margins and requires continuous investment in R&D.
Emerging Opportunities in US Beverage Packaging Industry
Emerging opportunities within the US Beverage Packaging Industry are significant and diverse. The accelerated adoption of sustainable packaging materials, including bio-plastics and advanced recycled content, presents a substantial growth avenue. Investments in circular economy initiatives and closed-loop recycling systems offer long-term sustainability and cost-efficiency benefits. The expansion of the premium and specialty beverage segments creates opportunities for innovative and aesthetically appealing packaging designs. Strategic partnerships and collaborations between packaging manufacturers, beverage brands, and technology providers can drive the development and widespread adoption of novel solutions. Furthermore, the growing demand for e-commerce-ready packaging that ensures product integrity during transit opens up new market segments.
Leading Players in the US Beverage Packaging Industry Sector
- Ardagh Group
- CCL Containers Inc
- Sonoco Products Company
- Ball Corporation
- Silgan Containers Inc
- Amcor Limited
- Berry Global Inc
- Berlin Packaging
- Westroc
- Crown Holdings Inc
- Owens-illinois Inc
Key Milestones in US Beverage Packaging Industry Industry
- July 2021: Ball Corporation announces significant expansion plans for its manufacturing capacity with new, cutting-edge facilities in the UK and Russia, responding to the increasing global demand for aluminum packaging driven by consumer preference for sustainable options and the growing adoption of cans by new beverage brands and categories.
- September 2021: Crown Holdings Inc. reveals the location of its new Southwestern United States aluminum beverage can manufacturing facility in Mesquite, Nevada. This state-of-the-art plant, equipped with two production lines, is set to supply standard and specialty beverage cans to a diverse customer base across various categories, including carbonated soft drinks, sparkling water, energy drinks, hard seltzers, beer, and ready-to-drink cocktails.
Strategic Outlook for US Beverage Packaging Industry Market
The strategic outlook for the US Beverage Packaging Industry is exceptionally positive, driven by ongoing innovation and evolving consumer demands. The market is set to witness continued growth through the strategic focus on sustainable and circular packaging solutions, appealing to environmentally conscious consumers and meeting stringent regulatory requirements. Investments in advanced manufacturing technologies will enhance efficiency, reduce costs, and enable the development of novel packaging formats. Strategic collaborations and M&A activities are expected to further consolidate the market, fostering innovation and expanding market reach. The burgeoning demand for functional and RTD beverages will continue to be a key growth accelerator, requiring specialized and attractive packaging. Ultimately, the industry's ability to adapt to shifting consumer preferences and embrace technological advancements will define its trajectory toward sustained growth and market leadership.
US Beverage Packaging Industry Segmentation
-
1. Material
- 1.1. Plastic
- 1.2. Metal
- 1.3. Glass
- 1.4. Paperboard
-
2. Product Type
- 2.1. Bottles
- 2.2. Cans
- 2.3. Pouches
- 2.4. Cartons
- 2.5. Beer kegs
-
3. Application
- 3.1. Alcoholic Beverages
- 3.2. Milk
- 3.3. Energy Drinks
- 3.4. Other applications
US Beverage Packaging Industry Segmentation By Geography
-
1. North America
- 1.1. United States
- 1.2. Canada
- 1.3. Mexico
-
2. South America
- 2.1. Brazil
- 2.2. Argentina
- 2.3. Rest of South America
-
3. Europe
- 3.1. United Kingdom
- 3.2. Germany
- 3.3. France
- 3.4. Italy
- 3.5. Spain
- 3.6. Russia
- 3.7. Benelux
- 3.8. Nordics
- 3.9. Rest of Europe
-
4. Middle East & Africa
- 4.1. Turkey
- 4.2. Israel
- 4.3. GCC
- 4.4. North Africa
- 4.5. South Africa
- 4.6. Rest of Middle East & Africa
-
5. Asia Pacific
- 5.1. China
- 5.2. India
- 5.3. Japan
- 5.4. South Korea
- 5.5. ASEAN
- 5.6. Oceania
- 5.7. Rest of Asia Pacific
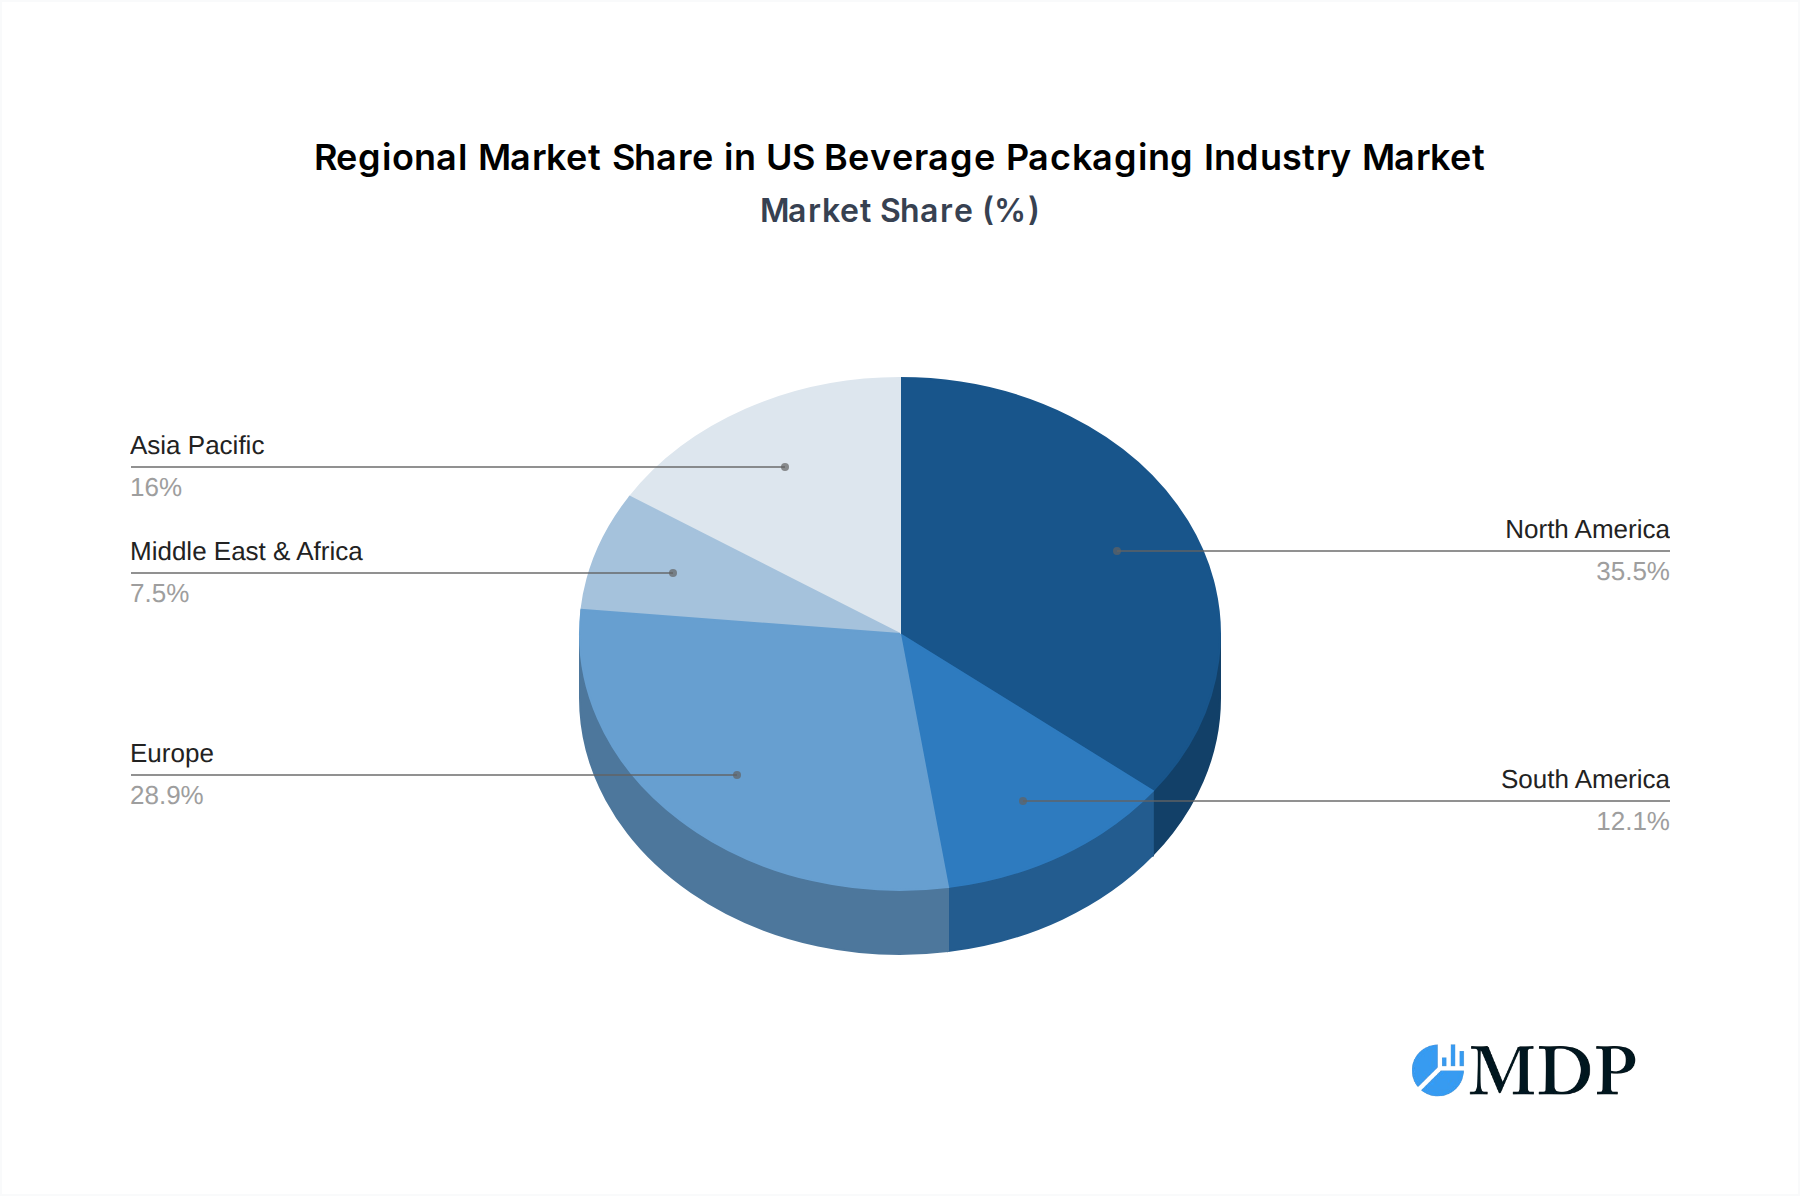
US Beverage Packaging Industry Regional Market Share
Geographic Coverage of US Beverage Packaging Industry
US Beverage Packaging Industry REPORT HIGHLIGHTS
| Aspects | Details |
|---|---|
| Study Period | 2020-2034 |
| Base Year | 2025 |
| Estimated Year | 2026 |
| Forecast Period | 2026-2034 |
| Historical Period | 2020-2025 |
| Growth Rate | CAGR of 6.57% from 2020-2034 |
| Segmentation |
|
Table of Contents
- 1. Introduction
- 1.1. Research Scope
- 1.2. Market Segmentation
- 1.3. Research Objective
- 1.4. Definitions and Assumptions
- 2. Executive Summary
- 2.1. Market Snapshot
- 3. Market Dynamics
- 3.1. Market Drivers
- 3.2. Market Restrains
- 3.3. Market Trends
- 3.4. Market Opportunities
- 4. Market Factor Analysis
- 4.1. Porters Five Forces
- 4.1.1. Bargaining Power of Suppliers
- 4.1.2. Bargaining Power of Buyers
- 4.1.3. Threat of New Entrants
- 4.1.4. Threat of Substitutes
- 4.1.5. Competitive Rivalry
- 4.2. PESTEL analysis
- 4.3. BCG Analysis
- 4.3.1. Stars (High Growth, High Market Share)
- 4.3.2. Cash Cows (Low Growth, High Market Share)
- 4.3.3. Question Mark (High Growth, Low Market Share)
- 4.3.4. Dogs (Low Growth, Low Market Share)
- 4.4. Ansoff Matrix Analysis
- 4.5. Supply Chain Analysis
- 4.6. Regulatory Landscape
- 4.7. Current Market Potential and Opportunity Assessment (TAM–SAM–SOM Framework)
- 4.8. MDP Analyst Note
- 4.1. Porters Five Forces
- 5. Market Analysis, Insights and Forecast 2021-2033
- 5.1. Market Analysis, Insights and Forecast - by Material
- 5.1.1. Plastic
- 5.1.2. Metal
- 5.1.3. Glass
- 5.1.4. Paperboard
- 5.2. Market Analysis, Insights and Forecast - by Product Type
- 5.2.1. Bottles
- 5.2.2. Cans
- 5.2.3. Pouches
- 5.2.4. Cartons
- 5.2.5. Beer kegs
- 5.3. Market Analysis, Insights and Forecast - by Application
- 5.3.1. Alcoholic Beverages
- 5.3.2. Milk
- 5.3.3. Energy Drinks
- 5.3.4. Other applications
- 5.4. Market Analysis, Insights and Forecast - by Region
- 5.4.1. North America
- 5.4.2. South America
- 5.4.3. Europe
- 5.4.4. Middle East & Africa
- 5.4.5. Asia Pacific
- 5.1. Market Analysis, Insights and Forecast - by Material
- 6. Global US Beverage Packaging Industry Analysis, Insights and Forecast, 2021-2033
- 6.1. Market Analysis, Insights and Forecast - by Material
- 6.1.1. Plastic
- 6.1.2. Metal
- 6.1.3. Glass
- 6.1.4. Paperboard
- 6.2. Market Analysis, Insights and Forecast - by Product Type
- 6.2.1. Bottles
- 6.2.2. Cans
- 6.2.3. Pouches
- 6.2.4. Cartons
- 6.2.5. Beer kegs
- 6.3. Market Analysis, Insights and Forecast - by Application
- 6.3.1. Alcoholic Beverages
- 6.3.2. Milk
- 6.3.3. Energy Drinks
- 6.3.4. Other applications
- 6.1. Market Analysis, Insights and Forecast - by Material
- 7. North America US Beverage Packaging Industry Analysis, Insights and Forecast, 2020-2032
- 7.1. Market Analysis, Insights and Forecast - by Material
- 7.1.1. Plastic
- 7.1.2. Metal
- 7.1.3. Glass
- 7.1.4. Paperboard
- 7.2. Market Analysis, Insights and Forecast - by Product Type
- 7.2.1. Bottles
- 7.2.2. Cans
- 7.2.3. Pouches
- 7.2.4. Cartons
- 7.2.5. Beer kegs
- 7.3. Market Analysis, Insights and Forecast - by Application
- 7.3.1. Alcoholic Beverages
- 7.3.2. Milk
- 7.3.3. Energy Drinks
- 7.3.4. Other applications
- 7.1. Market Analysis, Insights and Forecast - by Material
- 8. South America US Beverage Packaging Industry Analysis, Insights and Forecast, 2020-2032
- 8.1. Market Analysis, Insights and Forecast - by Material
- 8.1.1. Plastic
- 8.1.2. Metal
- 8.1.3. Glass
- 8.1.4. Paperboard
- 8.2. Market Analysis, Insights and Forecast - by Product Type
- 8.2.1. Bottles
- 8.2.2. Cans
- 8.2.3. Pouches
- 8.2.4. Cartons
- 8.2.5. Beer kegs
- 8.3. Market Analysis, Insights and Forecast - by Application
- 8.3.1. Alcoholic Beverages
- 8.3.2. Milk
- 8.3.3. Energy Drinks
- 8.3.4. Other applications
- 8.1. Market Analysis, Insights and Forecast - by Material
- 9. Europe US Beverage Packaging Industry Analysis, Insights and Forecast, 2020-2032
- 9.1. Market Analysis, Insights and Forecast - by Material
- 9.1.1. Plastic
- 9.1.2. Metal
- 9.1.3. Glass
- 9.1.4. Paperboard
- 9.2. Market Analysis, Insights and Forecast - by Product Type
- 9.2.1. Bottles
- 9.2.2. Cans
- 9.2.3. Pouches
- 9.2.4. Cartons
- 9.2.5. Beer kegs
- 9.3. Market Analysis, Insights and Forecast - by Application
- 9.3.1. Alcoholic Beverages
- 9.3.2. Milk
- 9.3.3. Energy Drinks
- 9.3.4. Other applications
- 9.1. Market Analysis, Insights and Forecast - by Material
- 10. Middle East & Africa US Beverage Packaging Industry Analysis, Insights and Forecast, 2020-2032
- 10.1. Market Analysis, Insights and Forecast - by Material
- 10.1.1. Plastic
- 10.1.2. Metal
- 10.1.3. Glass
- 10.1.4. Paperboard
- 10.2. Market Analysis, Insights and Forecast - by Product Type
- 10.2.1. Bottles
- 10.2.2. Cans
- 10.2.3. Pouches
- 10.2.4. Cartons
- 10.2.5. Beer kegs
- 10.3. Market Analysis, Insights and Forecast - by Application
- 10.3.1. Alcoholic Beverages
- 10.3.2. Milk
- 10.3.3. Energy Drinks
- 10.3.4. Other applications
- 10.1. Market Analysis, Insights and Forecast - by Material
- 11. Asia Pacific US Beverage Packaging Industry Analysis, Insights and Forecast, 2020-2032
- 11.1. Market Analysis, Insights and Forecast - by Material
- 11.1.1. Plastic
- 11.1.2. Metal
- 11.1.3. Glass
- 11.1.4. Paperboard
- 11.2. Market Analysis, Insights and Forecast - by Product Type
- 11.2.1. Bottles
- 11.2.2. Cans
- 11.2.3. Pouches
- 11.2.4. Cartons
- 11.2.5. Beer kegs
- 11.3. Market Analysis, Insights and Forecast - by Application
- 11.3.1. Alcoholic Beverages
- 11.3.2. Milk
- 11.3.3. Energy Drinks
- 11.3.4. Other applications
- 11.1. Market Analysis, Insights and Forecast - by Material
- 12. Competitive Analysis
- 12.1. Company Profiles
- 12.1.1 Ardagh Group
- 12.1.1.1. Company Overview
- 12.1.1.2. Products
- 12.1.1.3. Company Financials
- 12.1.1.4. SWOT Analysis
- 12.1.2 CCL Containers Inc
- 12.1.2.1. Company Overview
- 12.1.2.2. Products
- 12.1.2.3. Company Financials
- 12.1.2.4. SWOT Analysis
- 12.1.3 Sonoco Products Company
- 12.1.3.1. Company Overview
- 12.1.3.2. Products
- 12.1.3.3. Company Financials
- 12.1.3.4. SWOT Analysis
- 12.1.4 Ball Corporation
- 12.1.4.1. Company Overview
- 12.1.4.2. Products
- 12.1.4.3. Company Financials
- 12.1.4.4. SWOT Analysis
- 12.1.5 Silgan Containers Inc
- 12.1.5.1. Company Overview
- 12.1.5.2. Products
- 12.1.5.3. Company Financials
- 12.1.5.4. SWOT Analysis
- 12.1.6 Amcor Limited
- 12.1.6.1. Company Overview
- 12.1.6.2. Products
- 12.1.6.3. Company Financials
- 12.1.6.4. SWOT Analysis
- 12.1.7 Berry Global Inc
- 12.1.7.1. Company Overview
- 12.1.7.2. Products
- 12.1.7.3. Company Financials
- 12.1.7.4. SWOT Analysis
- 12.1.8 Berlin Packaging
- 12.1.8.1. Company Overview
- 12.1.8.2. Products
- 12.1.8.3. Company Financials
- 12.1.8.4. SWOT Analysis
- 12.1.9 Westroc
- 12.1.9.1. Company Overview
- 12.1.9.2. Products
- 12.1.9.3. Company Financials
- 12.1.9.4. SWOT Analysis
- 12.1.10 Crown Holdings Inc
- 12.1.10.1. Company Overview
- 12.1.10.2. Products
- 12.1.10.3. Company Financials
- 12.1.10.4. SWOT Analysis
- 12.1.11 Owens-illinois Inc
- 12.1.11.1. Company Overview
- 12.1.11.2. Products
- 12.1.11.3. Company Financials
- 12.1.11.4. SWOT Analysis
- 12.1.1 Ardagh Group
- 12.2. Market Entropy
- 12.2.1 Company's Key Areas Served
- 12.2.2 Recent Developments
- 12.3. Company Market Share Analysis 2025
- 12.3.1 Top 5 Companies Market Share Analysis
- 12.3.2 Top 3 Companies Market Share Analysis
- 12.4. List of Potential Customers
- 13. Research Methodology
List of Figures
- Figure 1: Global US Beverage Packaging Industry Revenue Breakdown (billion, %) by Region 2025 & 2033
- Figure 2: North America US Beverage Packaging Industry Revenue (billion), by Material 2025 & 2033
- Figure 3: North America US Beverage Packaging Industry Revenue Share (%), by Material 2025 & 2033
- Figure 4: North America US Beverage Packaging Industry Revenue (billion), by Product Type 2025 & 2033
- Figure 5: North America US Beverage Packaging Industry Revenue Share (%), by Product Type 2025 & 2033
- Figure 6: North America US Beverage Packaging Industry Revenue (billion), by Application 2025 & 2033
- Figure 7: North America US Beverage Packaging Industry Revenue Share (%), by Application 2025 & 2033
- Figure 8: North America US Beverage Packaging Industry Revenue (billion), by Country 2025 & 2033
- Figure 9: North America US Beverage Packaging Industry Revenue Share (%), by Country 2025 & 2033
- Figure 10: South America US Beverage Packaging Industry Revenue (billion), by Material 2025 & 2033
- Figure 11: South America US Beverage Packaging Industry Revenue Share (%), by Material 2025 & 2033
- Figure 12: South America US Beverage Packaging Industry Revenue (billion), by Product Type 2025 & 2033
- Figure 13: South America US Beverage Packaging Industry Revenue Share (%), by Product Type 2025 & 2033
- Figure 14: South America US Beverage Packaging Industry Revenue (billion), by Application 2025 & 2033
- Figure 15: South America US Beverage Packaging Industry Revenue Share (%), by Application 2025 & 2033
- Figure 16: South America US Beverage Packaging Industry Revenue (billion), by Country 2025 & 2033
- Figure 17: South America US Beverage Packaging Industry Revenue Share (%), by Country 2025 & 2033
- Figure 18: Europe US Beverage Packaging Industry Revenue (billion), by Material 2025 & 2033
- Figure 19: Europe US Beverage Packaging Industry Revenue Share (%), by Material 2025 & 2033
- Figure 20: Europe US Beverage Packaging Industry Revenue (billion), by Product Type 2025 & 2033
- Figure 21: Europe US Beverage Packaging Industry Revenue Share (%), by Product Type 2025 & 2033
- Figure 22: Europe US Beverage Packaging Industry Revenue (billion), by Application 2025 & 2033
- Figure 23: Europe US Beverage Packaging Industry Revenue Share (%), by Application 2025 & 2033
- Figure 24: Europe US Beverage Packaging Industry Revenue (billion), by Country 2025 & 2033
- Figure 25: Europe US Beverage Packaging Industry Revenue Share (%), by Country 2025 & 2033
- Figure 26: Middle East & Africa US Beverage Packaging Industry Revenue (billion), by Material 2025 & 2033
- Figure 27: Middle East & Africa US Beverage Packaging Industry Revenue Share (%), by Material 2025 & 2033
- Figure 28: Middle East & Africa US Beverage Packaging Industry Revenue (billion), by Product Type 2025 & 2033
- Figure 29: Middle East & Africa US Beverage Packaging Industry Revenue Share (%), by Product Type 2025 & 2033
- Figure 30: Middle East & Africa US Beverage Packaging Industry Revenue (billion), by Application 2025 & 2033
- Figure 31: Middle East & Africa US Beverage Packaging Industry Revenue Share (%), by Application 2025 & 2033
- Figure 32: Middle East & Africa US Beverage Packaging Industry Revenue (billion), by Country 2025 & 2033
- Figure 33: Middle East & Africa US Beverage Packaging Industry Revenue Share (%), by Country 2025 & 2033
- Figure 34: Asia Pacific US Beverage Packaging Industry Revenue (billion), by Material 2025 & 2033
- Figure 35: Asia Pacific US Beverage Packaging Industry Revenue Share (%), by Material 2025 & 2033
- Figure 36: Asia Pacific US Beverage Packaging Industry Revenue (billion), by Product Type 2025 & 2033
- Figure 37: Asia Pacific US Beverage Packaging Industry Revenue Share (%), by Product Type 2025 & 2033
- Figure 38: Asia Pacific US Beverage Packaging Industry Revenue (billion), by Application 2025 & 2033
- Figure 39: Asia Pacific US Beverage Packaging Industry Revenue Share (%), by Application 2025 & 2033
- Figure 40: Asia Pacific US Beverage Packaging Industry Revenue (billion), by Country 2025 & 2033
- Figure 41: Asia Pacific US Beverage Packaging Industry Revenue Share (%), by Country 2025 & 2033
List of Tables
- Table 1: Global US Beverage Packaging Industry Revenue billion Forecast, by Material 2020 & 2033
- Table 2: Global US Beverage Packaging Industry Revenue billion Forecast, by Product Type 2020 & 2033
- Table 3: Global US Beverage Packaging Industry Revenue billion Forecast, by Application 2020 & 2033
- Table 4: Global US Beverage Packaging Industry Revenue billion Forecast, by Region 2020 & 2033
- Table 5: Global US Beverage Packaging Industry Revenue billion Forecast, by Material 2020 & 2033
- Table 6: Global US Beverage Packaging Industry Revenue billion Forecast, by Product Type 2020 & 2033
- Table 7: Global US Beverage Packaging Industry Revenue billion Forecast, by Application 2020 & 2033
- Table 8: Global US Beverage Packaging Industry Revenue billion Forecast, by Country 2020 & 2033
- Table 9: United States US Beverage Packaging Industry Revenue (billion) Forecast, by Application 2020 & 2033
- Table 10: Canada US Beverage Packaging Industry Revenue (billion) Forecast, by Application 2020 & 2033
- Table 11: Mexico US Beverage Packaging Industry Revenue (billion) Forecast, by Application 2020 & 2033
- Table 12: Global US Beverage Packaging Industry Revenue billion Forecast, by Material 2020 & 2033
- Table 13: Global US Beverage Packaging Industry Revenue billion Forecast, by Product Type 2020 & 2033
- Table 14: Global US Beverage Packaging Industry Revenue billion Forecast, by Application 2020 & 2033
- Table 15: Global US Beverage Packaging Industry Revenue billion Forecast, by Country 2020 & 2033
- Table 16: Brazil US Beverage Packaging Industry Revenue (billion) Forecast, by Application 2020 & 2033
- Table 17: Argentina US Beverage Packaging Industry Revenue (billion) Forecast, by Application 2020 & 2033
- Table 18: Rest of South America US Beverage Packaging Industry Revenue (billion) Forecast, by Application 2020 & 2033
- Table 19: Global US Beverage Packaging Industry Revenue billion Forecast, by Material 2020 & 2033
- Table 20: Global US Beverage Packaging Industry Revenue billion Forecast, by Product Type 2020 & 2033
- Table 21: Global US Beverage Packaging Industry Revenue billion Forecast, by Application 2020 & 2033
- Table 22: Global US Beverage Packaging Industry Revenue billion Forecast, by Country 2020 & 2033
- Table 23: United Kingdom US Beverage Packaging Industry Revenue (billion) Forecast, by Application 2020 & 2033
- Table 24: Germany US Beverage Packaging Industry Revenue (billion) Forecast, by Application 2020 & 2033
- Table 25: France US Beverage Packaging Industry Revenue (billion) Forecast, by Application 2020 & 2033
- Table 26: Italy US Beverage Packaging Industry Revenue (billion) Forecast, by Application 2020 & 2033
- Table 27: Spain US Beverage Packaging Industry Revenue (billion) Forecast, by Application 2020 & 2033
- Table 28: Russia US Beverage Packaging Industry Revenue (billion) Forecast, by Application 2020 & 2033
- Table 29: Benelux US Beverage Packaging Industry Revenue (billion) Forecast, by Application 2020 & 2033
- Table 30: Nordics US Beverage Packaging Industry Revenue (billion) Forecast, by Application 2020 & 2033
- Table 31: Rest of Europe US Beverage Packaging Industry Revenue (billion) Forecast, by Application 2020 & 2033
- Table 32: Global US Beverage Packaging Industry Revenue billion Forecast, by Material 2020 & 2033
- Table 33: Global US Beverage Packaging Industry Revenue billion Forecast, by Product Type 2020 & 2033
- Table 34: Global US Beverage Packaging Industry Revenue billion Forecast, by Application 2020 & 2033
- Table 35: Global US Beverage Packaging Industry Revenue billion Forecast, by Country 2020 & 2033
- Table 36: Turkey US Beverage Packaging Industry Revenue (billion) Forecast, by Application 2020 & 2033
- Table 37: Israel US Beverage Packaging Industry Revenue (billion) Forecast, by Application 2020 & 2033
- Table 38: GCC US Beverage Packaging Industry Revenue (billion) Forecast, by Application 2020 & 2033
- Table 39: North Africa US Beverage Packaging Industry Revenue (billion) Forecast, by Application 2020 & 2033
- Table 40: South Africa US Beverage Packaging Industry Revenue (billion) Forecast, by Application 2020 & 2033
- Table 41: Rest of Middle East & Africa US Beverage Packaging Industry Revenue (billion) Forecast, by Application 2020 & 2033
- Table 42: Global US Beverage Packaging Industry Revenue billion Forecast, by Material 2020 & 2033
- Table 43: Global US Beverage Packaging Industry Revenue billion Forecast, by Product Type 2020 & 2033
- Table 44: Global US Beverage Packaging Industry Revenue billion Forecast, by Application 2020 & 2033
- Table 45: Global US Beverage Packaging Industry Revenue billion Forecast, by Country 2020 & 2033
- Table 46: China US Beverage Packaging Industry Revenue (billion) Forecast, by Application 2020 & 2033
- Table 47: India US Beverage Packaging Industry Revenue (billion) Forecast, by Application 2020 & 2033
- Table 48: Japan US Beverage Packaging Industry Revenue (billion) Forecast, by Application 2020 & 2033
- Table 49: South Korea US Beverage Packaging Industry Revenue (billion) Forecast, by Application 2020 & 2033
- Table 50: ASEAN US Beverage Packaging Industry Revenue (billion) Forecast, by Application 2020 & 2033
- Table 51: Oceania US Beverage Packaging Industry Revenue (billion) Forecast, by Application 2020 & 2033
- Table 52: Rest of Asia Pacific US Beverage Packaging Industry Revenue (billion) Forecast, by Application 2020 & 2033
Frequently Asked Questions
1. What is the projected Compound Annual Growth Rate (CAGR) of the US Beverage Packaging Industry?
The projected CAGR is approximately 6.57%.
2. Which companies are prominent players in the US Beverage Packaging Industry?
Key companies in the market include Ardagh Group, CCL Containers Inc, Sonoco Products Company, Ball Corporation, Silgan Containers Inc, Amcor Limited, Berry Global Inc, Berlin Packaging, Westroc, Crown Holdings Inc, Owens-illinois Inc.
3. What are the main segments of the US Beverage Packaging Industry?
The market segments include Material, Product Type, Application.
4. Can you provide details about the market size?
The market size is estimated to be USD 42.16 billion as of 2022.
5. What are some drivers contributing to market growth?
Growing Demand for Bottled Beverages is Driving the Market in the Wine Industry; Increased Integration in the Premium Packaging Market Further Drives the Growth.
6. What are the notable trends driving market growth?
Alcohol Beverages to hold significant market share.
7. Are there any restraints impacting market growth?
People's Attitude Towards Sustainable Forms of Packaging.
8. Can you provide examples of recent developments in the market?
July 2021 - Ball Corporation is planning to significantly increase its manufacturing capacity, with new cutting-edge facilities in the UK and Russia. With an increasing consumer call for more sustainable purchasing options and a growing number of new brands and beverage categories choosing cans, demand for aluminum packaging is rapidly expanding around the world.
9. What pricing options are available for accessing the report?
Pricing options include single-user, multi-user, and enterprise licenses priced at USD 3800, USD 4500, and USD 5800 respectively.
10. Is the market size provided in terms of value or volume?
The market size is provided in terms of value, measured in billion.
11. Are there any specific market keywords associated with the report?
Yes, the market keyword associated with the report is "US Beverage Packaging Industry," which aids in identifying and referencing the specific market segment covered.
12. How do I determine which pricing option suits my needs best?
The pricing options vary based on user requirements and access needs. Individual users may opt for single-user licenses, while businesses requiring broader access may choose multi-user or enterprise licenses for cost-effective access to the report.
13. Are there any additional resources or data provided in the US Beverage Packaging Industry report?
While the report offers comprehensive insights, it's advisable to review the specific contents or supplementary materials provided to ascertain if additional resources or data are available.
14. How can I stay updated on further developments or reports in the US Beverage Packaging Industry?
To stay informed about further developments, trends, and reports in the US Beverage Packaging Industry, consider subscribing to industry newsletters, following relevant companies and organizations, or regularly checking reputable industry news sources and publications.
Methodology
Step 1 - Identification of Relevant Samples Size from Population Database


Step 2 - Approaches for Defining Global Market Size (Value, Volume* & Price*)

Note*: In applicable scenarios
Step 3 - Data Sources
Primary Research
- Web Analytics
- Survey Reports
- Research Institute
- Latest Research Reports
- Opinion Leaders
Secondary Research
- Annual Reports
- White Paper
- Latest Press Release
- Industry Association
- Paid Database
- Investor Presentations

Step 4 - Data Triangulation
Involves using different sources of information in order to increase the validity of a study
These sources are likely to be stakeholders in a program - participants, other researchers, program staff, other community members, and so on.
Then we put all data in single framework & apply various statistical tools to find out the dynamic on the market.
During the analysis stage, feedback from the stakeholder groups would be compared to determine areas of agreement as well as areas of divergence