

Key Insights
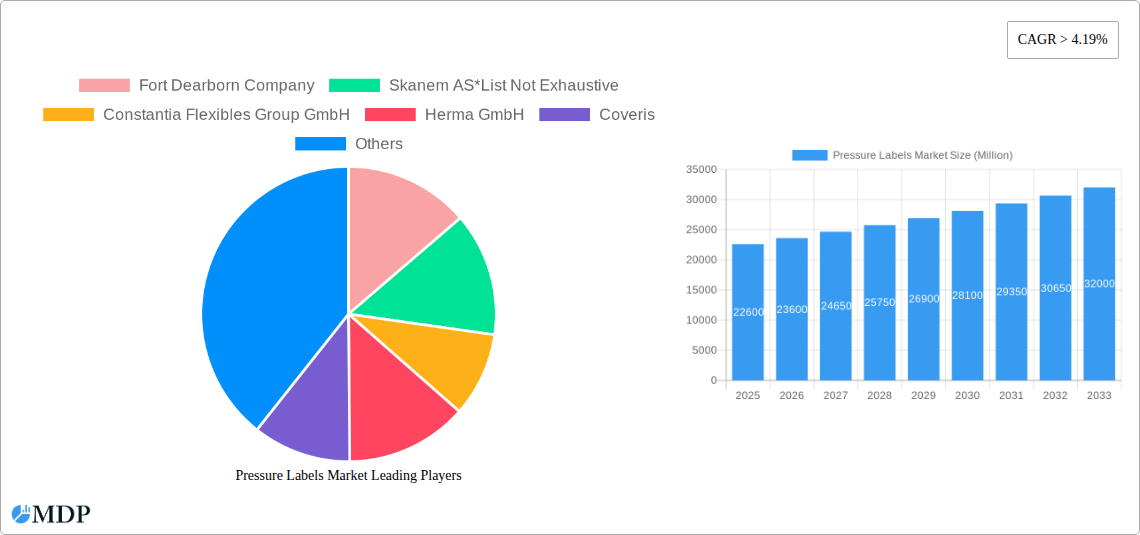
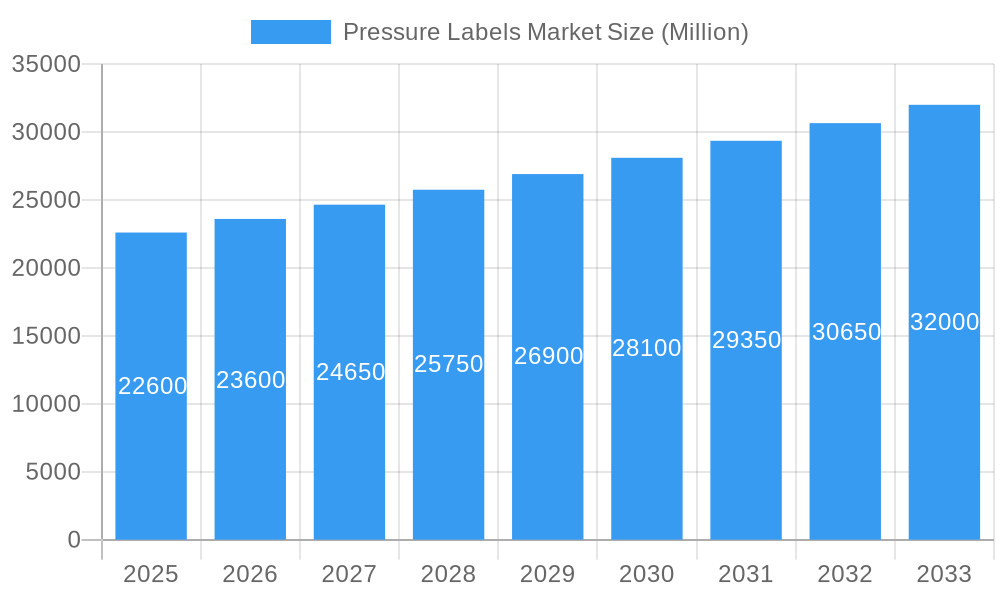
The pressure-sensitive label market, valued at $22.60 billion in 2025, is experiencing robust growth, projected to expand at a Compound Annual Growth Rate (CAGR) exceeding 4.19% from 2025 to 2033. This growth is fueled by several key factors. The burgeoning food and beverage industry, with its increasing demand for attractive and informative product labeling, is a significant driver. Similarly, the healthcare sector's reliance on accurate and tamper-evident labels for pharmaceuticals and medical devices contributes substantially to market expansion. E-commerce's continued rise also plays a crucial role, necessitating efficient and secure labeling solutions for shipping and logistics. Technological advancements, such as the adoption of digital printing techniques like inkjet, offer greater flexibility and customization options, further stimulating market growth. While the market faces some restraints, such as fluctuations in raw material prices and environmental concerns related to label waste, the overall outlook remains positive. The diverse segmentation by end-user industry and print process offers significant opportunities for market players. The dominance of established players like Avery Dennison and CCL Industries indicates a mature market, yet the ongoing innovation and demand for specialized labels create room for new entrants and strategic partnerships.
Pressure Labels Market Market Size (In Billion)
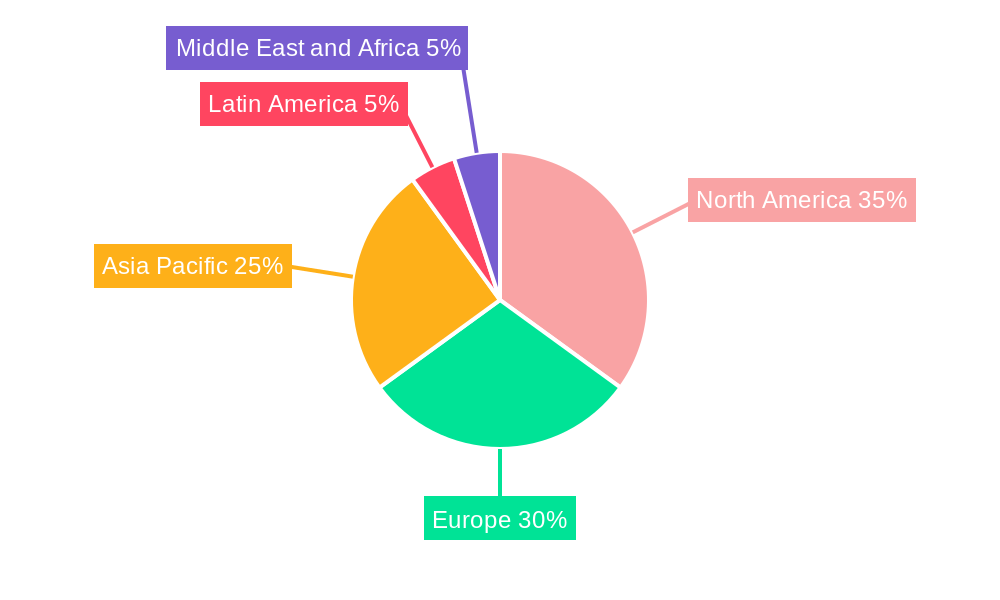
The market's geographical distribution is likely to see variations. North America and Europe, with their established industries and higher per capita consumption, currently hold significant market shares. However, rapidly developing economies in Asia-Pacific, particularly China and India, are poised for significant growth, driven by expanding manufacturing sectors and rising consumer demand. Latin America and the Middle East & Africa are also projected to demonstrate moderate growth, albeit at a slower pace compared to Asia-Pacific. The competitive landscape is characterized by a mix of large multinational corporations and regional players, with competition primarily centered around innovation, pricing strategies, and efficient supply chain management. The ongoing focus on sustainability within the industry will likely influence future growth trajectories, demanding more eco-friendly label materials and manufacturing processes.
Pressure Labels Market Company Market Share
Pressure Sensitive Labels Market: A Comprehensive Report (2019-2033)
This in-depth report provides a comprehensive analysis of the global pressure sensitive labels market, covering market dynamics, industry trends, leading segments, key players, and future growth prospects. The study period spans from 2019 to 2033, with 2025 serving as the base and estimated year. The report offers actionable insights for industry stakeholders, investors, and businesses seeking to navigate this dynamic market. The market is projected to reach xx Million by 2033, exhibiting a robust CAGR of xx% during the forecast period (2025-2033).
Pressure Labels Market Market Dynamics & Concentration
The pressure sensitive labels market is characterized by a moderately concentrated landscape, with several major players holding significant market share. However, the presence of numerous smaller regional and specialized players fosters competition and innovation. Market concentration is estimated at xx% in 2025, indicating a balance between established giants and agile newcomers. Several factors drive market dynamics:
- Innovation: Continuous advancements in printing technologies (e.g., digital printing), adhesive formulations, and substrate materials are key drivers.
- Regulatory landscape: Evolving regulations concerning food safety, labeling requirements, and sustainability influence material selection and manufacturing processes. This includes compliance with regulations in different regions regarding labeling information and material composition.
- Product substitutes: While pressure sensitive labels remain dominant, alternative labeling technologies (e.g., inkjet printing directly onto products) pose a moderate threat, particularly in niche applications.
- End-user trends: Growing demand from various sectors, particularly food and beverage, healthcare, and e-commerce, fuels market expansion. The increasing preference for customized and aesthetically appealing labels is also noteworthy.
- M&A activity: The market has witnessed several mergers and acquisitions (M&As) in recent years, indicating consolidation and strategic expansion among major players. An estimated xx M&A deals occurred between 2019 and 2024, with a projected xx deals for 2025-2033.
Pressure Labels Market Industry Trends & Analysis
The pressure sensitive labels market is experiencing significant growth driven by several key factors. The increasing demand for packaged goods across various sectors, coupled with the growing preference for aesthetically pleasing and informative labels, is a major driver. Technological advancements in printing techniques, like digital printing, allow for greater customization and shorter lead times, further boosting market expansion. Consumer preferences toward sustainable and eco-friendly labels are creating opportunities for manufacturers using recycled materials and implementing sustainable manufacturing processes. Competitive dynamics are characterized by innovation, strategic partnerships, and pricing strategies. The market has witnessed a xx% increase in the adoption of digital printing technologies between 2019 and 2024, suggesting a strong technological disruption trend. This trend is expected to continue, leading to a projected market penetration of xx% by 2033.
Leading Markets & Segments in Pressure Labels Market
The global pressure sensitive labels market is geographically diverse, with regional variations in growth rates and market dynamics.
By End-User Industry:
- Food and Beverage: This segment holds the largest market share, driven by the growing packaged food and beverage industry and stringent labeling regulations.
- Healthcare: Stringent regulations and the need for tamper-evident labels drive growth in this segment.
- Cosmetics: Aesthetically appealing labels are critical, leading to high demand for innovative design and material options.
Key Drivers by Region:
- North America: Strong consumer demand, advanced infrastructure, and technological advancements drive growth.
- Europe: Stringent environmental regulations and focus on sustainability influence market trends.
- Asia Pacific: Rapid economic growth and industrialization in countries like China and India fuel market expansion.
By Print Process:
- Flexography: Remains the dominant print process due to cost-effectiveness and high-volume production capabilities.
- Gravure: Used for high-quality printing, especially on large rolls.
- Digital Printing: Rapidly gaining traction due to its customization capabilities and reduced waste.
Pressure Labels Market Product Developments
Recent product innovations focus on sustainable materials, enhanced adhesive properties, and improved printing technologies. The development of Rayoface AQBSA by Innovia Films in April 2023 exemplifies the focus on printable coated BOPP films for pressure-sensitive labeling, highlighting a shift towards specialized and high-performance materials. These advancements offer enhanced durability, improved printability, and greater environmental friendliness, improving market fit and competitiveness.
Key Drivers of Pressure Labels Market Growth
Several factors contribute to the market's growth trajectory:
- Technological advancements: Improvements in printing technologies, adhesive formulations, and substrate materials enhance label quality, durability, and sustainability.
- Economic growth: Growing disposable incomes and increased consumption in developing economies fuel demand for packaged goods and hence, labels.
- Regulatory compliance: Stringent labeling regulations across various industries drive market growth.
Challenges in the Pressure Labels Market Market
The pressure sensitive labels market faces challenges such as:
- Fluctuating raw material prices: Increases in raw material costs (e.g., adhesives, substrates) impact profitability.
- Supply chain disruptions: Geopolitical events and logistical hurdles can affect the timely delivery of materials.
- Intense competition: The presence of numerous players creates a competitive landscape demanding continuous innovation.
Emerging Opportunities in Pressure Labels Market
The market offers promising opportunities:
- Sustainable materials: Growing demand for eco-friendly labels using recycled or biodegradable materials creates opportunities.
- Smart labels: Integration of RFID and other technologies for tracking and authentication is gaining traction.
- Market expansion: Growth in developing economies presents significant expansion potential.
Leading Players in the Pressure Labels Market Sector
- Fort Dearborn Company
- Skanem AS
- Constantia Flexibles Group GmbH
- Herma GmbH
- Coveris
- Westrock Company
- Inland Printing Co Ltd
- UPM Raflatac Inc
- Taylor Corporation
- Huhtamaki Group
- CCL Industries Inc
- Avery Dennison Corp
- Fuji Seal International Inc
- Taghleef Industries Inc (Al Ghurair Group)
- Multicolor Corporation
- Folienprint RAKO GmbH
Key Milestones in Pressure Labels Market Industry
- December 2023: Sentinel Capital Partners' recapitalization of Online Labels Group (OLG) signifies consolidation and expansion in the pressure-sensitive labeling sector.
- April 2023: Innovia Films' launch of Rayoface AQBSA demonstrates innovation in printable coated BOPP films, catering to the demand for advanced PSL applications.
Strategic Outlook for Pressure Labels Market Market
The pressure sensitive labels market is poised for sustained growth, driven by technological innovation, increasing consumer demand, and stringent regulatory requirements. Strategic partnerships, investments in sustainable materials, and expansion into new markets will be crucial for success. The focus on customization, sustainability, and smart labeling technologies will shape future market dynamics.
Pressure Labels Market Segmentation
-
1. Print Process
- 1.1. Gravure
- 1.2. Flexography
- 1.3. Screen
- 1.4. Letterpress
- 1.5. Inkjet
- 1.6. Other Pr
-
2. End-User Industry
- 2.1. Food
- 2.2. Beverage
- 2.3. Healthcare
- 2.4. Cosmetics
- 2.5. Household
- 2.6. Industri
- 2.7. Logistics
- 2.8. Other End-user Industries
Pressure Labels Market Segmentation By Geography
-
1. North America
- 1.1. United States
- 1.2. Canada
-
2. Europe
- 2.1. United Kingdom
- 2.2. Germany
- 2.3. France
- 2.4. Spain
- 2.5. Rest of Europe
-
3. Asia Pacific
- 3.1. China
- 3.2. India
- 3.3. Japan
- 3.4. Rest of Asia Pacific
- 4. Latin America
- 5. Middle East and Africa
Pressure Labels Market Regional Market Share
Geographic Coverage of Pressure Labels Market
Pressure Labels Market REPORT HIGHLIGHTS
| Aspects | Details |
|---|---|
| Study Period | 2020-2034 |
| Base Year | 2025 |
| Estimated Year | 2026 |
| Forecast Period | 2026-2034 |
| Historical Period | 2020-2025 |
| Growth Rate | CAGR of > 4.19% from 2020-2034 |
| Segmentation |
|
Table of Contents
- 1. Introduction
- 1.1. Research Scope
- 1.2. Market Segmentation
- 1.3. Research Objective
- 1.4. Definitions and Assumptions
- 2. Executive Summary
- 2.1. Market Snapshot
- 3. Market Dynamics
- 3.1. Market Drivers
- 3.2. Market Restrains
- 3.3. Market Trends
- 3.4. Market Opportunities
- 4. Market Factor Analysis
- 4.1. Porters Five Forces
- 4.1.1. Bargaining Power of Suppliers
- 4.1.2. Bargaining Power of Buyers
- 4.1.3. Threat of New Entrants
- 4.1.4. Threat of Substitutes
- 4.1.5. Competitive Rivalry
- 4.2. PESTEL analysis
- 4.3. BCG Analysis
- 4.3.1. Stars (High Growth, High Market Share)
- 4.3.2. Cash Cows (Low Growth, High Market Share)
- 4.3.3. Question Mark (High Growth, Low Market Share)
- 4.3.4. Dogs (Low Growth, Low Market Share)
- 4.4. Ansoff Matrix Analysis
- 4.5. Supply Chain Analysis
- 4.6. Regulatory Landscape
- 4.7. Current Market Potential and Opportunity Assessment (TAM–SAM–SOM Framework)
- 4.8. MDP Analyst Note
- 4.1. Porters Five Forces
- 5. Market Analysis, Insights and Forecast 2021-2033
- 5.1. Market Analysis, Insights and Forecast - by Print Process
- 5.1.1. Gravure
- 5.1.2. Flexography
- 5.1.3. Screen
- 5.1.4. Letterpress
- 5.1.5. Inkjet
- 5.1.6. Other Pr
- 5.2. Market Analysis, Insights and Forecast - by End-User Industry
- 5.2.1. Food
- 5.2.2. Beverage
- 5.2.3. Healthcare
- 5.2.4. Cosmetics
- 5.2.5. Household
- 5.2.6. Industri
- 5.2.7. Logistics
- 5.2.8. Other End-user Industries
- 5.3. Market Analysis, Insights and Forecast - by Region
- 5.3.1. North America
- 5.3.2. Europe
- 5.3.3. Asia Pacific
- 5.3.4. Latin America
- 5.3.5. Middle East and Africa
- 5.1. Market Analysis, Insights and Forecast - by Print Process
- 6. Global Pressure Labels Market Analysis, Insights and Forecast, 2021-2033
- 6.1. Market Analysis, Insights and Forecast - by Print Process
- 6.1.1. Gravure
- 6.1.2. Flexography
- 6.1.3. Screen
- 6.1.4. Letterpress
- 6.1.5. Inkjet
- 6.1.6. Other Pr
- 6.2. Market Analysis, Insights and Forecast - by End-User Industry
- 6.2.1. Food
- 6.2.2. Beverage
- 6.2.3. Healthcare
- 6.2.4. Cosmetics
- 6.2.5. Household
- 6.2.6. Industri
- 6.2.7. Logistics
- 6.2.8. Other End-user Industries
- 6.1. Market Analysis, Insights and Forecast - by Print Process
- 7. North America Pressure Labels Market Analysis, Insights and Forecast, 2020-2032
- 7.1. Market Analysis, Insights and Forecast - by Print Process
- 7.1.1. Gravure
- 7.1.2. Flexography
- 7.1.3. Screen
- 7.1.4. Letterpress
- 7.1.5. Inkjet
- 7.1.6. Other Pr
- 7.2. Market Analysis, Insights and Forecast - by End-User Industry
- 7.2.1. Food
- 7.2.2. Beverage
- 7.2.3. Healthcare
- 7.2.4. Cosmetics
- 7.2.5. Household
- 7.2.6. Industri
- 7.2.7. Logistics
- 7.2.8. Other End-user Industries
- 7.1. Market Analysis, Insights and Forecast - by Print Process
- 8. Europe Pressure Labels Market Analysis, Insights and Forecast, 2020-2032
- 8.1. Market Analysis, Insights and Forecast - by Print Process
- 8.1.1. Gravure
- 8.1.2. Flexography
- 8.1.3. Screen
- 8.1.4. Letterpress
- 8.1.5. Inkjet
- 8.1.6. Other Pr
- 8.2. Market Analysis, Insights and Forecast - by End-User Industry
- 8.2.1. Food
- 8.2.2. Beverage
- 8.2.3. Healthcare
- 8.2.4. Cosmetics
- 8.2.5. Household
- 8.2.6. Industri
- 8.2.7. Logistics
- 8.2.8. Other End-user Industries
- 8.1. Market Analysis, Insights and Forecast - by Print Process
- 9. Asia Pacific Pressure Labels Market Analysis, Insights and Forecast, 2020-2032
- 9.1. Market Analysis, Insights and Forecast - by Print Process
- 9.1.1. Gravure
- 9.1.2. Flexography
- 9.1.3. Screen
- 9.1.4. Letterpress
- 9.1.5. Inkjet
- 9.1.6. Other Pr
- 9.2. Market Analysis, Insights and Forecast - by End-User Industry
- 9.2.1. Food
- 9.2.2. Beverage
- 9.2.3. Healthcare
- 9.2.4. Cosmetics
- 9.2.5. Household
- 9.2.6. Industri
- 9.2.7. Logistics
- 9.2.8. Other End-user Industries
- 9.1. Market Analysis, Insights and Forecast - by Print Process
- 10. Latin America Pressure Labels Market Analysis, Insights and Forecast, 2020-2032
- 10.1. Market Analysis, Insights and Forecast - by Print Process
- 10.1.1. Gravure
- 10.1.2. Flexography
- 10.1.3. Screen
- 10.1.4. Letterpress
- 10.1.5. Inkjet
- 10.1.6. Other Pr
- 10.2. Market Analysis, Insights and Forecast - by End-User Industry
- 10.2.1. Food
- 10.2.2. Beverage
- 10.2.3. Healthcare
- 10.2.4. Cosmetics
- 10.2.5. Household
- 10.2.6. Industri
- 10.2.7. Logistics
- 10.2.8. Other End-user Industries
- 10.1. Market Analysis, Insights and Forecast - by Print Process
- 11. Middle East and Africa Pressure Labels Market Analysis, Insights and Forecast, 2020-2032
- 11.1. Market Analysis, Insights and Forecast - by Print Process
- 11.1.1. Gravure
- 11.1.2. Flexography
- 11.1.3. Screen
- 11.1.4. Letterpress
- 11.1.5. Inkjet
- 11.1.6. Other Pr
- 11.2. Market Analysis, Insights and Forecast - by End-User Industry
- 11.2.1. Food
- 11.2.2. Beverage
- 11.2.3. Healthcare
- 11.2.4. Cosmetics
- 11.2.5. Household
- 11.2.6. Industri
- 11.2.7. Logistics
- 11.2.8. Other End-user Industries
- 11.1. Market Analysis, Insights and Forecast - by Print Process
- 12. Competitive Analysis
- 12.1. Company Profiles
- 12.1.1 Fort Dearborn Company
- 12.1.1.1. Company Overview
- 12.1.1.2. Products
- 12.1.1.3. Company Financials
- 12.1.1.4. SWOT Analysis
- 12.1.2 Skanem AS*List Not Exhaustive
- 12.1.2.1. Company Overview
- 12.1.2.2. Products
- 12.1.2.3. Company Financials
- 12.1.2.4. SWOT Analysis
- 12.1.3 Constantia Flexibles Group GmbH
- 12.1.3.1. Company Overview
- 12.1.3.2. Products
- 12.1.3.3. Company Financials
- 12.1.3.4. SWOT Analysis
- 12.1.4 Herma GmbH
- 12.1.4.1. Company Overview
- 12.1.4.2. Products
- 12.1.4.3. Company Financials
- 12.1.4.4. SWOT Analysis
- 12.1.5 Coveris
- 12.1.5.1. Company Overview
- 12.1.5.2. Products
- 12.1.5.3. Company Financials
- 12.1.5.4. SWOT Analysis
- 12.1.6 Westrock Company
- 12.1.6.1. Company Overview
- 12.1.6.2. Products
- 12.1.6.3. Company Financials
- 12.1.6.4. SWOT Analysis
- 12.1.7 Inland Printing Co Ltd
- 12.1.7.1. Company Overview
- 12.1.7.2. Products
- 12.1.7.3. Company Financials
- 12.1.7.4. SWOT Analysis
- 12.1.8 UPM Raflatac Inc
- 12.1.8.1. Company Overview
- 12.1.8.2. Products
- 12.1.8.3. Company Financials
- 12.1.8.4. SWOT Analysis
- 12.1.9 Taylor Corporation
- 12.1.9.1. Company Overview
- 12.1.9.2. Products
- 12.1.9.3. Company Financials
- 12.1.9.4. SWOT Analysis
- 12.1.10 Huhtamaki Group
- 12.1.10.1. Company Overview
- 12.1.10.2. Products
- 12.1.10.3. Company Financials
- 12.1.10.4. SWOT Analysis
- 12.1.11 CCL Industries Inc
- 12.1.11.1. Company Overview
- 12.1.11.2. Products
- 12.1.11.3. Company Financials
- 12.1.11.4. SWOT Analysis
- 12.1.12 Avery Dennison Corp
- 12.1.12.1. Company Overview
- 12.1.12.2. Products
- 12.1.12.3. Company Financials
- 12.1.12.4. SWOT Analysis
- 12.1.13 Fuji Seal International Inc
- 12.1.13.1. Company Overview
- 12.1.13.2. Products
- 12.1.13.3. Company Financials
- 12.1.13.4. SWOT Analysis
- 12.1.14 Taghleef Industries Inc (Al Ghurair Group)
- 12.1.14.1. Company Overview
- 12.1.14.2. Products
- 12.1.14.3. Company Financials
- 12.1.14.4. SWOT Analysis
- 12.1.15 Multicolor Corporation
- 12.1.15.1. Company Overview
- 12.1.15.2. Products
- 12.1.15.3. Company Financials
- 12.1.15.4. SWOT Analysis
- 12.1.16 Folienprint RAKO GmbH
- 12.1.16.1. Company Overview
- 12.1.16.2. Products
- 12.1.16.3. Company Financials
- 12.1.16.4. SWOT Analysis
- 12.1.1 Fort Dearborn Company
- 12.2. Market Entropy
- 12.2.1 Company's Key Areas Served
- 12.2.2 Recent Developments
- 12.3. Company Market Share Analysis 2025
- 12.3.1 Top 5 Companies Market Share Analysis
- 12.3.2 Top 3 Companies Market Share Analysis
- 12.4. List of Potential Customers
- 13. Research Methodology
List of Figures
- Figure 1: Global Pressure Labels Market Revenue Breakdown (Million, %) by Region 2025 & 2033
- Figure 2: North America Pressure Labels Market Revenue (Million), by Print Process 2025 & 2033
- Figure 3: North America Pressure Labels Market Revenue Share (%), by Print Process 2025 & 2033
- Figure 4: North America Pressure Labels Market Revenue (Million), by End-User Industry 2025 & 2033
- Figure 5: North America Pressure Labels Market Revenue Share (%), by End-User Industry 2025 & 2033
- Figure 6: North America Pressure Labels Market Revenue (Million), by Country 2025 & 2033
- Figure 7: North America Pressure Labels Market Revenue Share (%), by Country 2025 & 2033
- Figure 8: Europe Pressure Labels Market Revenue (Million), by Print Process 2025 & 2033
- Figure 9: Europe Pressure Labels Market Revenue Share (%), by Print Process 2025 & 2033
- Figure 10: Europe Pressure Labels Market Revenue (Million), by End-User Industry 2025 & 2033
- Figure 11: Europe Pressure Labels Market Revenue Share (%), by End-User Industry 2025 & 2033
- Figure 12: Europe Pressure Labels Market Revenue (Million), by Country 2025 & 2033
- Figure 13: Europe Pressure Labels Market Revenue Share (%), by Country 2025 & 2033
- Figure 14: Asia Pacific Pressure Labels Market Revenue (Million), by Print Process 2025 & 2033
- Figure 15: Asia Pacific Pressure Labels Market Revenue Share (%), by Print Process 2025 & 2033
- Figure 16: Asia Pacific Pressure Labels Market Revenue (Million), by End-User Industry 2025 & 2033
- Figure 17: Asia Pacific Pressure Labels Market Revenue Share (%), by End-User Industry 2025 & 2033
- Figure 18: Asia Pacific Pressure Labels Market Revenue (Million), by Country 2025 & 2033
- Figure 19: Asia Pacific Pressure Labels Market Revenue Share (%), by Country 2025 & 2033
- Figure 20: Latin America Pressure Labels Market Revenue (Million), by Print Process 2025 & 2033
- Figure 21: Latin America Pressure Labels Market Revenue Share (%), by Print Process 2025 & 2033
- Figure 22: Latin America Pressure Labels Market Revenue (Million), by End-User Industry 2025 & 2033
- Figure 23: Latin America Pressure Labels Market Revenue Share (%), by End-User Industry 2025 & 2033
- Figure 24: Latin America Pressure Labels Market Revenue (Million), by Country 2025 & 2033
- Figure 25: Latin America Pressure Labels Market Revenue Share (%), by Country 2025 & 2033
- Figure 26: Middle East and Africa Pressure Labels Market Revenue (Million), by Print Process 2025 & 2033
- Figure 27: Middle East and Africa Pressure Labels Market Revenue Share (%), by Print Process 2025 & 2033
- Figure 28: Middle East and Africa Pressure Labels Market Revenue (Million), by End-User Industry 2025 & 2033
- Figure 29: Middle East and Africa Pressure Labels Market Revenue Share (%), by End-User Industry 2025 & 2033
- Figure 30: Middle East and Africa Pressure Labels Market Revenue (Million), by Country 2025 & 2033
- Figure 31: Middle East and Africa Pressure Labels Market Revenue Share (%), by Country 2025 & 2033
List of Tables
- Table 1: Global Pressure Labels Market Revenue Million Forecast, by Print Process 2020 & 2033
- Table 2: Global Pressure Labels Market Revenue Million Forecast, by End-User Industry 2020 & 2033
- Table 3: Global Pressure Labels Market Revenue Million Forecast, by Region 2020 & 2033
- Table 4: Global Pressure Labels Market Revenue Million Forecast, by Print Process 2020 & 2033
- Table 5: Global Pressure Labels Market Revenue Million Forecast, by End-User Industry 2020 & 2033
- Table 6: Global Pressure Labels Market Revenue Million Forecast, by Country 2020 & 2033
- Table 7: United States Pressure Labels Market Revenue (Million) Forecast, by Application 2020 & 2033
- Table 8: Canada Pressure Labels Market Revenue (Million) Forecast, by Application 2020 & 2033
- Table 9: Global Pressure Labels Market Revenue Million Forecast, by Print Process 2020 & 2033
- Table 10: Global Pressure Labels Market Revenue Million Forecast, by End-User Industry 2020 & 2033
- Table 11: Global Pressure Labels Market Revenue Million Forecast, by Country 2020 & 2033
- Table 12: United Kingdom Pressure Labels Market Revenue (Million) Forecast, by Application 2020 & 2033
- Table 13: Germany Pressure Labels Market Revenue (Million) Forecast, by Application 2020 & 2033
- Table 14: France Pressure Labels Market Revenue (Million) Forecast, by Application 2020 & 2033
- Table 15: Spain Pressure Labels Market Revenue (Million) Forecast, by Application 2020 & 2033
- Table 16: Rest of Europe Pressure Labels Market Revenue (Million) Forecast, by Application 2020 & 2033
- Table 17: Global Pressure Labels Market Revenue Million Forecast, by Print Process 2020 & 2033
- Table 18: Global Pressure Labels Market Revenue Million Forecast, by End-User Industry 2020 & 2033
- Table 19: Global Pressure Labels Market Revenue Million Forecast, by Country 2020 & 2033
- Table 20: China Pressure Labels Market Revenue (Million) Forecast, by Application 2020 & 2033
- Table 21: India Pressure Labels Market Revenue (Million) Forecast, by Application 2020 & 2033
- Table 22: Japan Pressure Labels Market Revenue (Million) Forecast, by Application 2020 & 2033
- Table 23: Rest of Asia Pacific Pressure Labels Market Revenue (Million) Forecast, by Application 2020 & 2033
- Table 24: Global Pressure Labels Market Revenue Million Forecast, by Print Process 2020 & 2033
- Table 25: Global Pressure Labels Market Revenue Million Forecast, by End-User Industry 2020 & 2033
- Table 26: Global Pressure Labels Market Revenue Million Forecast, by Country 2020 & 2033
- Table 27: Global Pressure Labels Market Revenue Million Forecast, by Print Process 2020 & 2033
- Table 28: Global Pressure Labels Market Revenue Million Forecast, by End-User Industry 2020 & 2033
- Table 29: Global Pressure Labels Market Revenue Million Forecast, by Country 2020 & 2033
Frequently Asked Questions
1. What is the projected Compound Annual Growth Rate (CAGR) of the Pressure Labels Market?
The projected CAGR is approximately > 4.19%.
2. Which companies are prominent players in the Pressure Labels Market?
Key companies in the market include Fort Dearborn Company, Skanem AS*List Not Exhaustive, Constantia Flexibles Group GmbH, Herma GmbH, Coveris, Westrock Company, Inland Printing Co Ltd, UPM Raflatac Inc, Taylor Corporation, Huhtamaki Group, CCL Industries Inc, Avery Dennison Corp, Fuji Seal International Inc, Taghleef Industries Inc (Al Ghurair Group), Multicolor Corporation, Folienprint RAKO GmbH.
3. What are the main segments of the Pressure Labels Market?
The market segments include Print Process, End-User Industry .
4. Can you provide details about the market size?
The market size is estimated to be USD 22.60 Million as of 2022.
5. What are some drivers contributing to market growth?
Evolution of Digital Print Technology.
6. What are the notable trends driving market growth?
Beverage End-User Segment is Expected to Drive Growth of Pressure Labels.
7. Are there any restraints impacting market growth?
Lack of Products with Ability to Withstand Harsh Climatic Conditions.
8. Can you provide examples of recent developments in the market?
December 2023 - Sentinel Capital Partners, a private equity firm that invests in midmarket companies, announced the recapitalization of Online Labels Group (OLG), one of the leading providers of pressure-sensitive labels, shrink sleeves, and flexible packaging solutions.
9. What pricing options are available for accessing the report?
Pricing options include single-user, multi-user, and enterprise licenses priced at USD 4750, USD 5250, and USD 8750 respectively.
10. Is the market size provided in terms of value or volume?
The market size is provided in terms of value, measured in Million.
11. Are there any specific market keywords associated with the report?
Yes, the market keyword associated with the report is "Pressure Labels Market," which aids in identifying and referencing the specific market segment covered.
12. How do I determine which pricing option suits my needs best?
The pricing options vary based on user requirements and access needs. Individual users may opt for single-user licenses, while businesses requiring broader access may choose multi-user or enterprise licenses for cost-effective access to the report.
13. Are there any additional resources or data provided in the Pressure Labels Market report?
While the report offers comprehensive insights, it's advisable to review the specific contents or supplementary materials provided to ascertain if additional resources or data are available.
14. How can I stay updated on further developments or reports in the Pressure Labels Market?
To stay informed about further developments, trends, and reports in the Pressure Labels Market, consider subscribing to industry newsletters, following relevant companies and organizations, or regularly checking reputable industry news sources and publications.
Methodology
Step 1 - Identification of Relevant Samples Size from Population Database


Step 2 - Approaches for Defining Global Market Size (Value, Volume* & Price*)

Note*: In applicable scenarios
Step 3 - Data Sources
Primary Research
- Web Analytics
- Survey Reports
- Research Institute
- Latest Research Reports
- Opinion Leaders
Secondary Research
- Annual Reports
- White Paper
- Latest Press Release
- Industry Association
- Paid Database
- Investor Presentations

Step 4 - Data Triangulation
Involves using different sources of information in order to increase the validity of a study
These sources are likely to be stakeholders in a program - participants, other researchers, program staff, other community members, and so on.
Then we put all data in single framework & apply various statistical tools to find out the dynamic on the market.
During the analysis stage, feedback from the stakeholder groups would be compared to determine areas of agreement as well as areas of divergence