

Key Insights
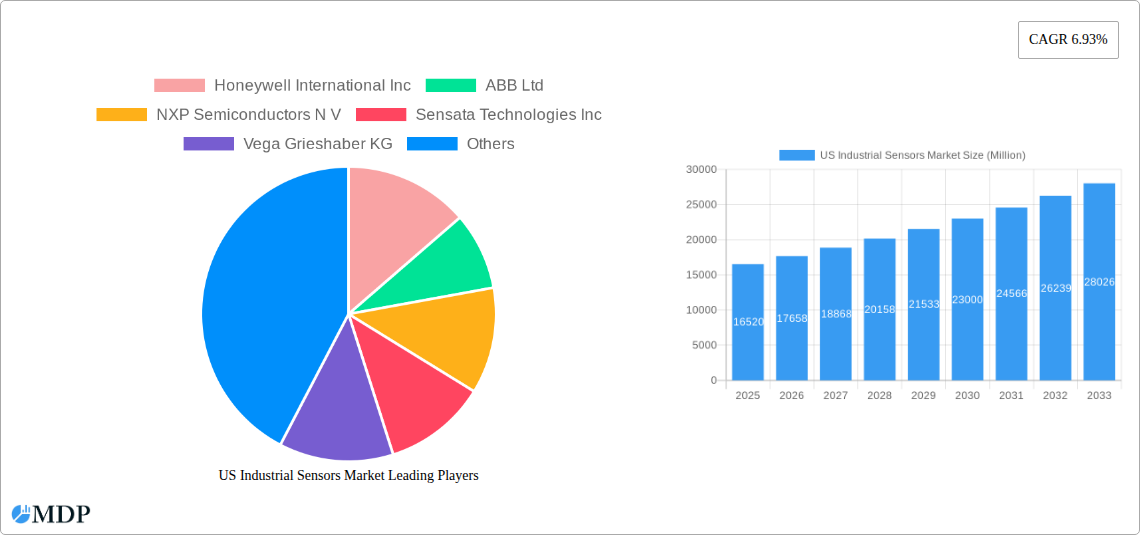
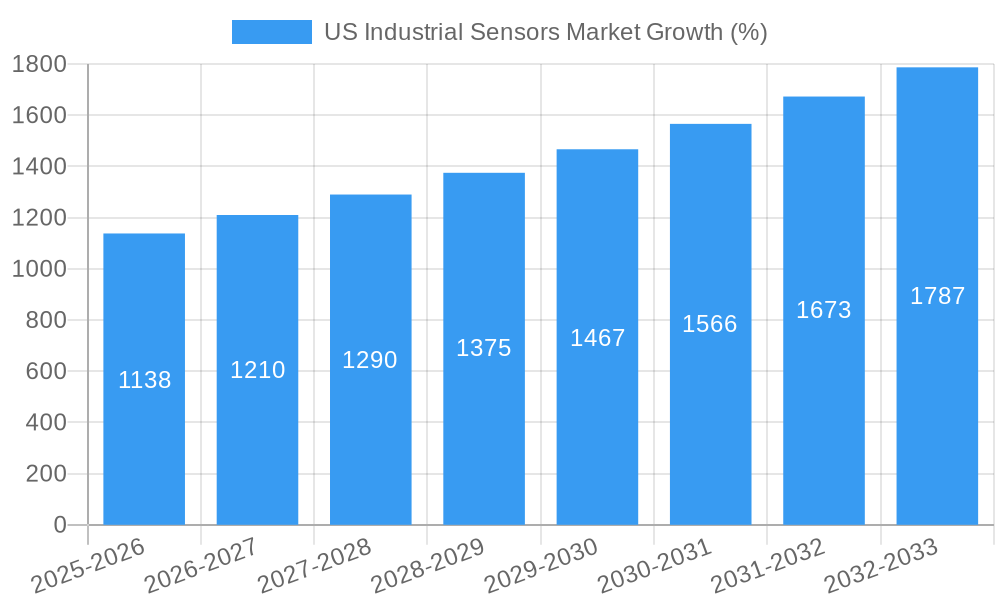
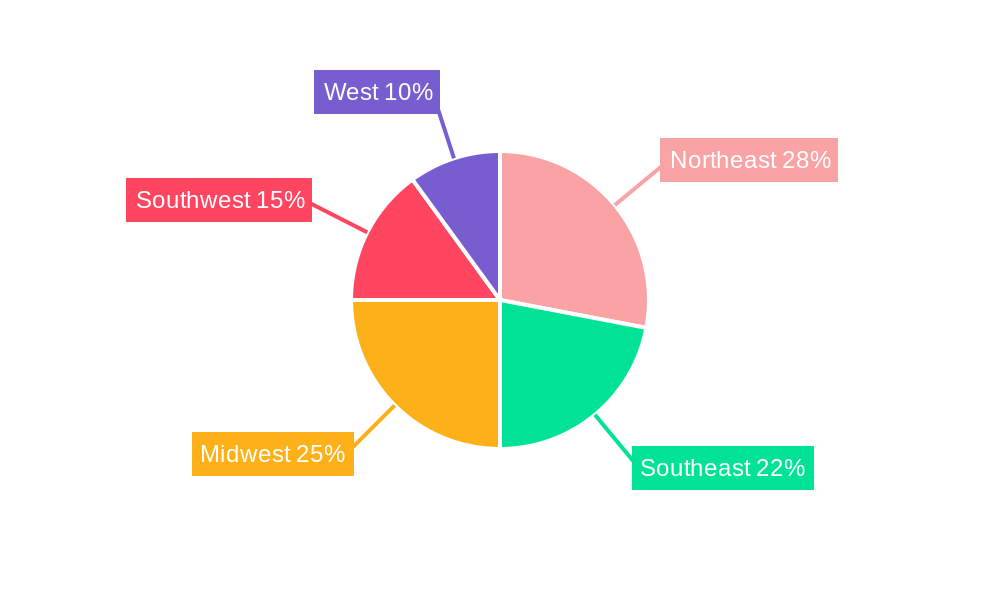
The US industrial sensors market, valued at $16.52 billion in 2025, is projected to experience robust growth, driven by the increasing automation across various manufacturing sectors and the burgeoning adoption of Industry 4.0 technologies. This expansion is fueled by the rising demand for enhanced process optimization, predictive maintenance, and improved operational efficiency. Key growth drivers include the proliferation of smart factories, the increasing need for real-time data analytics, and stringent government regulations promoting industrial safety and environmental monitoring. The market is segmented by connectivity (wired and wireless), sensor type (flow, temperature, level, pressure, gas, and others), and end-user industries (e.g., automotive, oil & gas, food & beverage). Wireless solutions are gaining traction due to their flexibility and ease of installation, while the demand for sophisticated sensors like those used in advanced process control applications is driving premium segment growth. Challenges, such as high initial investment costs associated with sensor integration and the need for skilled labor for installation and maintenance, could potentially impede market growth to some degree. However, the long-term benefits in terms of cost savings and improved productivity are expected to outweigh these challenges. The regional distribution within the US market sees significant concentration in industrial hubs across the Northeast, Midwest, and West, reflecting established manufacturing bases and ongoing investments in modernization.
The competitive landscape is characterized by a mix of established global players and specialized sensor manufacturers. Companies like Honeywell, ABB, and Siemens are major contenders, leveraging their extensive product portfolios and established distribution networks. However, smaller, specialized firms are also gaining market share by focusing on niche applications and providing innovative sensor technologies. The forecast period (2025-2033) anticipates sustained growth driven by continuous technological advancements, the expanding adoption of advanced automation across diverse industries, and the increasing focus on data-driven decision-making within industrial operations. This will lead to continued investment in sensor technology, further propelling market expansion throughout the forecast period. The market is expected to maintain a healthy CAGR, reflecting the sustained demand for industrial sensors across the US.
US Industrial Sensors Market: A Comprehensive Report (2019-2033)
This in-depth report provides a comprehensive analysis of the US Industrial Sensors Market, covering market dynamics, industry trends, leading segments, key players, and future growth opportunities. With a study period spanning 2019-2033, a base year of 2025, and a forecast period of 2025-2033, this report is an essential resource for industry stakeholders, investors, and strategic decision-makers. The market is valued at xx Million in 2025 and is projected to reach xx Million by 2033, exhibiting a CAGR of xx% during the forecast period.
US Industrial Sensors Market Market Dynamics & Concentration
The US industrial sensors market is characterized by moderate concentration, with several major players holding significant market share. Honeywell International Inc, ABB Ltd, and Emerson Electric Co are among the leading companies, collectively accounting for approximately xx% of the market in 2025. However, the market also features a number of smaller, specialized players contributing to a dynamic competitive landscape. Innovation is a key driver, with continuous advancements in sensor technology, including AI-enabled sensors and improved miniaturization, leading to enhanced performance, accuracy, and reduced costs. Stringent regulatory frameworks, particularly concerning safety and environmental compliance, influence market dynamics. Furthermore, the increasing adoption of smart manufacturing and Industry 4.0 initiatives fuels the demand for advanced sensors. Product substitution is limited, as different sensor types cater to specific applications. However, technological advancements constantly push the boundaries of what's possible, introducing new functionalities and capabilities. End-user trends lean towards increasing automation, data-driven decision-making, and remote monitoring applications. M&A activity in the sector is relatively frequent, with an estimated xx M&A deals taking place in the last five years, indicating a high level of consolidation and investment.
US Industrial Sensors Market Industry Trends & Analysis
The US industrial sensors market is experiencing robust growth driven by several key factors. The increasing adoption of automation and Industry 4.0 technologies in various industrial sectors is a major catalyst. The demand for improved efficiency, predictive maintenance, and real-time process monitoring significantly contributes to this growth. Technological advancements, particularly in areas like IoT (Internet of Things) and AI, are revolutionizing sensor design and functionality. The development of more accurate, reliable, and energy-efficient sensors is driving market penetration across different applications. Consumer preferences are shifting towards sensors with enhanced data analytics capabilities and seamless integration with existing systems. The competitive dynamics are marked by ongoing innovation, strategic partnerships, and M&A activities. The market exhibits strong growth across various segments, with the wired solutions segment currently holding a significant market share but wireless solutions experiencing rapid growth due to enhanced connectivity and flexibility. The CAGR for the entire market is projected to be xx%, indicating substantial growth potential in the coming years.
Leading Markets & Segments in US Industrial Sensors Market
Dominant Region/Segment: The manufacturing sector dominates the end-user segment, followed by the oil and gas industry and automotive industry. Within sensor types, pressure sensors and temperature sensors command the largest market share due to their extensive use in diverse applications. The wired solutions segment currently holds the largest market share in terms of connectivity, driven by reliability and stability. However, wireless solutions are experiencing the fastest growth rate.
Key Drivers:
- Economic Policies: Government incentives and investments in advanced manufacturing contribute to market growth.
- Infrastructure Development: Investments in infrastructure projects drive demand for sensors in various applications.
- Technological Advancements: Continuous innovation in sensor technology enhances performance, accuracy and functionality, expanding market opportunities.
The Midwest region of the US represents a key market for industrial sensors due to its strong manufacturing base and substantial presence of various industrial sectors. This region benefits from established infrastructure and a skilled workforce, creating a favorable environment for industrial sensor adoption. The South has also experienced significant growth, largely due to its booming manufacturing and logistics sectors.
US Industrial Sensors Market Product Developments
Recent product innovations focus on miniaturization, improved accuracy, enhanced connectivity, and increased integration with data analytics platforms. New sensors are emerging with capabilities like AI-powered anomaly detection and predictive maintenance features. The market is witnessing increased integration with cloud platforms and improved data security protocols. These developments enhance the overall value proposition of industrial sensors, enabling businesses to gain valuable insights from operational data. Competitively, manufacturers are focusing on developing products with superior performance, enhanced reliability, longer lifespans, and cost-effectiveness.
Key Drivers of US Industrial Sensors Market Growth
Technological advancements such as the development of AI-enabled sensors, IoT integration, and miniaturization drive market growth. Economic factors, like increasing automation investments and government incentives for smart manufacturing, are significant contributors. Regulatory frameworks promoting safety and environmental compliance further stimulate demand for advanced sensor technologies in various industrial sectors. For example, stricter emission regulations in the automotive industry are driving demand for advanced gas sensors.
Challenges in the US Industrial Sensors Market Market
Supply chain disruptions can cause delays and increase costs, impacting market growth. Competitive pressures from international manufacturers and the need for continuous innovation pose significant challenges. Regulatory compliance requirements and cybersecurity concerns impose additional burdens on manufacturers. These factors can collectively limit the market's overall expansion rate, especially in specific segments.
Emerging Opportunities in US Industrial Sensors Market
The integration of 5G technology and advancements in AI and machine learning offer significant opportunities for innovation and expansion. Strategic partnerships between sensor manufacturers and data analytics companies enable the development of powerful solutions. Expansion into new and emerging markets, including renewable energy and smart cities, presents further growth avenues. These trends are expected to drive long-term growth and market expansion.
Leading Players in the US Industrial Sensors Market Sector
- Honeywell International Inc
- ABB Ltd
- NXP Semiconductors N V
- Sensata Technologies Inc
- Vega Grieshaber KG
- Emerson Electric Co
- Siemens AG
- Meggitt Sensing Systems
- Omron Corporation
- Omega Engineering Inc
- Sick AG
- TE Connectivity Ltd
- Infineon Technologies A
- Ams-osram AG
- Texas Instruments Incorporated
- Rockwell Automation Inc
- Yokogawa Electric Corporation
- The Krohne Group
- Analog Devices Inc
- Endress + Hauser AG
- Bosch Sensortec GMBH (Bosch Internationals)
- Stmicroelectronics Inc
Key Milestones in US Industrial Sensors Market Industry
September 2023: KROHNE, Inc. showcased its water and wastewater products, including the OPTISONIC 6300 clamp-on ultrasonic flowmeter, at WEFTEC 2023. This highlights the continued importance of advanced flow measurement solutions in the water management sector.
January 2023: KROHNE, Inc. exhibited products for food and beverage production at the Food Processing Expo 2023, showcasing the OPTISONIC 6300P, WATERFLUX 3070, and OPTIFLUX 2000. This demonstrates the growing demand for hygienic and precise flow measurement in the food and beverage industry.
January 2023: Bosch Sensortec introduced new sensors at CES 2023, including an AI-enabled sensor and a next-generation magnetometer, along with the BMP585 barometric pressure sensor. These advancements in sensor technology signify progress towards more sophisticated and energy-efficient solutions for wearables and other applications.
Strategic Outlook for US Industrial Sensors Market Market
The US industrial sensors market is poised for continued growth, driven by the ongoing adoption of smart manufacturing, the expansion of IoT applications, and the increasing demand for data-driven decision-making across various industrial sectors. Strategic partnerships, technological innovations, and expansion into emerging applications will further accelerate market expansion. The focus on developing energy-efficient, highly accurate and reliable sensors presents significant opportunities for market players.
US Industrial Sensors Market Segmentation
-
1. Connectivity
- 1.1. Wired Solutions
- 1.2. Wireless Solutions
-
2. Type
-
2.1. Flow Sensors
- 2.1.1. Market Overview
- 2.1.2. End-user Industry
- 2.2. Temperature Sensors
- 2.3. Level Sensors
- 2.4. Pressure Sensors
- 2.5. Gas Sensors
- 2.6. Other Sensors
-
2.1. Flow Sensors
US Industrial Sensors Market Segmentation By Geography
-
1. North America
- 1.1. United States
- 1.2. Canada
- 1.3. Mexico
-
2. South America
- 2.1. Brazil
- 2.2. Argentina
- 2.3. Rest of South America
-
3. Europe
- 3.1. United Kingdom
- 3.2. Germany
- 3.3. France
- 3.4. Italy
- 3.5. Spain
- 3.6. Russia
- 3.7. Benelux
- 3.8. Nordics
- 3.9. Rest of Europe
-
4. Middle East & Africa
- 4.1. Turkey
- 4.2. Israel
- 4.3. GCC
- 4.4. North Africa
- 4.5. South Africa
- 4.6. Rest of Middle East & Africa
-
5. Asia Pacific
- 5.1. China
- 5.2. India
- 5.3. Japan
- 5.4. South Korea
- 5.5. ASEAN
- 5.6. Oceania
- 5.7. Rest of Asia Pacific
US Industrial Sensors Market REPORT HIGHLIGHTS
| Aspects | Details |
|---|---|
| Study Period | 2019-2033 |
| Base Year | 2024 |
| Estimated Year | 2025 |
| Forecast Period | 2025-2033 |
| Historical Period | 2019-2024 |
| Growth Rate | CAGR of 6.93% from 2019-2033 |
| Segmentation |
|
Table of Contents
- 1. Introduction
- 1.1. Research Scope
- 1.2. Market Segmentation
- 1.3. Research Methodology
- 1.4. Definitions and Assumptions
- 2. Executive Summary
- 2.1. Introduction
- 3. Market Dynamics
- 3.1. Introduction
- 3.2. Market Drivers
- 3.2.1. Growing Adoption of IoT Leading to Demand for Sensing Components; Growing Emphasis on the Use of Predictive Maintenance and Remote Monitoring
- 3.3. Market Restrains
- 3.3.1. High Cost and Operational Concern
- 3.4. Market Trends
- 3.4.1. Growing Adoption of IoT Leading to Demand for Sensing Components Drives the Market
- 4. Market Factor Analysis
- 4.1. Porters Five Forces
- 4.2. Supply/Value Chain
- 4.3. PESTEL analysis
- 4.4. Market Entropy
- 4.5. Patent/Trademark Analysis
- 5. Global US Industrial Sensors Market Analysis, Insights and Forecast, 2019-2031
- 5.1. Market Analysis, Insights and Forecast - by Connectivity
- 5.1.1. Wired Solutions
- 5.1.2. Wireless Solutions
- 5.2. Market Analysis, Insights and Forecast - by Type
- 5.2.1. Flow Sensors
- 5.2.1.1. Market Overview
- 5.2.1.2. End-user Industry
- 5.2.2. Temperature Sensors
- 5.2.3. Level Sensors
- 5.2.4. Pressure Sensors
- 5.2.5. Gas Sensors
- 5.2.6. Other Sensors
- 5.2.1. Flow Sensors
- 5.3. Market Analysis, Insights and Forecast - by Region
- 5.3.1. North America
- 5.3.2. South America
- 5.3.3. Europe
- 5.3.4. Middle East & Africa
- 5.3.5. Asia Pacific
- 5.1. Market Analysis, Insights and Forecast - by Connectivity
- 6. North America US Industrial Sensors Market Analysis, Insights and Forecast, 2019-2031
- 6.1. Market Analysis, Insights and Forecast - by Connectivity
- 6.1.1. Wired Solutions
- 6.1.2. Wireless Solutions
- 6.2. Market Analysis, Insights and Forecast - by Type
- 6.2.1. Flow Sensors
- 6.2.1.1. Market Overview
- 6.2.1.2. End-user Industry
- 6.2.2. Temperature Sensors
- 6.2.3. Level Sensors
- 6.2.4. Pressure Sensors
- 6.2.5. Gas Sensors
- 6.2.6. Other Sensors
- 6.2.1. Flow Sensors
- 6.1. Market Analysis, Insights and Forecast - by Connectivity
- 7. South America US Industrial Sensors Market Analysis, Insights and Forecast, 2019-2031
- 7.1. Market Analysis, Insights and Forecast - by Connectivity
- 7.1.1. Wired Solutions
- 7.1.2. Wireless Solutions
- 7.2. Market Analysis, Insights and Forecast - by Type
- 7.2.1. Flow Sensors
- 7.2.1.1. Market Overview
- 7.2.1.2. End-user Industry
- 7.2.2. Temperature Sensors
- 7.2.3. Level Sensors
- 7.2.4. Pressure Sensors
- 7.2.5. Gas Sensors
- 7.2.6. Other Sensors
- 7.2.1. Flow Sensors
- 7.1. Market Analysis, Insights and Forecast - by Connectivity
- 8. Europe US Industrial Sensors Market Analysis, Insights and Forecast, 2019-2031
- 8.1. Market Analysis, Insights and Forecast - by Connectivity
- 8.1.1. Wired Solutions
- 8.1.2. Wireless Solutions
- 8.2. Market Analysis, Insights and Forecast - by Type
- 8.2.1. Flow Sensors
- 8.2.1.1. Market Overview
- 8.2.1.2. End-user Industry
- 8.2.2. Temperature Sensors
- 8.2.3. Level Sensors
- 8.2.4. Pressure Sensors
- 8.2.5. Gas Sensors
- 8.2.6. Other Sensors
- 8.2.1. Flow Sensors
- 8.1. Market Analysis, Insights and Forecast - by Connectivity
- 9. Middle East & Africa US Industrial Sensors Market Analysis, Insights and Forecast, 2019-2031
- 9.1. Market Analysis, Insights and Forecast - by Connectivity
- 9.1.1. Wired Solutions
- 9.1.2. Wireless Solutions
- 9.2. Market Analysis, Insights and Forecast - by Type
- 9.2.1. Flow Sensors
- 9.2.1.1. Market Overview
- 9.2.1.2. End-user Industry
- 9.2.2. Temperature Sensors
- 9.2.3. Level Sensors
- 9.2.4. Pressure Sensors
- 9.2.5. Gas Sensors
- 9.2.6. Other Sensors
- 9.2.1. Flow Sensors
- 9.1. Market Analysis, Insights and Forecast - by Connectivity
- 10. Asia Pacific US Industrial Sensors Market Analysis, Insights and Forecast, 2019-2031
- 10.1. Market Analysis, Insights and Forecast - by Connectivity
- 10.1.1. Wired Solutions
- 10.1.2. Wireless Solutions
- 10.2. Market Analysis, Insights and Forecast - by Type
- 10.2.1. Flow Sensors
- 10.2.1.1. Market Overview
- 10.2.1.2. End-user Industry
- 10.2.2. Temperature Sensors
- 10.2.3. Level Sensors
- 10.2.4. Pressure Sensors
- 10.2.5. Gas Sensors
- 10.2.6. Other Sensors
- 10.2.1. Flow Sensors
- 10.1. Market Analysis, Insights and Forecast - by Connectivity
- 11. Northeast US Industrial Sensors Market Analysis, Insights and Forecast, 2019-2031
- 12. Southeast US Industrial Sensors Market Analysis, Insights and Forecast, 2019-2031
- 13. Midwest US Industrial Sensors Market Analysis, Insights and Forecast, 2019-2031
- 14. Southwest US Industrial Sensors Market Analysis, Insights and Forecast, 2019-2031
- 15. West US Industrial Sensors Market Analysis, Insights and Forecast, 2019-2031
- 16. Competitive Analysis
- 16.1. Global Market Share Analysis 2024
- 16.2. Company Profiles
- 16.2.1 Honeywell International Inc
- 16.2.1.1. Overview
- 16.2.1.2. Products
- 16.2.1.3. SWOT Analysis
- 16.2.1.4. Recent Developments
- 16.2.1.5. Financials (Based on Availability)
- 16.2.2 ABB Ltd
- 16.2.2.1. Overview
- 16.2.2.2. Products
- 16.2.2.3. SWOT Analysis
- 16.2.2.4. Recent Developments
- 16.2.2.5. Financials (Based on Availability)
- 16.2.3 NXP Semiconductors N V
- 16.2.3.1. Overview
- 16.2.3.2. Products
- 16.2.3.3. SWOT Analysis
- 16.2.3.4. Recent Developments
- 16.2.3.5. Financials (Based on Availability)
- 16.2.4 Sensata Technologies Inc
- 16.2.4.1. Overview
- 16.2.4.2. Products
- 16.2.4.3. SWOT Analysis
- 16.2.4.4. Recent Developments
- 16.2.4.5. Financials (Based on Availability)
- 16.2.5 Vega Grieshaber KG
- 16.2.5.1. Overview
- 16.2.5.2. Products
- 16.2.5.3. SWOT Analysis
- 16.2.5.4. Recent Developments
- 16.2.5.5. Financials (Based on Availability)
- 16.2.6 Emerson Electric Co
- 16.2.6.1. Overview
- 16.2.6.2. Products
- 16.2.6.3. SWOT Analysis
- 16.2.6.4. Recent Developments
- 16.2.6.5. Financials (Based on Availability)
- 16.2.7 Siemens AG
- 16.2.7.1. Overview
- 16.2.7.2. Products
- 16.2.7.3. SWOT Analysis
- 16.2.7.4. Recent Developments
- 16.2.7.5. Financials (Based on Availability)
- 16.2.8 Meggitt Sensing Systems
- 16.2.8.1. Overview
- 16.2.8.2. Products
- 16.2.8.3. SWOT Analysis
- 16.2.8.4. Recent Developments
- 16.2.8.5. Financials (Based on Availability)
- 16.2.9 Omron Corporation
- 16.2.9.1. Overview
- 16.2.9.2. Products
- 16.2.9.3. SWOT Analysis
- 16.2.9.4. Recent Developments
- 16.2.9.5. Financials (Based on Availability)
- 16.2.10 Omega Engineering Inc
- 16.2.10.1. Overview
- 16.2.10.2. Products
- 16.2.10.3. SWOT Analysis
- 16.2.10.4. Recent Developments
- 16.2.10.5. Financials (Based on Availability)
- 16.2.11 Sick AG
- 16.2.11.1. Overview
- 16.2.11.2. Products
- 16.2.11.3. SWOT Analysis
- 16.2.11.4. Recent Developments
- 16.2.11.5. Financials (Based on Availability)
- 16.2.12 TE Connectivity Ltd
- 16.2.12.1. Overview
- 16.2.12.2. Products
- 16.2.12.3. SWOT Analysis
- 16.2.12.4. Recent Developments
- 16.2.12.5. Financials (Based on Availability)
- 16.2.13 Infineon Technologies A
- 16.2.13.1. Overview
- 16.2.13.2. Products
- 16.2.13.3. SWOT Analysis
- 16.2.13.4. Recent Developments
- 16.2.13.5. Financials (Based on Availability)
- 16.2.14 Ams-osram AG
- 16.2.14.1. Overview
- 16.2.14.2. Products
- 16.2.14.3. SWOT Analysis
- 16.2.14.4. Recent Developments
- 16.2.14.5. Financials (Based on Availability)
- 16.2.15 Texas Instruments Incorporated
- 16.2.15.1. Overview
- 16.2.15.2. Products
- 16.2.15.3. SWOT Analysis
- 16.2.15.4. Recent Developments
- 16.2.15.5. Financials (Based on Availability)
- 16.2.16 Rockwell Automation Inc
- 16.2.16.1. Overview
- 16.2.16.2. Products
- 16.2.16.3. SWOT Analysis
- 16.2.16.4. Recent Developments
- 16.2.16.5. Financials (Based on Availability)
- 16.2.17 Yokogawa Electric Corporation
- 16.2.17.1. Overview
- 16.2.17.2. Products
- 16.2.17.3. SWOT Analysis
- 16.2.17.4. Recent Developments
- 16.2.17.5. Financials (Based on Availability)
- 16.2.18 The Krohne Group
- 16.2.18.1. Overview
- 16.2.18.2. Products
- 16.2.18.3. SWOT Analysis
- 16.2.18.4. Recent Developments
- 16.2.18.5. Financials (Based on Availability)
- 16.2.19 Analog Devices Inc
- 16.2.19.1. Overview
- 16.2.19.2. Products
- 16.2.19.3. SWOT Analysis
- 16.2.19.4. Recent Developments
- 16.2.19.5. Financials (Based on Availability)
- 16.2.20 Endress + Hauser AG
- 16.2.20.1. Overview
- 16.2.20.2. Products
- 16.2.20.3. SWOT Analysis
- 16.2.20.4. Recent Developments
- 16.2.20.5. Financials (Based on Availability)
- 16.2.21 Bosch Sensortec GMBH (Bosch Internationals)
- 16.2.21.1. Overview
- 16.2.21.2. Products
- 16.2.21.3. SWOT Analysis
- 16.2.21.4. Recent Developments
- 16.2.21.5. Financials (Based on Availability)
- 16.2.22 Stmicroelectronics Inc
- 16.2.22.1. Overview
- 16.2.22.2. Products
- 16.2.22.3. SWOT Analysis
- 16.2.22.4. Recent Developments
- 16.2.22.5. Financials (Based on Availability)
- 16.2.1 Honeywell International Inc
List of Figures
- Figure 1: Global US Industrial Sensors Market Revenue Breakdown (Million, %) by Region 2024 & 2032
- Figure 2: United states US Industrial Sensors Market Revenue (Million), by Country 2024 & 2032
- Figure 3: United states US Industrial Sensors Market Revenue Share (%), by Country 2024 & 2032
- Figure 4: North America US Industrial Sensors Market Revenue (Million), by Connectivity 2024 & 2032
- Figure 5: North America US Industrial Sensors Market Revenue Share (%), by Connectivity 2024 & 2032
- Figure 6: North America US Industrial Sensors Market Revenue (Million), by Type 2024 & 2032
- Figure 7: North America US Industrial Sensors Market Revenue Share (%), by Type 2024 & 2032
- Figure 8: North America US Industrial Sensors Market Revenue (Million), by Country 2024 & 2032
- Figure 9: North America US Industrial Sensors Market Revenue Share (%), by Country 2024 & 2032
- Figure 10: South America US Industrial Sensors Market Revenue (Million), by Connectivity 2024 & 2032
- Figure 11: South America US Industrial Sensors Market Revenue Share (%), by Connectivity 2024 & 2032
- Figure 12: South America US Industrial Sensors Market Revenue (Million), by Type 2024 & 2032
- Figure 13: South America US Industrial Sensors Market Revenue Share (%), by Type 2024 & 2032
- Figure 14: South America US Industrial Sensors Market Revenue (Million), by Country 2024 & 2032
- Figure 15: South America US Industrial Sensors Market Revenue Share (%), by Country 2024 & 2032
- Figure 16: Europe US Industrial Sensors Market Revenue (Million), by Connectivity 2024 & 2032
- Figure 17: Europe US Industrial Sensors Market Revenue Share (%), by Connectivity 2024 & 2032
- Figure 18: Europe US Industrial Sensors Market Revenue (Million), by Type 2024 & 2032
- Figure 19: Europe US Industrial Sensors Market Revenue Share (%), by Type 2024 & 2032
- Figure 20: Europe US Industrial Sensors Market Revenue (Million), by Country 2024 & 2032
- Figure 21: Europe US Industrial Sensors Market Revenue Share (%), by Country 2024 & 2032
- Figure 22: Middle East & Africa US Industrial Sensors Market Revenue (Million), by Connectivity 2024 & 2032
- Figure 23: Middle East & Africa US Industrial Sensors Market Revenue Share (%), by Connectivity 2024 & 2032
- Figure 24: Middle East & Africa US Industrial Sensors Market Revenue (Million), by Type 2024 & 2032
- Figure 25: Middle East & Africa US Industrial Sensors Market Revenue Share (%), by Type 2024 & 2032
- Figure 26: Middle East & Africa US Industrial Sensors Market Revenue (Million), by Country 2024 & 2032
- Figure 27: Middle East & Africa US Industrial Sensors Market Revenue Share (%), by Country 2024 & 2032
- Figure 28: Asia Pacific US Industrial Sensors Market Revenue (Million), by Connectivity 2024 & 2032
- Figure 29: Asia Pacific US Industrial Sensors Market Revenue Share (%), by Connectivity 2024 & 2032
- Figure 30: Asia Pacific US Industrial Sensors Market Revenue (Million), by Type 2024 & 2032
- Figure 31: Asia Pacific US Industrial Sensors Market Revenue Share (%), by Type 2024 & 2032
- Figure 32: Asia Pacific US Industrial Sensors Market Revenue (Million), by Country 2024 & 2032
- Figure 33: Asia Pacific US Industrial Sensors Market Revenue Share (%), by Country 2024 & 2032
List of Tables
- Table 1: Global US Industrial Sensors Market Revenue Million Forecast, by Region 2019 & 2032
- Table 2: Global US Industrial Sensors Market Revenue Million Forecast, by Connectivity 2019 & 2032
- Table 3: Global US Industrial Sensors Market Revenue Million Forecast, by Type 2019 & 2032
- Table 4: Global US Industrial Sensors Market Revenue Million Forecast, by Region 2019 & 2032
- Table 5: Global US Industrial Sensors Market Revenue Million Forecast, by Country 2019 & 2032
- Table 6: Northeast US Industrial Sensors Market Revenue (Million) Forecast, by Application 2019 & 2032
- Table 7: Southeast US Industrial Sensors Market Revenue (Million) Forecast, by Application 2019 & 2032
- Table 8: Midwest US Industrial Sensors Market Revenue (Million) Forecast, by Application 2019 & 2032
- Table 9: Southwest US Industrial Sensors Market Revenue (Million) Forecast, by Application 2019 & 2032
- Table 10: West US Industrial Sensors Market Revenue (Million) Forecast, by Application 2019 & 2032
- Table 11: Global US Industrial Sensors Market Revenue Million Forecast, by Connectivity 2019 & 2032
- Table 12: Global US Industrial Sensors Market Revenue Million Forecast, by Type 2019 & 2032
- Table 13: Global US Industrial Sensors Market Revenue Million Forecast, by Country 2019 & 2032
- Table 14: United States US Industrial Sensors Market Revenue (Million) Forecast, by Application 2019 & 2032
- Table 15: Canada US Industrial Sensors Market Revenue (Million) Forecast, by Application 2019 & 2032
- Table 16: Mexico US Industrial Sensors Market Revenue (Million) Forecast, by Application 2019 & 2032
- Table 17: Global US Industrial Sensors Market Revenue Million Forecast, by Connectivity 2019 & 2032
- Table 18: Global US Industrial Sensors Market Revenue Million Forecast, by Type 2019 & 2032
- Table 19: Global US Industrial Sensors Market Revenue Million Forecast, by Country 2019 & 2032
- Table 20: Brazil US Industrial Sensors Market Revenue (Million) Forecast, by Application 2019 & 2032
- Table 21: Argentina US Industrial Sensors Market Revenue (Million) Forecast, by Application 2019 & 2032
- Table 22: Rest of South America US Industrial Sensors Market Revenue (Million) Forecast, by Application 2019 & 2032
- Table 23: Global US Industrial Sensors Market Revenue Million Forecast, by Connectivity 2019 & 2032
- Table 24: Global US Industrial Sensors Market Revenue Million Forecast, by Type 2019 & 2032
- Table 25: Global US Industrial Sensors Market Revenue Million Forecast, by Country 2019 & 2032
- Table 26: United Kingdom US Industrial Sensors Market Revenue (Million) Forecast, by Application 2019 & 2032
- Table 27: Germany US Industrial Sensors Market Revenue (Million) Forecast, by Application 2019 & 2032
- Table 28: France US Industrial Sensors Market Revenue (Million) Forecast, by Application 2019 & 2032
- Table 29: Italy US Industrial Sensors Market Revenue (Million) Forecast, by Application 2019 & 2032
- Table 30: Spain US Industrial Sensors Market Revenue (Million) Forecast, by Application 2019 & 2032
- Table 31: Russia US Industrial Sensors Market Revenue (Million) Forecast, by Application 2019 & 2032
- Table 32: Benelux US Industrial Sensors Market Revenue (Million) Forecast, by Application 2019 & 2032
- Table 33: Nordics US Industrial Sensors Market Revenue (Million) Forecast, by Application 2019 & 2032
- Table 34: Rest of Europe US Industrial Sensors Market Revenue (Million) Forecast, by Application 2019 & 2032
- Table 35: Global US Industrial Sensors Market Revenue Million Forecast, by Connectivity 2019 & 2032
- Table 36: Global US Industrial Sensors Market Revenue Million Forecast, by Type 2019 & 2032
- Table 37: Global US Industrial Sensors Market Revenue Million Forecast, by Country 2019 & 2032
- Table 38: Turkey US Industrial Sensors Market Revenue (Million) Forecast, by Application 2019 & 2032
- Table 39: Israel US Industrial Sensors Market Revenue (Million) Forecast, by Application 2019 & 2032
- Table 40: GCC US Industrial Sensors Market Revenue (Million) Forecast, by Application 2019 & 2032
- Table 41: North Africa US Industrial Sensors Market Revenue (Million) Forecast, by Application 2019 & 2032
- Table 42: South Africa US Industrial Sensors Market Revenue (Million) Forecast, by Application 2019 & 2032
- Table 43: Rest of Middle East & Africa US Industrial Sensors Market Revenue (Million) Forecast, by Application 2019 & 2032
- Table 44: Global US Industrial Sensors Market Revenue Million Forecast, by Connectivity 2019 & 2032
- Table 45: Global US Industrial Sensors Market Revenue Million Forecast, by Type 2019 & 2032
- Table 46: Global US Industrial Sensors Market Revenue Million Forecast, by Country 2019 & 2032
- Table 47: China US Industrial Sensors Market Revenue (Million) Forecast, by Application 2019 & 2032
- Table 48: India US Industrial Sensors Market Revenue (Million) Forecast, by Application 2019 & 2032
- Table 49: Japan US Industrial Sensors Market Revenue (Million) Forecast, by Application 2019 & 2032
- Table 50: South Korea US Industrial Sensors Market Revenue (Million) Forecast, by Application 2019 & 2032
- Table 51: ASEAN US Industrial Sensors Market Revenue (Million) Forecast, by Application 2019 & 2032
- Table 52: Oceania US Industrial Sensors Market Revenue (Million) Forecast, by Application 2019 & 2032
- Table 53: Rest of Asia Pacific US Industrial Sensors Market Revenue (Million) Forecast, by Application 2019 & 2032
Frequently Asked Questions
1. What is the projected Compound Annual Growth Rate (CAGR) of the US Industrial Sensors Market?
The projected CAGR is approximately 6.93%.
2. Which companies are prominent players in the US Industrial Sensors Market?
Key companies in the market include Honeywell International Inc, ABB Ltd, NXP Semiconductors N V, Sensata Technologies Inc, Vega Grieshaber KG, Emerson Electric Co, Siemens AG, Meggitt Sensing Systems, Omron Corporation, Omega Engineering Inc, Sick AG, TE Connectivity Ltd, Infineon Technologies A, Ams-osram AG, Texas Instruments Incorporated, Rockwell Automation Inc, Yokogawa Electric Corporation, The Krohne Group, Analog Devices Inc, Endress + Hauser AG, Bosch Sensortec GMBH (Bosch Internationals), Stmicroelectronics Inc.
3. What are the main segments of the US Industrial Sensors Market?
The market segments include Connectivity , Type .
4. Can you provide details about the market size?
The market size is estimated to be USD 16.52 Million as of 2022.
5. What are some drivers contributing to market growth?
Growing Adoption of IoT Leading to Demand for Sensing Components; Growing Emphasis on the Use of Predictive Maintenance and Remote Monitoring.
6. What are the notable trends driving market growth?
Growing Adoption of IoT Leading to Demand for Sensing Components Drives the Market.
7. Are there any restraints impacting market growth?
High Cost and Operational Concern.
8. Can you provide examples of recent developments in the market?
September 2023 - KROHNE, Inc. announced to showcase a wide range of its industry-leading water and wastewater products, including the latest version of the OPTISONIC 6300 clamp-on ultrasonic flowmeter at WEFTEC 2023. Likewise, in January 2023, the company announced to exhibit products for food and beverage production at the Food Processing Expo 2023, which includes the OPTISONIC 6300P ultrasonic clamp-on flowmeter, the WATERFLUX 3070 electromagnetic water meter, and the OPTIFLUX 2000 electromagnetic flow sensor.
9. What pricing options are available for accessing the report?
Pricing options include single-user, multi-user, and enterprise licenses priced at USD 3800, USD 4500, and USD 5800 respectively.
10. Is the market size provided in terms of value or volume?
The market size is provided in terms of value, measured in Million.
11. Are there any specific market keywords associated with the report?
Yes, the market keyword associated with the report is "US Industrial Sensors Market," which aids in identifying and referencing the specific market segment covered.
12. How do I determine which pricing option suits my needs best?
The pricing options vary based on user requirements and access needs. Individual users may opt for single-user licenses, while businesses requiring broader access may choose multi-user or enterprise licenses for cost-effective access to the report.
13. Are there any additional resources or data provided in the US Industrial Sensors Market report?
While the report offers comprehensive insights, it's advisable to review the specific contents or supplementary materials provided to ascertain if additional resources or data are available.
14. How can I stay updated on further developments or reports in the US Industrial Sensors Market?
To stay informed about further developments, trends, and reports in the US Industrial Sensors Market, consider subscribing to industry newsletters, following relevant companies and organizations, or regularly checking reputable industry news sources and publications.
Methodology
Step 1 - Identification of Relevant Samples Size from Population Database


Step 2 - Approaches for Defining Global Market Size (Value, Volume* & Price*)

Note*: In applicable scenarios
Step 3 - Data Sources
Primary Research
- Web Analytics
- Survey Reports
- Research Institute
- Latest Research Reports
- Opinion Leaders
Secondary Research
- Annual Reports
- White Paper
- Latest Press Release
- Industry Association
- Paid Database
- Investor Presentations

Step 4 - Data Triangulation
Involves using different sources of information in order to increase the validity of a study
These sources are likely to be stakeholders in a program - participants, other researchers, program staff, other community members, and so on.
Then we put all data in single framework & apply various statistical tools to find out the dynamic on the market.
During the analysis stage, feedback from the stakeholder groups would be compared to determine areas of agreement as well as areas of divergence
