

Key Insights
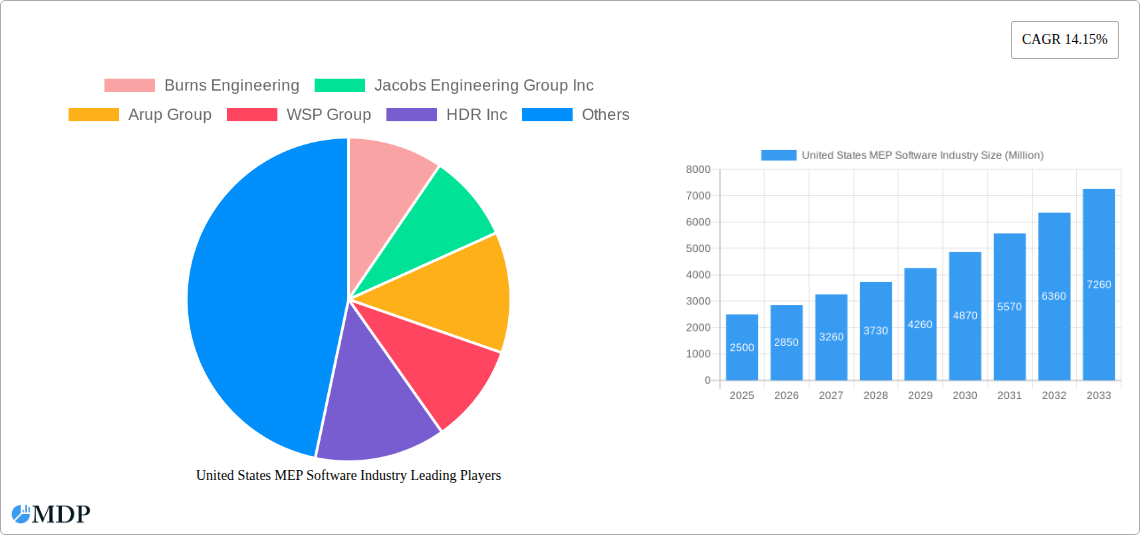
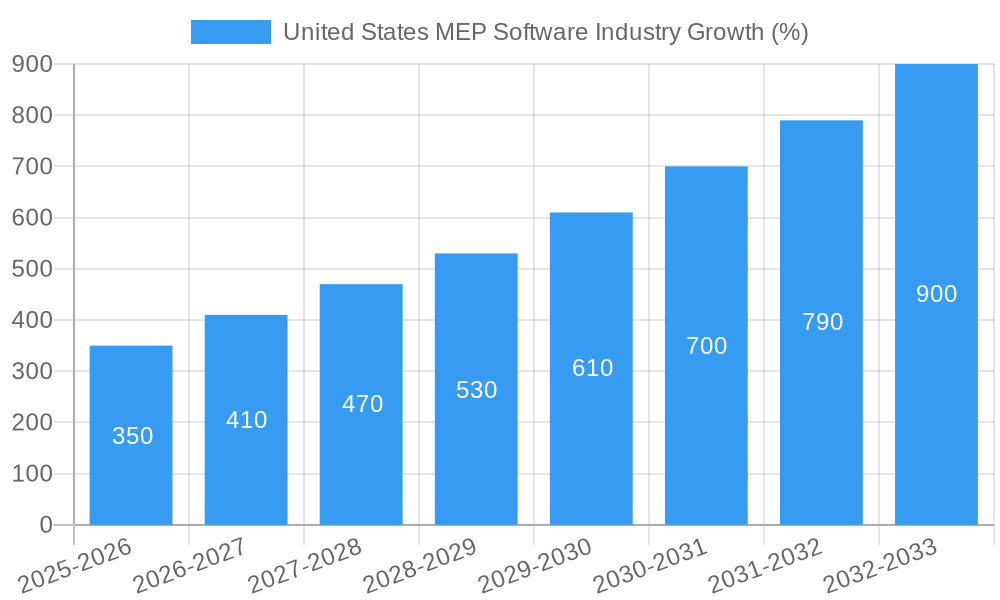
The United States MEP (Mechanical, Electrical, and Plumbing) software market is experiencing robust growth, projected to reach a substantial size driven by increasing construction activity, particularly in the healthcare and commercial office sectors. The market's Compound Annual Growth Rate (CAGR) of 14.15% from 2019 to 2024 suggests a strong upward trajectory, indicating a significant market opportunity for software vendors. This growth is fueled by several factors. Firstly, the demand for Building Information Modeling (BIM) software is soaring as it streamlines design, collaboration, and construction management processes, resulting in improved efficiency and cost savings. Secondly, the increasing complexity of building systems necessitates sophisticated software solutions to manage intricate designs and ensure compliance with building codes and regulations. Thirdly, the growing adoption of cloud-based MEP software is enhancing accessibility and collaboration among project stakeholders. The market is segmented by type (new construction, retrofit & renovation, commissioning activity) and end-user vertical (healthcare, commercial offices, educational institutions). While the retrofit and renovation segment may experience fluctuations based on economic cycles, the new construction sector provides consistent demand, particularly in rapidly expanding urban areas. Competition is intense among established players like Autodesk, Bentley Systems, and Graphisoft, along with smaller specialized firms. The market’s future hinges on technological advancements such as AI integration, improved interoperability between different software platforms, and the development of user-friendly interfaces catering to diverse user skill levels. The robust growth trajectory anticipates continued demand for skilled professionals proficient in utilizing these advanced software solutions.
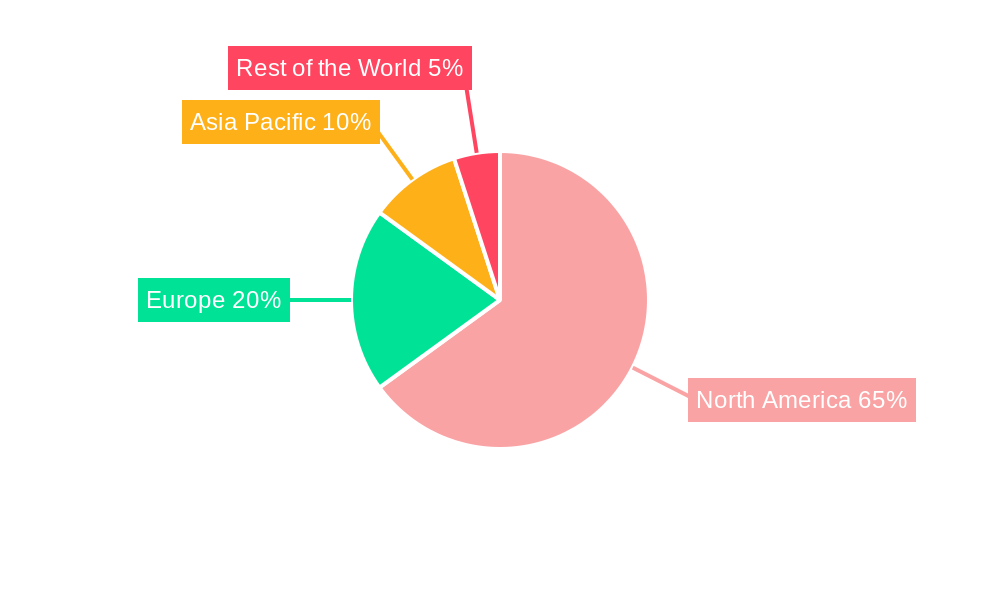
The North American market, particularly the United States, dominates the global MEP software landscape. This dominance stems from significant investments in infrastructure projects, a robust construction industry, and the early adoption of advanced technologies. Factors influencing the market include government regulations promoting energy efficiency and sustainable building practices, which in turn drive the demand for software that facilitates such designs. Furthermore, the increasing focus on data-driven decision-making in the construction industry fuels the demand for software that offers robust data analysis capabilities. Continued innovation in software functionalities, such as improved simulation tools for energy performance analysis and virtual reality (VR)/augmented reality (AR) integration for enhanced visualization, will likely shape future growth. However, challenges such as the high initial cost of software and the need for continuous training and upskilling of professionals could potentially moderate market growth to some extent.
United States MEP Software Industry Report: 2019-2033 Forecast
This comprehensive report provides an in-depth analysis of the United States MEP (Mechanical, Electrical, and Plumbing) software industry, offering invaluable insights for stakeholders, investors, and industry professionals. Covering the period from 2019 to 2033, with a focus on the 2025-2033 forecast period, this report unveils key market trends, growth drivers, and challenges shaping this dynamic sector. The market size is projected to reach xx Million by 2033, exhibiting a CAGR of xx% during the forecast period.
United States MEP Software Industry Market Dynamics & Concentration
The US MEP software market exhibits a moderately concentrated landscape, with several key players vying for market share. While precise market share data for individual companies remains proprietary, the industry is characterized by a mix of established giants and emerging niche players. The market's concentration is influenced by factors like the high barrier to entry (requiring significant R&D investment), the consolidation through mergers and acquisitions (M&A), and the ongoing technological innovation driving the development of specialized software solutions.
Innovation Drivers: The industry is driven by the constant need for enhanced design efficiency, improved collaboration tools, Building Information Modeling (BIM) integration, and the growing adoption of cloud-based platforms.
Regulatory Frameworks: Building codes and regulations influence software development, prompting the integration of compliance features.
Product Substitutes: While complete substitutes are rare, some companies use general-purpose CAD or design software, but dedicated MEP software offers superior efficiency and functionality.
End-User Trends: The increasing demand for sustainable building designs and energy efficiency is pushing the adoption of specialized MEP software capable of analyzing and optimizing energy performance.
M&A Activities: The past few years have witnessed a moderate level of M&A activity. For example, the xx Million acquisition of xx by xx in xx illustrates the strategy of larger players to expand their capabilities and market reach. The estimated number of M&A deals between 2019 and 2024 was approximately xx, reflecting a moderately active consolidation phase.
United States MEP Software Industry Industry Trends & Analysis
The US MEP software market is experiencing robust growth, fueled by several key factors. The increasing adoption of BIM across the AEC (Architecture, Engineering, and Construction) industry is driving significant demand for software solutions supporting BIM workflows. Technological disruptions, such as the rise of cloud-based solutions and AI-powered design tools, are also transforming industry practices and driving market expansion. The preference for streamlined workflows, enhanced collaboration, and data-driven decision-making is also leading to increased software adoption.
The market’s competitive dynamics are characterized by a mix of fierce competition among established players and the emergence of innovative startups. Established vendors often leverage their extensive client base and brand recognition to maintain market share. However, startups often introduce disruptive technologies and innovative business models, creating competitive pressure.
The projected market size for 2025 is estimated at xx Million, and it is forecasted to reach xx Million by 2033. The CAGR for this period is estimated to be xx%. Market penetration in terms of building projects using MEP software is currently estimated at approximately xx%, and it is projected to reach xx% by 2033.
Leading Markets & Segments in United States MEP Software Industry
The US MEP software market shows strong growth across various segments, with particular prominence in specific areas.
By Type:
- New Construction: This segment remains the largest, driven by the continuous demand for new buildings in various sectors.
- Retrofit & Renovation: This segment shows steady growth, driven by the focus on improving the efficiency and sustainability of existing infrastructure.
- Commissioning Activity: Increased emphasis on building performance and compliance is driving demand for commissioning software.
- Other Types: This segment includes specialized software for specific MEP tasks, like lighting design or fire protection system planning.
By End-user Vertical:
- Healthcare: The healthcare sector's stringent regulations and complex requirements create high demand for specialized MEP software.
- Commercial Offices: High construction activity in this sector fuels demand for efficiency-enhancing software.
- Educational Institutions: Expansion in education and refurbishment projects drive demand for MEP software optimized for educational buildings.
- Public Spaces and Institutions: Government projects and the need for cost-effective solutions drive adoption.
- Industrial establishments & Warehouses: The growing industrial sector needs specialized software for managing complex facilities.
- Other Commercial entities (Data centers, Research, etc.): The specific needs of these specialized sectors drive demand for niche software.
Key drivers for the leading segments include robust construction activity, increasing government investment in infrastructure (particularly in healthcare and education), and stringent regulatory compliance requirements promoting energy efficiency and building performance.
United States MEP Software Industry Product Developments
Recent product developments emphasize cloud-based solutions offering enhanced collaboration features, improved BIM integration, and advanced analytics capabilities. Software vendors are increasingly incorporating AI-driven features for optimizing designs, automating tasks, and enhancing energy efficiency analysis. These innovations provide users with tools to address the growing complexity of MEP systems while improving design accuracy, reducing costs, and speeding up project delivery timelines. The integration of AR/VR is also shaping the development of immersive tools for visualization and collaboration, further enhancing the market fit of these offerings.
Key Drivers of United States MEP Software Industry Growth
Several factors contribute to the growth of the US MEP software industry. Firstly, the rising adoption of BIM across the AEC sector significantly impacts demand, pushing for compatible solutions. Secondly, economic factors like consistent infrastructure investment and commercial construction activity further drive the demand for efficient design and management tools. Finally, government regulations promoting energy efficiency and sustainable building practices are leading to the increased adoption of software with integrated performance analysis capabilities.
Challenges in the United States MEP Software Industry Market
The industry faces several challenges. The high initial investment in software acquisition and training can be a barrier for smaller firms. The ongoing need for software updates and technical support also represents a significant ongoing cost. Furthermore, intense competition and the rapid pace of technological advancements demand continuous innovation to maintain a competitive edge. These factors combined can put pressure on profit margins and hinder market penetration, especially among smaller firms.
Emerging Opportunities in United States MEP Software Industry
The integration of Artificial Intelligence (AI) and Machine Learning (ML) for predictive modeling and automated design optimization represents a significant emerging opportunity. The rise of Internet of Things (IoT) sensors in buildings presents potential for integration with MEP software for real-time performance monitoring and improved operational efficiency. Furthermore, expanding into international markets and forming strategic partnerships with leading AEC firms could unlock substantial growth potential for US-based MEP software companies.
Leading Players in the United States MEP Software Industry Sector
- Burns Engineering
- Jacobs Engineering Group Inc
- Arup Group
- WSP Group
- HDR Inc
- Stantec Inc
- MEP Engineering
- Wiley Wilson
- Affiliated Engineers Inc
- AHA Consulting
- AECOM
- Macro Services
Key Milestones in United States MEP Software Industry Industry
- February 2021: Bowman Consulting Group, Ltd. acquired KTA Group, Inc., expanding its service offerings in MEP engineering and design review. This acquisition demonstrated a consolidation trend within the industry.
- May 2021: AECOM secured a contract for program management services for the USD 3.5 billion Dallas Independent School District (DISD) 2020 Bond Program. This highlighted the growing role of MEP software in large-scale infrastructure projects.
Strategic Outlook for United States MEP Software Industry Market
The future of the US MEP software market looks promising, driven by technological advancements, rising infrastructure investments, and a growing focus on sustainability. Strategic partnerships, expansion into new geographical markets, and continuous innovation in software features will be key to achieving long-term success. The integration of AI, cloud computing, and the Internet of Things (IoT) will reshape how MEP systems are designed, constructed, and operated, driving ongoing demand for sophisticated software solutions.
United States MEP Software Industry Segmentation
-
1. Type
- 1.1. New Construction
- 1.2. Retrofit & Renovation
- 1.3. Commissioning Activity
- 1.4. Other Types
-
2. End-user Vertical
- 2.1. Healthcare
- 2.2. Commercial Offices
- 2.3. Educational Institutions
- 2.4. Public Spaces and Institutions
- 2.5. Industrial establishments & Warehouses
- 2.6. Other Co
United States MEP Software Industry Segmentation By Geography
- 1. United States
United States MEP Software Industry REPORT HIGHLIGHTS
| Aspects | Details |
|---|---|
| Study Period | 2019-2033 |
| Base Year | 2024 |
| Estimated Year | 2025 |
| Forecast Period | 2025-2033 |
| Historical Period | 2019-2024 |
| Growth Rate | CAGR of 14.15% from 2019-2033 |
| Segmentation |
|
Table of Contents
- 1. Introduction
- 1.1. Research Scope
- 1.2. Market Segmentation
- 1.3. Research Methodology
- 1.4. Definitions and Assumptions
- 2. Executive Summary
- 2.1. Introduction
- 3. Market Dynamics
- 3.1. Introduction
- 3.2. Market Drivers
- 3.2.1. Growing Emphasis on Outsourcing of MEP Services to Focus on Core Offering; Steady Demand from Commercial and Healthcare Institutions; Evolving Business Models and Nature of Collaboration between Firms and Service Vendors
- 3.3. Market Restrains
- 3.3.1. Operational Challenges in High Market Concentration and Growing Demand for End-to-end Offering Affect Smaller Firms
- 3.4. Market Trends
- 3.4.1. New Construction to Drive the Market Growth
- 4. Market Factor Analysis
- 4.1. Porters Five Forces
- 4.2. Supply/Value Chain
- 4.3. PESTEL analysis
- 4.4. Market Entropy
- 4.5. Patent/Trademark Analysis
- 5. United States MEP Software Industry Analysis, Insights and Forecast, 2019-2031
- 5.1. Market Analysis, Insights and Forecast - by Type
- 5.1.1. New Construction
- 5.1.2. Retrofit & Renovation
- 5.1.3. Commissioning Activity
- 5.1.4. Other Types
- 5.2. Market Analysis, Insights and Forecast - by End-user Vertical
- 5.2.1. Healthcare
- 5.2.2. Commercial Offices
- 5.2.3. Educational Institutions
- 5.2.4. Public Spaces and Institutions
- 5.2.5. Industrial establishments & Warehouses
- 5.2.6. Other Co
- 5.3. Market Analysis, Insights and Forecast - by Region
- 5.3.1. United States
- 5.1. Market Analysis, Insights and Forecast - by Type
- 6. North America United States MEP Software Industry Analysis, Insights and Forecast, 2019-2031
- 6.1. Market Analysis, Insights and Forecast - By Country/Sub-region
- 6.1.1 United States
- 6.1.2 Canada
- 7. Europe United States MEP Software Industry Analysis, Insights and Forecast, 2019-2031
- 7.1. Market Analysis, Insights and Forecast - By Country/Sub-region
- 7.1.1 United Kingdom
- 7.1.2 Italy
- 7.1.3 Germany
- 7.1.4 France
- 7.1.5 Rest of Europe
- 8. Asia Pacific United States MEP Software Industry Analysis, Insights and Forecast, 2019-2031
- 8.1. Market Analysis, Insights and Forecast - By Country/Sub-region
- 8.1.1 China
- 8.1.2 Japan
- 8.1.3 South Korea
- 8.1.4 India
- 8.1.5 Rest of Asia Pacific
- 9. Rest of the World United States MEP Software Industry Analysis, Insights and Forecast, 2019-2031
- 9.1. Market Analysis, Insights and Forecast - By Country/Sub-region
- 9.1.1.
- 10. Competitive Analysis
- 10.1. Market Share Analysis 2024
- 10.2. Company Profiles
- 10.2.1 Burns Engineering
- 10.2.1.1. Overview
- 10.2.1.2. Products
- 10.2.1.3. SWOT Analysis
- 10.2.1.4. Recent Developments
- 10.2.1.5. Financials (Based on Availability)
- 10.2.2 Jacobs Engineering Group Inc
- 10.2.2.1. Overview
- 10.2.2.2. Products
- 10.2.2.3. SWOT Analysis
- 10.2.2.4. Recent Developments
- 10.2.2.5. Financials (Based on Availability)
- 10.2.3 Arup Group
- 10.2.3.1. Overview
- 10.2.3.2. Products
- 10.2.3.3. SWOT Analysis
- 10.2.3.4. Recent Developments
- 10.2.3.5. Financials (Based on Availability)
- 10.2.4 WSP Group
- 10.2.4.1. Overview
- 10.2.4.2. Products
- 10.2.4.3. SWOT Analysis
- 10.2.4.4. Recent Developments
- 10.2.4.5. Financials (Based on Availability)
- 10.2.5 HDR Inc
- 10.2.5.1. Overview
- 10.2.5.2. Products
- 10.2.5.3. SWOT Analysis
- 10.2.5.4. Recent Developments
- 10.2.5.5. Financials (Based on Availability)
- 10.2.6 Stantec Inc
- 10.2.6.1. Overview
- 10.2.6.2. Products
- 10.2.6.3. SWOT Analysis
- 10.2.6.4. Recent Developments
- 10.2.6.5. Financials (Based on Availability)
- 10.2.7 MEP Engineering
- 10.2.7.1. Overview
- 10.2.7.2. Products
- 10.2.7.3. SWOT Analysis
- 10.2.7.4. Recent Developments
- 10.2.7.5. Financials (Based on Availability)
- 10.2.8 Wiley Wilson*List Not Exhaustive
- 10.2.8.1. Overview
- 10.2.8.2. Products
- 10.2.8.3. SWOT Analysis
- 10.2.8.4. Recent Developments
- 10.2.8.5. Financials (Based on Availability)
- 10.2.9 Affiliated Engineers Inc
- 10.2.9.1. Overview
- 10.2.9.2. Products
- 10.2.9.3. SWOT Analysis
- 10.2.9.4. Recent Developments
- 10.2.9.5. Financials (Based on Availability)
- 10.2.10 AHA Consulting
- 10.2.10.1. Overview
- 10.2.10.2. Products
- 10.2.10.3. SWOT Analysis
- 10.2.10.4. Recent Developments
- 10.2.10.5. Financials (Based on Availability)
- 10.2.11 AECOM
- 10.2.11.1. Overview
- 10.2.11.2. Products
- 10.2.11.3. SWOT Analysis
- 10.2.11.4. Recent Developments
- 10.2.11.5. Financials (Based on Availability)
- 10.2.12 Macro Services
- 10.2.12.1. Overview
- 10.2.12.2. Products
- 10.2.12.3. SWOT Analysis
- 10.2.12.4. Recent Developments
- 10.2.12.5. Financials (Based on Availability)
- 10.2.1 Burns Engineering
List of Figures
- Figure 1: United States MEP Software Industry Revenue Breakdown (Million, %) by Product 2024 & 2032
- Figure 2: United States MEP Software Industry Share (%) by Company 2024
List of Tables
- Table 1: United States MEP Software Industry Revenue Million Forecast, by Region 2019 & 2032
- Table 2: United States MEP Software Industry Revenue Million Forecast, by Type 2019 & 2032
- Table 3: United States MEP Software Industry Revenue Million Forecast, by End-user Vertical 2019 & 2032
- Table 4: United States MEP Software Industry Revenue Million Forecast, by Region 2019 & 2032
- Table 5: United States MEP Software Industry Revenue Million Forecast, by Country 2019 & 2032
- Table 6: United States United States MEP Software Industry Revenue (Million) Forecast, by Application 2019 & 2032
- Table 7: Canada United States MEP Software Industry Revenue (Million) Forecast, by Application 2019 & 2032
- Table 8: United States MEP Software Industry Revenue Million Forecast, by Country 2019 & 2032
- Table 9: United Kingdom United States MEP Software Industry Revenue (Million) Forecast, by Application 2019 & 2032
- Table 10: Italy United States MEP Software Industry Revenue (Million) Forecast, by Application 2019 & 2032
- Table 11: Germany United States MEP Software Industry Revenue (Million) Forecast, by Application 2019 & 2032
- Table 12: France United States MEP Software Industry Revenue (Million) Forecast, by Application 2019 & 2032
- Table 13: Rest of Europe United States MEP Software Industry Revenue (Million) Forecast, by Application 2019 & 2032
- Table 14: United States MEP Software Industry Revenue Million Forecast, by Country 2019 & 2032
- Table 15: China United States MEP Software Industry Revenue (Million) Forecast, by Application 2019 & 2032
- Table 16: Japan United States MEP Software Industry Revenue (Million) Forecast, by Application 2019 & 2032
- Table 17: South Korea United States MEP Software Industry Revenue (Million) Forecast, by Application 2019 & 2032
- Table 18: India United States MEP Software Industry Revenue (Million) Forecast, by Application 2019 & 2032
- Table 19: Rest of Asia Pacific United States MEP Software Industry Revenue (Million) Forecast, by Application 2019 & 2032
- Table 20: United States MEP Software Industry Revenue Million Forecast, by Country 2019 & 2032
- Table 21: United States MEP Software Industry Revenue (Million) Forecast, by Application 2019 & 2032
- Table 22: United States MEP Software Industry Revenue Million Forecast, by Type 2019 & 2032
- Table 23: United States MEP Software Industry Revenue Million Forecast, by End-user Vertical 2019 & 2032
- Table 24: United States MEP Software Industry Revenue Million Forecast, by Country 2019 & 2032
Frequently Asked Questions
1. What is the projected Compound Annual Growth Rate (CAGR) of the United States MEP Software Industry?
The projected CAGR is approximately 14.15%.
2. Which companies are prominent players in the United States MEP Software Industry?
Key companies in the market include Burns Engineering, Jacobs Engineering Group Inc, Arup Group, WSP Group, HDR Inc, Stantec Inc, MEP Engineering, Wiley Wilson*List Not Exhaustive, Affiliated Engineers Inc, AHA Consulting, AECOM, Macro Services.
3. What are the main segments of the United States MEP Software Industry?
The market segments include Type, End-user Vertical.
4. Can you provide details about the market size?
The market size is estimated to be USD 45.39 Million as of 2022.
5. What are some drivers contributing to market growth?
Growing Emphasis on Outsourcing of MEP Services to Focus on Core Offering; Steady Demand from Commercial and Healthcare Institutions; Evolving Business Models and Nature of Collaboration between Firms and Service Vendors.
6. What are the notable trends driving market growth?
New Construction to Drive the Market Growth.
7. Are there any restraints impacting market growth?
Operational Challenges in High Market Concentration and Growing Demand for End-to-end Offering Affect Smaller Firms.
8. Can you provide examples of recent developments in the market?
February 2021 - Bowman Consulting Group, Ltd., acquired KTA Group, Inc. KTA is a forty-person engineering firm with core expertise in mechanical, electrical, and plumbing engineering, commissioning third-party plan review, and lighting design. The move supports Bowman's continued growth and substantially broadens its scope of service offerings.
9. What pricing options are available for accessing the report?
Pricing options include single-user, multi-user, and enterprise licenses priced at USD 3800, USD 4500, and USD 5800 respectively.
10. Is the market size provided in terms of value or volume?
The market size is provided in terms of value, measured in Million.
11. Are there any specific market keywords associated with the report?
Yes, the market keyword associated with the report is "United States MEP Software Industry," which aids in identifying and referencing the specific market segment covered.
12. How do I determine which pricing option suits my needs best?
The pricing options vary based on user requirements and access needs. Individual users may opt for single-user licenses, while businesses requiring broader access may choose multi-user or enterprise licenses for cost-effective access to the report.
13. Are there any additional resources or data provided in the United States MEP Software Industry report?
While the report offers comprehensive insights, it's advisable to review the specific contents or supplementary materials provided to ascertain if additional resources or data are available.
14. How can I stay updated on further developments or reports in the United States MEP Software Industry?
To stay informed about further developments, trends, and reports in the United States MEP Software Industry, consider subscribing to industry newsletters, following relevant companies and organizations, or regularly checking reputable industry news sources and publications.
Methodology
Step 1 - Identification of Relevant Samples Size from Population Database


Step 2 - Approaches for Defining Global Market Size (Value, Volume* & Price*)

Note*: In applicable scenarios
Step 3 - Data Sources
Primary Research
- Web Analytics
- Survey Reports
- Research Institute
- Latest Research Reports
- Opinion Leaders
Secondary Research
- Annual Reports
- White Paper
- Latest Press Release
- Industry Association
- Paid Database
- Investor Presentations

Step 4 - Data Triangulation
Involves using different sources of information in order to increase the validity of a study
These sources are likely to be stakeholders in a program - participants, other researchers, program staff, other community members, and so on.
Then we put all data in single framework & apply various statistical tools to find out the dynamic on the market.
During the analysis stage, feedback from the stakeholder groups would be compared to determine areas of agreement as well as areas of divergence
