

Key Insights
The global subsea cable market for offshore wind energy is projected for substantial expansion, driven by the worldwide shift to renewables and escalating demand for offshore wind-generated electricity. The market is categorized by application (fixed and floating wind turbines) and cable type (single-core and multi-core). The increasing deployment of larger-scale wind farms in deeper waters is stimulating demand for floating wind turbine technology and associated subsea cables, presenting a key growth avenue. Leading industry participants, including ABB, Nexans, and Prysmian, are prioritizing R&D for enhanced cable capabilities, focusing on greater capacity, extended lifespan, and improved reliability in challenging marine conditions. Regional market leadership is observed in North America, Europe, and Asia-Pacific, attributed to supportive governmental policies, significant investments in offshore wind projects, and well-established manufacturing and installation ecosystems. Nevertheless, market hurdles persist, such as considerable upfront investment for subsea cable installation and upkeep, alongside intricate regulatory frameworks and environmental considerations concerning underwater cable deployment.
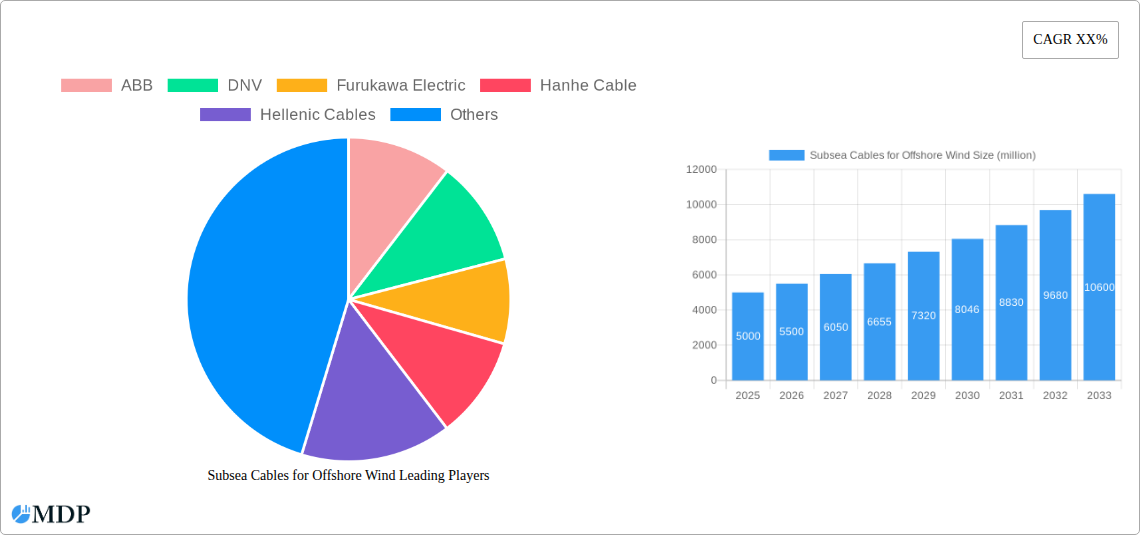
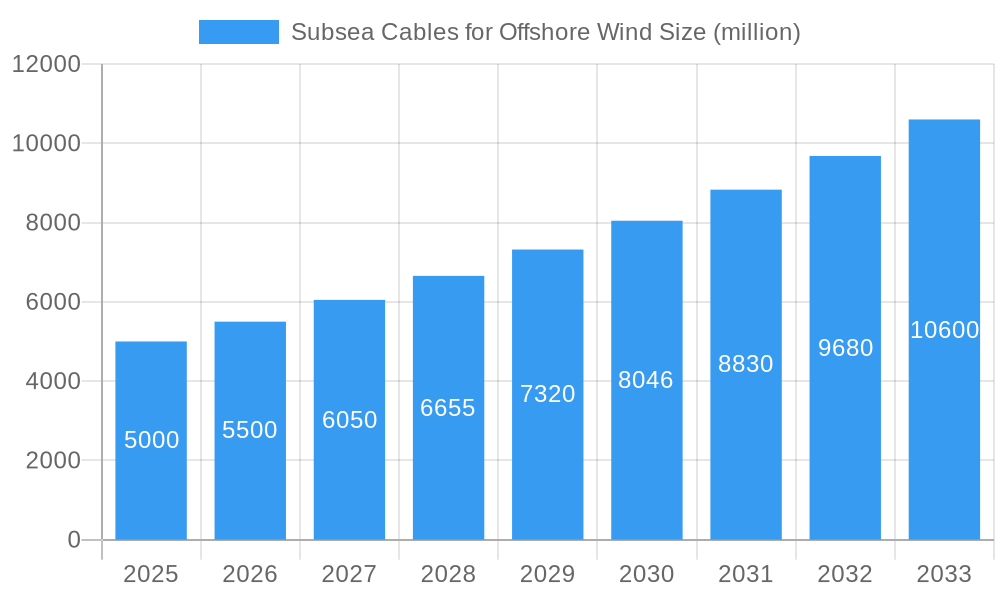
Subsea Cables for Offshore Wind Market Size (In Billion)
Despite these obstacles, the subsea cable market for offshore wind forecasts a robust long-term trajectory. Ongoing advancements in efficient and cost-effective cable technologies, combined with rising electricity prices and heightened environmental consciousness, are poised to fuel market growth. The integration of smart grids and digitalization within the offshore wind sector further bolsters the need for sophisticated subsea cable solutions. This expansion is anticipated through the forecast period, with an estimated market size of $3.554 billion by 2025, exhibiting a compound annual growth rate (CAGR) of 19.05%. Technological innovations, such as higher-voltage cables and refined installation methodologies, will continue to influence market dynamics.
Subsea Cables for Offshore Wind Company Market Share
Subsea Cables for Offshore Wind: A Comprehensive Market Report (2019-2033)
Unlock the potential of the booming offshore wind energy sector with this in-depth analysis of the subsea cable market. This comprehensive report provides a detailed examination of market dynamics, key players, technological advancements, and future growth projections for the period 2019-2033. With a focus on fixed and floating wind turbine applications, this report is essential for industry stakeholders, investors, and anyone seeking to understand this rapidly evolving market. The global market is projected to reach xx million by 2033, exhibiting a robust CAGR of xx% during the forecast period (2025-2033).
Subsea Cables for Offshore Wind Market Dynamics & Concentration
The subsea cable market for offshore wind is characterized by a moderate level of concentration, with key players such as ABB, DNV, Furukawa Electric, Hanhe Cable, Hellenic Cables, HENGTONG, JDR Cable Systems, LS Cable, Nexans, ZTT, NKT Cables, Orient Cable, Prysmian, and SEI holding significant market share. In 2025, the top 5 players are estimated to account for approximately xx% of the market.
Innovation is a key driver, with ongoing research into higher voltage cables, improved insulation materials, and more efficient installation techniques. Stringent regulatory frameworks concerning safety and environmental impact also shape the market. While there are currently limited direct substitutes for subsea cables in offshore wind, advancements in wireless power transmission technology could pose a long-term threat. The market is also influenced by end-user preferences for reliable, long-lasting, and cost-effective solutions. M&A activity has been significant in recent years, with xx deals recorded between 2019 and 2024, indicating consolidation within the industry. This trend is expected to continue, driven by the need for economies of scale and enhanced technological capabilities.
Subsea Cables for Offshore Wind Industry Trends & Analysis
The offshore wind energy market is experiencing exponential growth, driven by the global imperative to transition to cleaner energy sources. This has directly translated into increased demand for subsea cables, with the market exhibiting a Compound Annual Growth Rate (CAGR) of xx% during the historical period (2019-2024). This growth is further fueled by supportive government policies, decreasing costs of offshore wind energy, and technological advancements in cable design and installation. The market penetration of subsea cables in offshore wind projects is increasing steadily, with xx% of new projects utilizing this technology in 2024. However, the industry faces challenges, including the need to adapt to the increasing water depths required for floating wind turbines and the development of more resilient cables able to withstand harsh marine environments. Competitive dynamics are intense, with companies constantly vying for market share through innovation, cost optimization, and strategic partnerships. Consumer preferences are shifting towards higher capacity and more sustainable cable solutions, further stimulating technological innovation.
Leading Markets & Segments in Subsea Cables for Offshore Wind
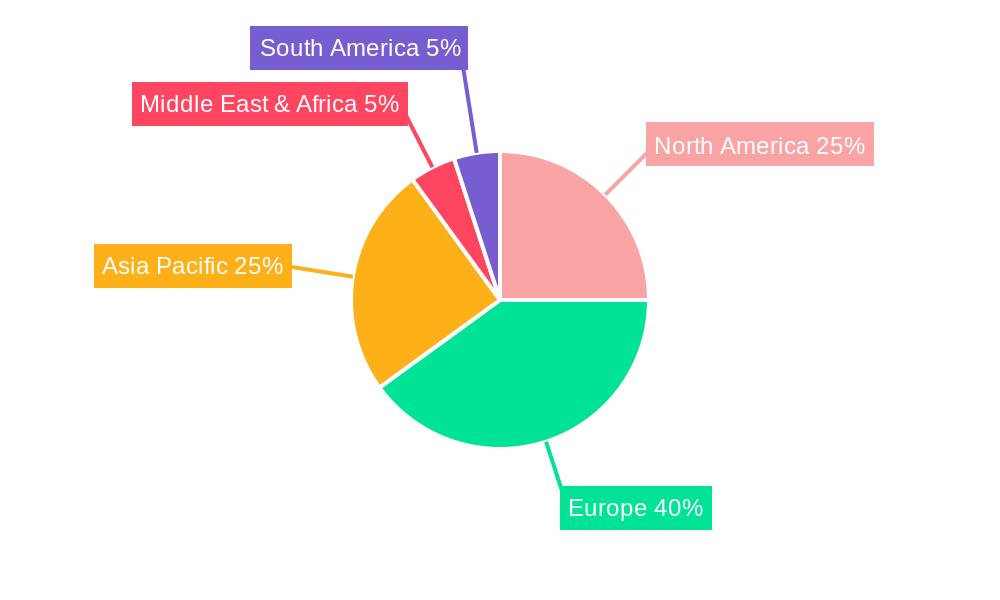
Europe remains the dominant region for offshore wind energy, driving high demand for subsea cables. Within Europe, countries like the UK, Germany, and Denmark are leading the charge. The fixed wind turbine segment currently holds the larger market share due to the greater maturity of this technology and its deployment in shallower waters. However, the floating wind turbine segment is expected to witness significant growth in the coming years, as offshore wind farms move into deeper waters.
Key Drivers for Fixed Wind Turbines (Shallower Waters):
- Established infrastructure in shallow water areas.
- Lower installation costs compared to floating turbines.
- Governmental support and incentives.
Key Drivers for Floating Wind Turbines (Deeper Waters):
- Access to larger wind resources in deeper waters.
- Technological advancements in mooring and floating platforms.
- Government funding for deep-water projects.
The multicore cable segment is gaining traction due to its higher capacity and efficiency compared to single-core cables, although single-core cables retain a significant market presence owing to their established technology and suitability for certain applications.
Subsea Cables for Offshore Wind Product Developments
Recent product innovations include the development of higher voltage cables, allowing for greater transmission capacity over longer distances, and improved insulation materials that enhance cable lifespan and resilience to harsh marine conditions. These advancements are crucial for accommodating the increasing scale and complexity of offshore wind farms. The integration of advanced monitoring systems for real-time cable condition assessment also represents a significant step forward, enabling predictive maintenance and enhanced operational efficiency. These innovations offer significant competitive advantages to cable manufacturers, allowing them to secure contracts for large-scale projects.
Key Drivers of Subsea Cables for Offshore Wind Growth
The growth of the subsea cables market for offshore wind is underpinned by several factors. Technological advancements, such as the development of higher voltage and more durable cables, are crucial. Stringent environmental regulations are pushing the industry towards more sustainable solutions. Government policies offering financial incentives and supporting the transition to renewable energy further bolster market expansion. The growing awareness of climate change and the need for a reduction in carbon emissions are creating a strong impetus for the adoption of offshore wind energy and, consequently, the subsea cables that enable it.
Challenges in the Subsea Cables for Offshore Wind Market
The subsea cable market faces several challenges. Regulatory hurdles, particularly concerning environmental impact assessments and cable installation permits, can lead to project delays and increased costs. Supply chain disruptions, particularly concerning raw materials, can impact production and lead to price volatility. Intense competition among cable manufacturers and the need for substantial investments in research and development pose ongoing difficulties. These factors can lead to a xx% reduction in project profitability, according to industry estimates.
Emerging Opportunities in Subsea Cables for Offshore Wind
Significant opportunities exist for long-term growth. Technological breakthroughs in areas such as high-temperature superconducting cables promise to revolutionize transmission capacity and efficiency. Strategic partnerships between cable manufacturers, wind turbine developers, and grid operators can accelerate project deployment. Market expansion into new geographical regions with significant offshore wind resources, such as Asia-Pacific, will create substantial demand.
Leading Players in the Subsea Cables for Offshore Wind Sector
- ABB
- DNV
- Furukawa Electric
- Hanhe Cable
- Hellenic Cables
- HENGTONG
- JDR Cable Systems
- LS Cable
- Nexans
- ZTT
- NKT Cable
- Orient Cable
- Prysmian
- SEI
Key Milestones in Subsea Cables for Offshore Wind Industry
- 2020: Launch of a new high-voltage subsea cable by Nexans, significantly improving transmission capacity.
- 2021: Merger between two major cable manufacturers, leading to increased market concentration.
- 2022: Successful installation of a floating wind farm utilizing innovative subsea cable technology.
- 2023: Introduction of a new cable monitoring system by ABB, enhancing operational efficiency and reducing maintenance costs.
- 2024: Significant government funding announced for the development of next-generation subsea cables.
Strategic Outlook for Subsea Cables for Offshore Wind Market
The future of the subsea cable market for offshore wind is exceptionally promising. Ongoing technological advancements, coupled with strong government support and increasing demand for renewable energy, will propel market growth. Strategic investments in research and development, focusing on higher capacity, more resilient, and cost-effective cables, will be crucial for success. Companies that leverage strategic partnerships and effectively navigate regulatory landscapes will be best positioned to capture market share and capitalize on the immense opportunities within this dynamic sector. The market is projected to reach xx million by 2033, presenting significant opportunities for investors and industry players alike.
Subsea Cables for Offshore Wind Segmentation
-
1. Application
- 1.1. Fixed Wind Turbines (Shallower Waters)
- 1.2. Floating Wind Turbines (Deeper Waters)
-
2. Types
- 2.1. Single Core Cable
- 2.2. Multicore Cable
Subsea Cables for Offshore Wind Segmentation By Geography
-
1. North America
- 1.1. United States
- 1.2. Canada
- 1.3. Mexico
-
2. South America
- 2.1. Brazil
- 2.2. Argentina
- 2.3. Rest of South America
-
3. Europe
- 3.1. United Kingdom
- 3.2. Germany
- 3.3. France
- 3.4. Italy
- 3.5. Spain
- 3.6. Russia
- 3.7. Benelux
- 3.8. Nordics
- 3.9. Rest of Europe
-
4. Middle East & Africa
- 4.1. Turkey
- 4.2. Israel
- 4.3. GCC
- 4.4. North Africa
- 4.5. South Africa
- 4.6. Rest of Middle East & Africa
-
5. Asia Pacific
- 5.1. China
- 5.2. India
- 5.3. Japan
- 5.4. South Korea
- 5.5. ASEAN
- 5.6. Oceania
- 5.7. Rest of Asia Pacific
Subsea Cables for Offshore Wind Regional Market Share
Geographic Coverage of Subsea Cables for Offshore Wind
Subsea Cables for Offshore Wind REPORT HIGHLIGHTS
| Aspects | Details |
|---|---|
| Study Period | 2020-2034 |
| Base Year | 2025 |
| Estimated Year | 2026 |
| Forecast Period | 2026-2034 |
| Historical Period | 2020-2025 |
| Growth Rate | CAGR of 19.05% from 2020-2034 |
| Segmentation |
|
Table of Contents
- 1. Introduction
- 1.1. Research Scope
- 1.2. Market Segmentation
- 1.3. Research Methodology
- 1.4. Definitions and Assumptions
- 2. Executive Summary
- 2.1. Introduction
- 3. Market Dynamics
- 3.1. Introduction
- 3.2. Market Drivers
- 3.3. Market Restrains
- 3.4. Market Trends
- 4. Market Factor Analysis
- 4.1. Porters Five Forces
- 4.2. Supply/Value Chain
- 4.3. PESTEL analysis
- 4.4. Market Entropy
- 4.5. Patent/Trademark Analysis
- 5. Global Subsea Cables for Offshore Wind Analysis, Insights and Forecast, 2020-2032
- 5.1. Market Analysis, Insights and Forecast - by Application
- 5.1.1. Fixed Wind Turbines (Shallower Waters)
- 5.1.2. Floating Wind Turbines (Deeper Waters)
- 5.2. Market Analysis, Insights and Forecast - by Types
- 5.2.1. Single Core Cable
- 5.2.2. Multicore Cable
- 5.3. Market Analysis, Insights and Forecast - by Region
- 5.3.1. North America
- 5.3.2. South America
- 5.3.3. Europe
- 5.3.4. Middle East & Africa
- 5.3.5. Asia Pacific
- 5.1. Market Analysis, Insights and Forecast - by Application
- 6. North America Subsea Cables for Offshore Wind Analysis, Insights and Forecast, 2020-2032
- 6.1. Market Analysis, Insights and Forecast - by Application
- 6.1.1. Fixed Wind Turbines (Shallower Waters)
- 6.1.2. Floating Wind Turbines (Deeper Waters)
- 6.2. Market Analysis, Insights and Forecast - by Types
- 6.2.1. Single Core Cable
- 6.2.2. Multicore Cable
- 6.1. Market Analysis, Insights and Forecast - by Application
- 7. South America Subsea Cables for Offshore Wind Analysis, Insights and Forecast, 2020-2032
- 7.1. Market Analysis, Insights and Forecast - by Application
- 7.1.1. Fixed Wind Turbines (Shallower Waters)
- 7.1.2. Floating Wind Turbines (Deeper Waters)
- 7.2. Market Analysis, Insights and Forecast - by Types
- 7.2.1. Single Core Cable
- 7.2.2. Multicore Cable
- 7.1. Market Analysis, Insights and Forecast - by Application
- 8. Europe Subsea Cables for Offshore Wind Analysis, Insights and Forecast, 2020-2032
- 8.1. Market Analysis, Insights and Forecast - by Application
- 8.1.1. Fixed Wind Turbines (Shallower Waters)
- 8.1.2. Floating Wind Turbines (Deeper Waters)
- 8.2. Market Analysis, Insights and Forecast - by Types
- 8.2.1. Single Core Cable
- 8.2.2. Multicore Cable
- 8.1. Market Analysis, Insights and Forecast - by Application
- 9. Middle East & Africa Subsea Cables for Offshore Wind Analysis, Insights and Forecast, 2020-2032
- 9.1. Market Analysis, Insights and Forecast - by Application
- 9.1.1. Fixed Wind Turbines (Shallower Waters)
- 9.1.2. Floating Wind Turbines (Deeper Waters)
- 9.2. Market Analysis, Insights and Forecast - by Types
- 9.2.1. Single Core Cable
- 9.2.2. Multicore Cable
- 9.1. Market Analysis, Insights and Forecast - by Application
- 10. Asia Pacific Subsea Cables for Offshore Wind Analysis, Insights and Forecast, 2020-2032
- 10.1. Market Analysis, Insights and Forecast - by Application
- 10.1.1. Fixed Wind Turbines (Shallower Waters)
- 10.1.2. Floating Wind Turbines (Deeper Waters)
- 10.2. Market Analysis, Insights and Forecast - by Types
- 10.2.1. Single Core Cable
- 10.2.2. Multicore Cable
- 10.1. Market Analysis, Insights and Forecast - by Application
- 11. Competitive Analysis
- 11.1. Global Market Share Analysis 2025
- 11.2. Company Profiles
- 11.2.1 ABB
- 11.2.1.1. Overview
- 11.2.1.2. Products
- 11.2.1.3. SWOT Analysis
- 11.2.1.4. Recent Developments
- 11.2.1.5. Financials (Based on Availability)
- 11.2.2 DNV
- 11.2.2.1. Overview
- 11.2.2.2. Products
- 11.2.2.3. SWOT Analysis
- 11.2.2.4. Recent Developments
- 11.2.2.5. Financials (Based on Availability)
- 11.2.3 Furukawa Electric
- 11.2.3.1. Overview
- 11.2.3.2. Products
- 11.2.3.3. SWOT Analysis
- 11.2.3.4. Recent Developments
- 11.2.3.5. Financials (Based on Availability)
- 11.2.4 Hanhe Cable
- 11.2.4.1. Overview
- 11.2.4.2. Products
- 11.2.4.3. SWOT Analysis
- 11.2.4.4. Recent Developments
- 11.2.4.5. Financials (Based on Availability)
- 11.2.5 Hellenic Cables
- 11.2.5.1. Overview
- 11.2.5.2. Products
- 11.2.5.3. SWOT Analysis
- 11.2.5.4. Recent Developments
- 11.2.5.5. Financials (Based on Availability)
- 11.2.6 HENGTONG
- 11.2.6.1. Overview
- 11.2.6.2. Products
- 11.2.6.3. SWOT Analysis
- 11.2.6.4. Recent Developments
- 11.2.6.5. Financials (Based on Availability)
- 11.2.7 JDR Cable Systems
- 11.2.7.1. Overview
- 11.2.7.2. Products
- 11.2.7.3. SWOT Analysis
- 11.2.7.4. Recent Developments
- 11.2.7.5. Financials (Based on Availability)
- 11.2.8 LS Cable
- 11.2.8.1. Overview
- 11.2.8.2. Products
- 11.2.8.3. SWOT Analysis
- 11.2.8.4. Recent Developments
- 11.2.8.5. Financials (Based on Availability)
- 11.2.9 Nexans
- 11.2.9.1. Overview
- 11.2.9.2. Products
- 11.2.9.3. SWOT Analysis
- 11.2.9.4. Recent Developments
- 11.2.9.5. Financials (Based on Availability)
- 11.2.10 ZTT
- 11.2.10.1. Overview
- 11.2.10.2. Products
- 11.2.10.3. SWOT Analysis
- 11.2.10.4. Recent Developments
- 11.2.10.5. Financials (Based on Availability)
- 11.2.11 NKT Cable
- 11.2.11.1. Overview
- 11.2.11.2. Products
- 11.2.11.3. SWOT Analysis
- 11.2.11.4. Recent Developments
- 11.2.11.5. Financials (Based on Availability)
- 11.2.12 Orient Cable
- 11.2.12.1. Overview
- 11.2.12.2. Products
- 11.2.12.3. SWOT Analysis
- 11.2.12.4. Recent Developments
- 11.2.12.5. Financials (Based on Availability)
- 11.2.13 Prysmian
- 11.2.13.1. Overview
- 11.2.13.2. Products
- 11.2.13.3. SWOT Analysis
- 11.2.13.4. Recent Developments
- 11.2.13.5. Financials (Based on Availability)
- 11.2.14 SEI
- 11.2.14.1. Overview
- 11.2.14.2. Products
- 11.2.14.3. SWOT Analysis
- 11.2.14.4. Recent Developments
- 11.2.14.5. Financials (Based on Availability)
- 11.2.1 ABB
List of Figures
- Figure 1: Global Subsea Cables for Offshore Wind Revenue Breakdown (billion, %) by Region 2025 & 2033
- Figure 2: Global Subsea Cables for Offshore Wind Volume Breakdown (K, %) by Region 2025 & 2033
- Figure 3: North America Subsea Cables for Offshore Wind Revenue (billion), by Application 2025 & 2033
- Figure 4: North America Subsea Cables for Offshore Wind Volume (K), by Application 2025 & 2033
- Figure 5: North America Subsea Cables for Offshore Wind Revenue Share (%), by Application 2025 & 2033
- Figure 6: North America Subsea Cables for Offshore Wind Volume Share (%), by Application 2025 & 2033
- Figure 7: North America Subsea Cables for Offshore Wind Revenue (billion), by Types 2025 & 2033
- Figure 8: North America Subsea Cables for Offshore Wind Volume (K), by Types 2025 & 2033
- Figure 9: North America Subsea Cables for Offshore Wind Revenue Share (%), by Types 2025 & 2033
- Figure 10: North America Subsea Cables for Offshore Wind Volume Share (%), by Types 2025 & 2033
- Figure 11: North America Subsea Cables for Offshore Wind Revenue (billion), by Country 2025 & 2033
- Figure 12: North America Subsea Cables for Offshore Wind Volume (K), by Country 2025 & 2033
- Figure 13: North America Subsea Cables for Offshore Wind Revenue Share (%), by Country 2025 & 2033
- Figure 14: North America Subsea Cables for Offshore Wind Volume Share (%), by Country 2025 & 2033
- Figure 15: South America Subsea Cables for Offshore Wind Revenue (billion), by Application 2025 & 2033
- Figure 16: South America Subsea Cables for Offshore Wind Volume (K), by Application 2025 & 2033
- Figure 17: South America Subsea Cables for Offshore Wind Revenue Share (%), by Application 2025 & 2033
- Figure 18: South America Subsea Cables for Offshore Wind Volume Share (%), by Application 2025 & 2033
- Figure 19: South America Subsea Cables for Offshore Wind Revenue (billion), by Types 2025 & 2033
- Figure 20: South America Subsea Cables for Offshore Wind Volume (K), by Types 2025 & 2033
- Figure 21: South America Subsea Cables for Offshore Wind Revenue Share (%), by Types 2025 & 2033
- Figure 22: South America Subsea Cables for Offshore Wind Volume Share (%), by Types 2025 & 2033
- Figure 23: South America Subsea Cables for Offshore Wind Revenue (billion), by Country 2025 & 2033
- Figure 24: South America Subsea Cables for Offshore Wind Volume (K), by Country 2025 & 2033
- Figure 25: South America Subsea Cables for Offshore Wind Revenue Share (%), by Country 2025 & 2033
- Figure 26: South America Subsea Cables for Offshore Wind Volume Share (%), by Country 2025 & 2033
- Figure 27: Europe Subsea Cables for Offshore Wind Revenue (billion), by Application 2025 & 2033
- Figure 28: Europe Subsea Cables for Offshore Wind Volume (K), by Application 2025 & 2033
- Figure 29: Europe Subsea Cables for Offshore Wind Revenue Share (%), by Application 2025 & 2033
- Figure 30: Europe Subsea Cables for Offshore Wind Volume Share (%), by Application 2025 & 2033
- Figure 31: Europe Subsea Cables for Offshore Wind Revenue (billion), by Types 2025 & 2033
- Figure 32: Europe Subsea Cables for Offshore Wind Volume (K), by Types 2025 & 2033
- Figure 33: Europe Subsea Cables for Offshore Wind Revenue Share (%), by Types 2025 & 2033
- Figure 34: Europe Subsea Cables for Offshore Wind Volume Share (%), by Types 2025 & 2033
- Figure 35: Europe Subsea Cables for Offshore Wind Revenue (billion), by Country 2025 & 2033
- Figure 36: Europe Subsea Cables for Offshore Wind Volume (K), by Country 2025 & 2033
- Figure 37: Europe Subsea Cables for Offshore Wind Revenue Share (%), by Country 2025 & 2033
- Figure 38: Europe Subsea Cables for Offshore Wind Volume Share (%), by Country 2025 & 2033
- Figure 39: Middle East & Africa Subsea Cables for Offshore Wind Revenue (billion), by Application 2025 & 2033
- Figure 40: Middle East & Africa Subsea Cables for Offshore Wind Volume (K), by Application 2025 & 2033
- Figure 41: Middle East & Africa Subsea Cables for Offshore Wind Revenue Share (%), by Application 2025 & 2033
- Figure 42: Middle East & Africa Subsea Cables for Offshore Wind Volume Share (%), by Application 2025 & 2033
- Figure 43: Middle East & Africa Subsea Cables for Offshore Wind Revenue (billion), by Types 2025 & 2033
- Figure 44: Middle East & Africa Subsea Cables for Offshore Wind Volume (K), by Types 2025 & 2033
- Figure 45: Middle East & Africa Subsea Cables for Offshore Wind Revenue Share (%), by Types 2025 & 2033
- Figure 46: Middle East & Africa Subsea Cables for Offshore Wind Volume Share (%), by Types 2025 & 2033
- Figure 47: Middle East & Africa Subsea Cables for Offshore Wind Revenue (billion), by Country 2025 & 2033
- Figure 48: Middle East & Africa Subsea Cables for Offshore Wind Volume (K), by Country 2025 & 2033
- Figure 49: Middle East & Africa Subsea Cables for Offshore Wind Revenue Share (%), by Country 2025 & 2033
- Figure 50: Middle East & Africa Subsea Cables for Offshore Wind Volume Share (%), by Country 2025 & 2033
- Figure 51: Asia Pacific Subsea Cables for Offshore Wind Revenue (billion), by Application 2025 & 2033
- Figure 52: Asia Pacific Subsea Cables for Offshore Wind Volume (K), by Application 2025 & 2033
- Figure 53: Asia Pacific Subsea Cables for Offshore Wind Revenue Share (%), by Application 2025 & 2033
- Figure 54: Asia Pacific Subsea Cables for Offshore Wind Volume Share (%), by Application 2025 & 2033
- Figure 55: Asia Pacific Subsea Cables for Offshore Wind Revenue (billion), by Types 2025 & 2033
- Figure 56: Asia Pacific Subsea Cables for Offshore Wind Volume (K), by Types 2025 & 2033
- Figure 57: Asia Pacific Subsea Cables for Offshore Wind Revenue Share (%), by Types 2025 & 2033
- Figure 58: Asia Pacific Subsea Cables for Offshore Wind Volume Share (%), by Types 2025 & 2033
- Figure 59: Asia Pacific Subsea Cables for Offshore Wind Revenue (billion), by Country 2025 & 2033
- Figure 60: Asia Pacific Subsea Cables for Offshore Wind Volume (K), by Country 2025 & 2033
- Figure 61: Asia Pacific Subsea Cables for Offshore Wind Revenue Share (%), by Country 2025 & 2033
- Figure 62: Asia Pacific Subsea Cables for Offshore Wind Volume Share (%), by Country 2025 & 2033
List of Tables
- Table 1: Global Subsea Cables for Offshore Wind Revenue billion Forecast, by Application 2020 & 2033
- Table 2: Global Subsea Cables for Offshore Wind Volume K Forecast, by Application 2020 & 2033
- Table 3: Global Subsea Cables for Offshore Wind Revenue billion Forecast, by Types 2020 & 2033
- Table 4: Global Subsea Cables for Offshore Wind Volume K Forecast, by Types 2020 & 2033
- Table 5: Global Subsea Cables for Offshore Wind Revenue billion Forecast, by Region 2020 & 2033
- Table 6: Global Subsea Cables for Offshore Wind Volume K Forecast, by Region 2020 & 2033
- Table 7: Global Subsea Cables for Offshore Wind Revenue billion Forecast, by Application 2020 & 2033
- Table 8: Global Subsea Cables for Offshore Wind Volume K Forecast, by Application 2020 & 2033
- Table 9: Global Subsea Cables for Offshore Wind Revenue billion Forecast, by Types 2020 & 2033
- Table 10: Global Subsea Cables for Offshore Wind Volume K Forecast, by Types 2020 & 2033
- Table 11: Global Subsea Cables for Offshore Wind Revenue billion Forecast, by Country 2020 & 2033
- Table 12: Global Subsea Cables for Offshore Wind Volume K Forecast, by Country 2020 & 2033
- Table 13: United States Subsea Cables for Offshore Wind Revenue (billion) Forecast, by Application 2020 & 2033
- Table 14: United States Subsea Cables for Offshore Wind Volume (K) Forecast, by Application 2020 & 2033
- Table 15: Canada Subsea Cables for Offshore Wind Revenue (billion) Forecast, by Application 2020 & 2033
- Table 16: Canada Subsea Cables for Offshore Wind Volume (K) Forecast, by Application 2020 & 2033
- Table 17: Mexico Subsea Cables for Offshore Wind Revenue (billion) Forecast, by Application 2020 & 2033
- Table 18: Mexico Subsea Cables for Offshore Wind Volume (K) Forecast, by Application 2020 & 2033
- Table 19: Global Subsea Cables for Offshore Wind Revenue billion Forecast, by Application 2020 & 2033
- Table 20: Global Subsea Cables for Offshore Wind Volume K Forecast, by Application 2020 & 2033
- Table 21: Global Subsea Cables for Offshore Wind Revenue billion Forecast, by Types 2020 & 2033
- Table 22: Global Subsea Cables for Offshore Wind Volume K Forecast, by Types 2020 & 2033
- Table 23: Global Subsea Cables for Offshore Wind Revenue billion Forecast, by Country 2020 & 2033
- Table 24: Global Subsea Cables for Offshore Wind Volume K Forecast, by Country 2020 & 2033
- Table 25: Brazil Subsea Cables for Offshore Wind Revenue (billion) Forecast, by Application 2020 & 2033
- Table 26: Brazil Subsea Cables for Offshore Wind Volume (K) Forecast, by Application 2020 & 2033
- Table 27: Argentina Subsea Cables for Offshore Wind Revenue (billion) Forecast, by Application 2020 & 2033
- Table 28: Argentina Subsea Cables for Offshore Wind Volume (K) Forecast, by Application 2020 & 2033
- Table 29: Rest of South America Subsea Cables for Offshore Wind Revenue (billion) Forecast, by Application 2020 & 2033
- Table 30: Rest of South America Subsea Cables for Offshore Wind Volume (K) Forecast, by Application 2020 & 2033
- Table 31: Global Subsea Cables for Offshore Wind Revenue billion Forecast, by Application 2020 & 2033
- Table 32: Global Subsea Cables for Offshore Wind Volume K Forecast, by Application 2020 & 2033
- Table 33: Global Subsea Cables for Offshore Wind Revenue billion Forecast, by Types 2020 & 2033
- Table 34: Global Subsea Cables for Offshore Wind Volume K Forecast, by Types 2020 & 2033
- Table 35: Global Subsea Cables for Offshore Wind Revenue billion Forecast, by Country 2020 & 2033
- Table 36: Global Subsea Cables for Offshore Wind Volume K Forecast, by Country 2020 & 2033
- Table 37: United Kingdom Subsea Cables for Offshore Wind Revenue (billion) Forecast, by Application 2020 & 2033
- Table 38: United Kingdom Subsea Cables for Offshore Wind Volume (K) Forecast, by Application 2020 & 2033
- Table 39: Germany Subsea Cables for Offshore Wind Revenue (billion) Forecast, by Application 2020 & 2033
- Table 40: Germany Subsea Cables for Offshore Wind Volume (K) Forecast, by Application 2020 & 2033
- Table 41: France Subsea Cables for Offshore Wind Revenue (billion) Forecast, by Application 2020 & 2033
- Table 42: France Subsea Cables for Offshore Wind Volume (K) Forecast, by Application 2020 & 2033
- Table 43: Italy Subsea Cables for Offshore Wind Revenue (billion) Forecast, by Application 2020 & 2033
- Table 44: Italy Subsea Cables for Offshore Wind Volume (K) Forecast, by Application 2020 & 2033
- Table 45: Spain Subsea Cables for Offshore Wind Revenue (billion) Forecast, by Application 2020 & 2033
- Table 46: Spain Subsea Cables for Offshore Wind Volume (K) Forecast, by Application 2020 & 2033
- Table 47: Russia Subsea Cables for Offshore Wind Revenue (billion) Forecast, by Application 2020 & 2033
- Table 48: Russia Subsea Cables for Offshore Wind Volume (K) Forecast, by Application 2020 & 2033
- Table 49: Benelux Subsea Cables for Offshore Wind Revenue (billion) Forecast, by Application 2020 & 2033
- Table 50: Benelux Subsea Cables for Offshore Wind Volume (K) Forecast, by Application 2020 & 2033
- Table 51: Nordics Subsea Cables for Offshore Wind Revenue (billion) Forecast, by Application 2020 & 2033
- Table 52: Nordics Subsea Cables for Offshore Wind Volume (K) Forecast, by Application 2020 & 2033
- Table 53: Rest of Europe Subsea Cables for Offshore Wind Revenue (billion) Forecast, by Application 2020 & 2033
- Table 54: Rest of Europe Subsea Cables for Offshore Wind Volume (K) Forecast, by Application 2020 & 2033
- Table 55: Global Subsea Cables for Offshore Wind Revenue billion Forecast, by Application 2020 & 2033
- Table 56: Global Subsea Cables for Offshore Wind Volume K Forecast, by Application 2020 & 2033
- Table 57: Global Subsea Cables for Offshore Wind Revenue billion Forecast, by Types 2020 & 2033
- Table 58: Global Subsea Cables for Offshore Wind Volume K Forecast, by Types 2020 & 2033
- Table 59: Global Subsea Cables for Offshore Wind Revenue billion Forecast, by Country 2020 & 2033
- Table 60: Global Subsea Cables for Offshore Wind Volume K Forecast, by Country 2020 & 2033
- Table 61: Turkey Subsea Cables for Offshore Wind Revenue (billion) Forecast, by Application 2020 & 2033
- Table 62: Turkey Subsea Cables for Offshore Wind Volume (K) Forecast, by Application 2020 & 2033
- Table 63: Israel Subsea Cables for Offshore Wind Revenue (billion) Forecast, by Application 2020 & 2033
- Table 64: Israel Subsea Cables for Offshore Wind Volume (K) Forecast, by Application 2020 & 2033
- Table 65: GCC Subsea Cables for Offshore Wind Revenue (billion) Forecast, by Application 2020 & 2033
- Table 66: GCC Subsea Cables for Offshore Wind Volume (K) Forecast, by Application 2020 & 2033
- Table 67: North Africa Subsea Cables for Offshore Wind Revenue (billion) Forecast, by Application 2020 & 2033
- Table 68: North Africa Subsea Cables for Offshore Wind Volume (K) Forecast, by Application 2020 & 2033
- Table 69: South Africa Subsea Cables for Offshore Wind Revenue (billion) Forecast, by Application 2020 & 2033
- Table 70: South Africa Subsea Cables for Offshore Wind Volume (K) Forecast, by Application 2020 & 2033
- Table 71: Rest of Middle East & Africa Subsea Cables for Offshore Wind Revenue (billion) Forecast, by Application 2020 & 2033
- Table 72: Rest of Middle East & Africa Subsea Cables for Offshore Wind Volume (K) Forecast, by Application 2020 & 2033
- Table 73: Global Subsea Cables for Offshore Wind Revenue billion Forecast, by Application 2020 & 2033
- Table 74: Global Subsea Cables for Offshore Wind Volume K Forecast, by Application 2020 & 2033
- Table 75: Global Subsea Cables for Offshore Wind Revenue billion Forecast, by Types 2020 & 2033
- Table 76: Global Subsea Cables for Offshore Wind Volume K Forecast, by Types 2020 & 2033
- Table 77: Global Subsea Cables for Offshore Wind Revenue billion Forecast, by Country 2020 & 2033
- Table 78: Global Subsea Cables for Offshore Wind Volume K Forecast, by Country 2020 & 2033
- Table 79: China Subsea Cables for Offshore Wind Revenue (billion) Forecast, by Application 2020 & 2033
- Table 80: China Subsea Cables for Offshore Wind Volume (K) Forecast, by Application 2020 & 2033
- Table 81: India Subsea Cables for Offshore Wind Revenue (billion) Forecast, by Application 2020 & 2033
- Table 82: India Subsea Cables for Offshore Wind Volume (K) Forecast, by Application 2020 & 2033
- Table 83: Japan Subsea Cables for Offshore Wind Revenue (billion) Forecast, by Application 2020 & 2033
- Table 84: Japan Subsea Cables for Offshore Wind Volume (K) Forecast, by Application 2020 & 2033
- Table 85: South Korea Subsea Cables for Offshore Wind Revenue (billion) Forecast, by Application 2020 & 2033
- Table 86: South Korea Subsea Cables for Offshore Wind Volume (K) Forecast, by Application 2020 & 2033
- Table 87: ASEAN Subsea Cables for Offshore Wind Revenue (billion) Forecast, by Application 2020 & 2033
- Table 88: ASEAN Subsea Cables for Offshore Wind Volume (K) Forecast, by Application 2020 & 2033
- Table 89: Oceania Subsea Cables for Offshore Wind Revenue (billion) Forecast, by Application 2020 & 2033
- Table 90: Oceania Subsea Cables for Offshore Wind Volume (K) Forecast, by Application 2020 & 2033
- Table 91: Rest of Asia Pacific Subsea Cables for Offshore Wind Revenue (billion) Forecast, by Application 2020 & 2033
- Table 92: Rest of Asia Pacific Subsea Cables for Offshore Wind Volume (K) Forecast, by Application 2020 & 2033
Frequently Asked Questions
1. What is the projected Compound Annual Growth Rate (CAGR) of the Subsea Cables for Offshore Wind?
The projected CAGR is approximately 19.05%.
2. Which companies are prominent players in the Subsea Cables for Offshore Wind?
Key companies in the market include ABB, DNV, Furukawa Electric, Hanhe Cable, Hellenic Cables, HENGTONG, JDR Cable Systems, LS Cable, Nexans, ZTT, NKT Cable, Orient Cable, Prysmian, SEI.
3. What are the main segments of the Subsea Cables for Offshore Wind?
The market segments include Application, Types.
4. Can you provide details about the market size?
The market size is estimated to be USD 3.554 billion as of 2022.
5. What are some drivers contributing to market growth?
N/A
6. What are the notable trends driving market growth?
N/A
7. Are there any restraints impacting market growth?
N/A
8. Can you provide examples of recent developments in the market?
N/A
9. What pricing options are available for accessing the report?
Pricing options include single-user, multi-user, and enterprise licenses priced at USD 3350.00, USD 5025.00, and USD 6700.00 respectively.
10. Is the market size provided in terms of value or volume?
The market size is provided in terms of value, measured in billion and volume, measured in K.
11. Are there any specific market keywords associated with the report?
Yes, the market keyword associated with the report is "Subsea Cables for Offshore Wind," which aids in identifying and referencing the specific market segment covered.
12. How do I determine which pricing option suits my needs best?
The pricing options vary based on user requirements and access needs. Individual users may opt for single-user licenses, while businesses requiring broader access may choose multi-user or enterprise licenses for cost-effective access to the report.
13. Are there any additional resources or data provided in the Subsea Cables for Offshore Wind report?
While the report offers comprehensive insights, it's advisable to review the specific contents or supplementary materials provided to ascertain if additional resources or data are available.
14. How can I stay updated on further developments or reports in the Subsea Cables for Offshore Wind?
To stay informed about further developments, trends, and reports in the Subsea Cables for Offshore Wind, consider subscribing to industry newsletters, following relevant companies and organizations, or regularly checking reputable industry news sources and publications.
Methodology
Step 1 - Identification of Relevant Samples Size from Population Database


Step 2 - Approaches for Defining Global Market Size (Value, Volume* & Price*)

Note*: In applicable scenarios
Step 3 - Data Sources
Primary Research
- Web Analytics
- Survey Reports
- Research Institute
- Latest Research Reports
- Opinion Leaders
Secondary Research
- Annual Reports
- White Paper
- Latest Press Release
- Industry Association
- Paid Database
- Investor Presentations

Step 4 - Data Triangulation
Involves using different sources of information in order to increase the validity of a study
These sources are likely to be stakeholders in a program - participants, other researchers, program staff, other community members, and so on.
Then we put all data in single framework & apply various statistical tools to find out the dynamic on the market.
During the analysis stage, feedback from the stakeholder groups would be compared to determine areas of agreement as well as areas of divergence