

Key Insights
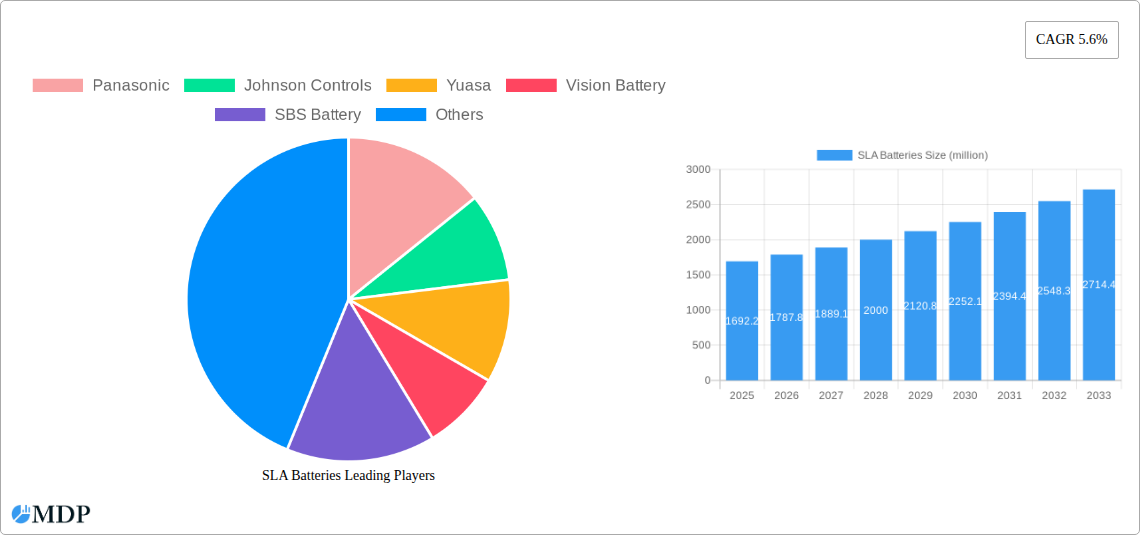
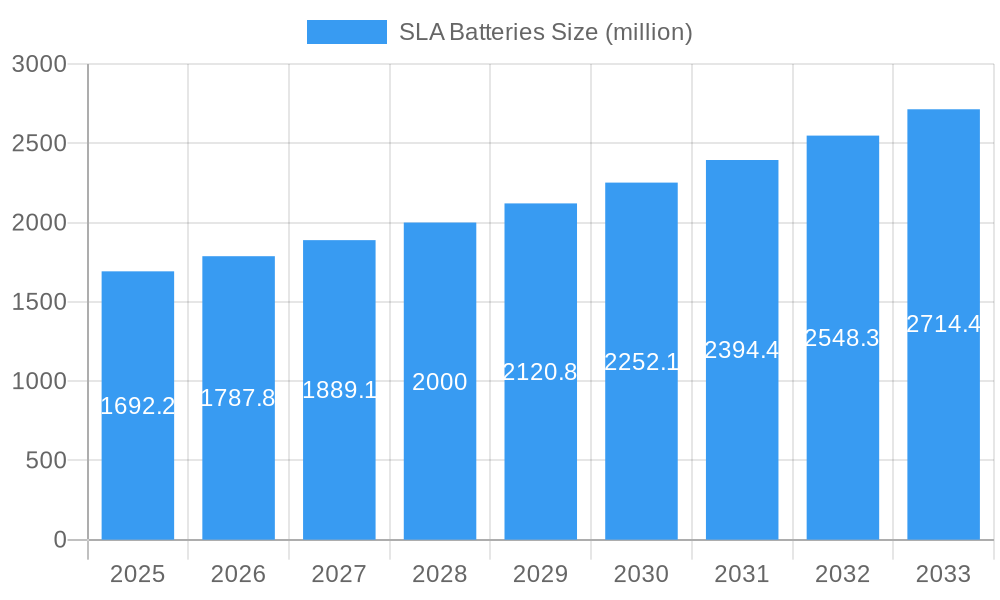
The global Sealed Lead-Acid (SLA) Battery market is projected to reach a substantial USD 1692.2 million by 2025, demonstrating a healthy Compound Annual Growth Rate (CAGR) of 5.6% over the forecast period of 2025-2033. This robust expansion is underpinned by the increasing demand for reliable backup power solutions across various critical sectors. The security systems segment, in particular, is a significant growth driver, fueled by heightened global security concerns and the proliferation of advanced surveillance and access control technologies. Similarly, the emergency lighting market is benefiting from stringent safety regulations and the ongoing construction of new infrastructure worldwide, necessitating dependable power for illumination during outages. Consumer electronics also contribute to market growth, as SLA batteries continue to be a cost-effective and widely adopted power source for numerous portable devices and uninterruptible power supplies (UPS) for home and office use.
SLA Batteries Market Size (In Billion)
The market is characterized by several key trends that are shaping its trajectory. Advancements in SLA battery technology, leading to improved performance, longer lifespan, and enhanced safety features, are critical. Furthermore, the growing adoption of deep-cycle and gel SLA batteries, offering superior performance in applications requiring frequent discharge and recharge cycles like renewable energy storage and electric mobility, is a notable trend. While the market exhibits strong growth, certain restraints exist, including the increasing competition from alternative battery technologies such as Lithium-ion batteries, which offer higher energy density and lighter weight. However, the established cost-effectiveness and proven reliability of SLA batteries in many core applications are expected to mitigate the impact of these alternatives. Geographically, Asia Pacific, led by China and India, is expected to be a dominant region due to rapid industrialization, infrastructure development, and a large consumer base.
SLA Batteries Company Market Share
Global SLA Batteries Market Insights: A Comprehensive Analysis and Forecast (2019-2033)
This in-depth report provides a definitive analysis of the global Sealed Lead-Acid (SLA) batteries market, covering historical performance, current dynamics, and future projections. Focusing on key industry players like Panasonic, Johnson Controls, Yuasa, Vision Battery, SBS Battery, Fiamm, MCA, IBT Battery, Southern Battery, Exide Technologies, CSB Battery, Atlasbx, Amara Raja, C&D Technologies, Trojan, NorthStar Battery, Midac Power, and ACDelco, the report delves into critical segments including Emergency Lighting, Security Systems, Back-Ups, Consumer Electronics, and Others. It also examines the market by SLA battery types: General Purpose SLA AGM Batteries, Deep Cycle SLA AGM Batteries, Gel SLA Batteries, and UPS SLA AGM Batteries. With a comprehensive study period from 2019 to 2033, a base year of 2025, and a forecast period spanning 2025 to 2033, this report is an indispensable resource for industry stakeholders seeking to understand market concentration, innovation drivers, regulatory landscapes, product substitutes, end-user trends, and strategic growth accelerators.
SLA Batteries Market Dynamics & Concentration
The SLA batteries market exhibits a moderate to high concentration, with established players like Panasonic and Johnson Controls holding significant market share, estimated to be over 25% combined in the base year 2025. Innovation drivers, such as advancements in battery chemistry for improved cycle life and higher energy density, are propelling market growth. Regulatory frameworks, particularly those related to environmental impact and recycling of lead-acid batteries, are shaping manufacturing processes and product development, with an estimated 30% of companies investing in eco-friendly solutions. Product substitutes, including lithium-ion batteries, present a growing challenge, particularly in high-performance applications, and their market penetration is predicted to reach 20% by 2033. End-user trends indicate a rising demand for reliable and long-lasting power solutions in critical infrastructure like security systems and emergency lighting, contributing to a projected 15% growth in these segments. Mergers and acquisitions (M&A) activities are expected to increase, with an estimated 10-15 M&A deals anticipated during the forecast period, as larger companies seek to consolidate market presence and acquire innovative technologies.
SLA Batteries Industry Trends & Analysis
The global SLA batteries market is projected to witness robust growth, driven by a confluence of technological advancements and increasing demand across diverse applications. The Compound Annual Growth Rate (CAGR) is estimated at XX% during the forecast period (2025-2033), reflecting a healthy expansion trajectory. Key growth drivers include the escalating adoption of uninterruptible power supply (UPS) systems in data centers and IT infrastructure, as well as the persistent demand for reliable backup power in telecommunications and healthcare sectors. Technological disruptions are primarily centered on enhancing the performance characteristics of SLA batteries, such as extended lifespan, faster charging capabilities, and improved thermal management. Consumer preferences are leaning towards more compact, lightweight, and maintenance-free battery solutions, prompting manufacturers to innovate within the existing SLA framework. The competitive landscape is characterized by intense rivalry among leading manufacturers, with a focus on cost optimization and product differentiation. Market penetration of SLA batteries, while mature in some traditional applications, continues to expand into emerging markets and new use cases. The increasing global focus on renewable energy integration and grid stabilization further bolsters the demand for efficient energy storage solutions like SLA batteries. Furthermore, the development of advanced manufacturing techniques, including automated production lines and enhanced quality control measures, contributes to improved product consistency and cost-effectiveness, solidifying SLA batteries' position in the energy storage market. The cyclical nature of battery replacement in various sectors also ensures a steady demand stream, underpinning the market's resilience.
Leading Markets & Segments in SLA Batteries
The Asia-Pacific region is poised to emerge as the dominant market for SLA batteries, driven by rapid industrialization, expanding IT infrastructure, and growing consumer electronics adoption in countries like China and India. Within this region, countries with strong manufacturing bases and significant investments in telecommunications and renewable energy projects are expected to lead the demand.
Key Dominant Segments:
- Application: Back-Ups
- Economic Policies: Government initiatives promoting digital infrastructure and cybersecurity are fueling the demand for robust backup power solutions in data centers and IT facilities.
- Infrastructure Development: The continuous expansion of telecommunications networks, including 5G deployment, necessitates reliable backup power for base stations.
- Consumer Electronics: The widespread use of UPS systems for personal computers and home entertainment devices contributes significantly to this segment's growth.
- Types: UPS SLA AGM Batteries
- Technological Advancements: Innovations in AGM (Absorbent Glass Mat) technology have led to batteries with higher energy density and longer service life, making them ideal for UPS applications.
- Market Penetration: UPS SLA AGM batteries are the preferred choice for many critical applications due to their excellent performance and cost-effectiveness compared to alternatives.
- Demand from Enterprises: Businesses across sectors, including finance, healthcare, and manufacturing, rely heavily on UPS systems to ensure uninterrupted operations, driving demand for specialized UPS SLA AGM batteries.
The "Emergency Lighting" and "Security Systems" applications are also projected to witness substantial growth, particularly in developed nations due to stringent safety regulations and the increasing focus on public safety. The "General Purpose SLA AGM Batteries" segment will continue to hold a significant share due to its versatility and cost-effectiveness across a broad range of applications.
SLA Batteries Product Developments
Recent product developments in the SLA batteries sector are focused on enhancing performance and expanding applications. Manufacturers are introducing batteries with improved cycle life, faster charging capabilities, and extended operational temperatures. Innovations in materials science are enabling higher energy density and reduced internal resistance, leading to more efficient power delivery. Competitive advantages are being gained through the development of specialized battery designs for demanding environments, such as high vibration resistance and enhanced safety features. These advancements cater to evolving end-user needs for reliable and long-lasting power solutions in critical infrastructure and consumer electronics.
Key Drivers of SLA Batteries Growth
The SLA batteries market is propelled by several key growth drivers. The relentless expansion of IT infrastructure, including data centers and cloud computing services, necessitates a stable and reliable power supply, making UPS systems and their associated SLA batteries indispensable. Furthermore, the increasing adoption of renewable energy sources, such as solar and wind power, requires efficient energy storage solutions for grid stabilization and power management, where SLA batteries play a crucial role. Government initiatives promoting energy efficiency and backup power infrastructure in critical sectors like telecommunications, healthcare, and emergency services also significantly contribute to market growth. The cost-effectiveness and proven reliability of SLA batteries compared to some newer technologies ensure their continued relevance, particularly in price-sensitive markets and applications where long-term stability is paramount.
Challenges in the SLA Batteries Market
Despite the positive growth trajectory, the SLA batteries market faces several challenges. The primary restraint is the growing competition from alternative battery technologies, particularly lithium-ion batteries, which offer higher energy density and lighter weight, posing a threat in certain high-performance applications. Regulatory hurdles related to the disposal and recycling of lead-acid batteries, due to their lead content, can increase operational costs for manufacturers and end-users, although industry efforts are underway to improve recycling rates, with an estimated 95% of lead being recycled. Supply chain vulnerabilities, including fluctuations in the price of lead and other raw materials, can impact manufacturing costs and product pricing, potentially affecting market competitiveness. Intense competition among established players also leads to price pressures, necessitating continuous innovation and cost optimization strategies to maintain market share.
Emerging Opportunities in SLA Batteries
Emerging opportunities in the SLA batteries market are centered around technological breakthroughs and strategic market expansion. The development of advanced SLA battery chemistries that further enhance cycle life and energy efficiency presents a significant opportunity, particularly for applications requiring frequent deep discharge cycles. Strategic partnerships between SLA battery manufacturers and providers of renewable energy systems, electric vehicles, and critical infrastructure solutions can unlock new markets and revenue streams. Furthermore, the growing demand for reliable backup power in emerging economies and underserved regions presents substantial market expansion potential. Investments in R&D focused on miniaturization and improved thermal management can lead to new applications in portable electronics and IoT devices, broadening the market reach of SLA batteries.
Leading Players in the SLA Batteries Sector
- Panasonic
- Johnson Controls
- Yuasa
- Vision Battery
- SBS Battery
- Fiamm
- MCA
- IBT Battery
- Southern Battery
- Exide Technologies
- CSB Battery
- Atlasbx
- Amara Raja
- C&D Technologies
- Trojan
- NorthStar Battery
- Midac Power
- ACDelco
Key Milestones in SLA Batteries Industry
- 2019: Introduction of enhanced AGM battery technologies offering improved cycle life and faster charging.
- 2020: Increased focus on battery recycling initiatives and sustainable manufacturing processes across major players.
- 2021: Launch of specialized SLA batteries with higher temperature resistance for demanding industrial applications.
- 2022: Strategic partnerships formed to integrate SLA batteries with emerging renewable energy storage solutions.
- 2023: Advancements in battery management systems (BMS) for SLA batteries to optimize performance and lifespan.
- 2024: Continued R&D investment in developing more energy-dense and compact SLA battery designs.
Strategic Outlook for SLA Batteries Market
The strategic outlook for the SLA batteries market remains positive, driven by sustained demand in critical infrastructure and evolving technological advancements. Growth accelerators include the ongoing digital transformation, the expansion of telecommunications networks, and the increasing need for reliable backup power solutions across various industries. Manufacturers are expected to focus on product differentiation through enhanced performance characteristics, cost optimization, and improved sustainability practices. Strategic opportunities lie in capitalizing on the demand for energy storage in emerging markets and forging stronger collaborations with key industry stakeholders to integrate SLA batteries into a wider array of applications. The market is poised for steady growth, underpinned by its inherent reliability and cost-effectiveness.
SLA Batteries Segmentation
-
1. Application
- 1.1. Emergency Lighting
- 1.2. Security Systems
- 1.3. Back-Ups
- 1.4. Consumer Electronics
- 1.5. Others
-
2. Types
- 2.1. General Purpose SLA AGM Batteries
- 2.2. Deep Cycle SLA AGM Batteries
- 2.3. Gel SLA Batteries
- 2.4. UPS SLA AGM Batteries
SLA Batteries Segmentation By Geography
-
1. North America
- 1.1. United States
- 1.2. Canada
- 1.3. Mexico
-
2. South America
- 2.1. Brazil
- 2.2. Argentina
- 2.3. Rest of South America
-
3. Europe
- 3.1. United Kingdom
- 3.2. Germany
- 3.3. France
- 3.4. Italy
- 3.5. Spain
- 3.6. Russia
- 3.7. Benelux
- 3.8. Nordics
- 3.9. Rest of Europe
-
4. Middle East & Africa
- 4.1. Turkey
- 4.2. Israel
- 4.3. GCC
- 4.4. North Africa
- 4.5. South Africa
- 4.6. Rest of Middle East & Africa
-
5. Asia Pacific
- 5.1. China
- 5.2. India
- 5.3. Japan
- 5.4. South Korea
- 5.5. ASEAN
- 5.6. Oceania
- 5.7. Rest of Asia Pacific
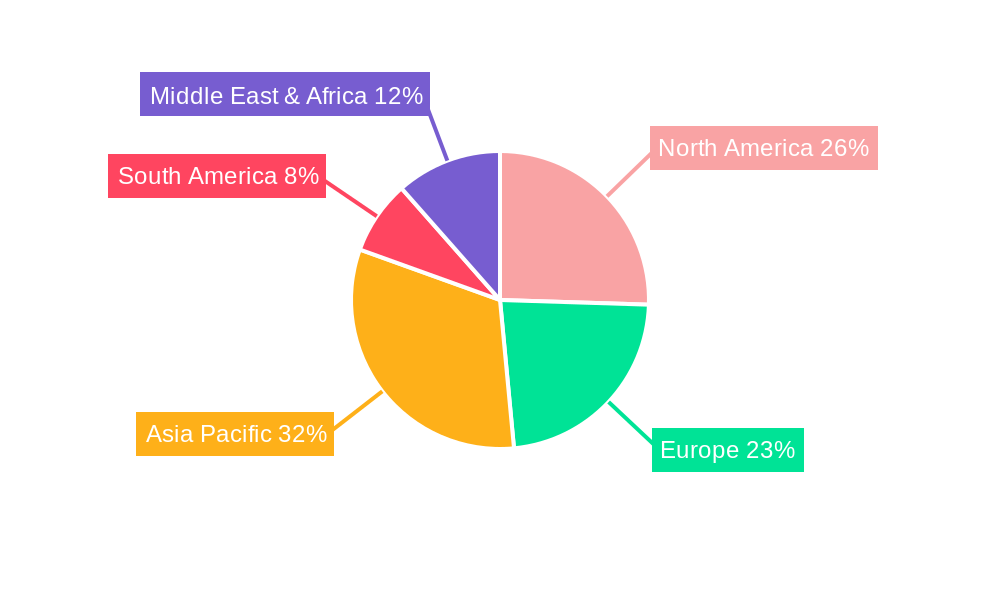
SLA Batteries Regional Market Share
Geographic Coverage of SLA Batteries
SLA Batteries REPORT HIGHLIGHTS
| Aspects | Details |
|---|---|
| Study Period | 2020-2034 |
| Base Year | 2025 |
| Estimated Year | 2026 |
| Forecast Period | 2026-2034 |
| Historical Period | 2020-2025 |
| Growth Rate | CAGR of 5.6% from 2020-2034 |
| Segmentation |
|
Table of Contents
- 1. Introduction
- 1.1. Research Scope
- 1.2. Market Segmentation
- 1.3. Research Methodology
- 1.4. Definitions and Assumptions
- 2. Executive Summary
- 2.1. Introduction
- 3. Market Dynamics
- 3.1. Introduction
- 3.2. Market Drivers
- 3.3. Market Restrains
- 3.4. Market Trends
- 4. Market Factor Analysis
- 4.1. Porters Five Forces
- 4.2. Supply/Value Chain
- 4.3. PESTEL analysis
- 4.4. Market Entropy
- 4.5. Patent/Trademark Analysis
- 5. Global SLA Batteries Analysis, Insights and Forecast, 2020-2032
- 5.1. Market Analysis, Insights and Forecast - by Application
- 5.1.1. Emergency Lighting
- 5.1.2. Security Systems
- 5.1.3. Back-Ups
- 5.1.4. Consumer Electronics
- 5.1.5. Others
- 5.2. Market Analysis, Insights and Forecast - by Types
- 5.2.1. General Purpose SLA AGM Batteries
- 5.2.2. Deep Cycle SLA AGM Batteries
- 5.2.3. Gel SLA Batteries
- 5.2.4. UPS SLA AGM Batteries
- 5.3. Market Analysis, Insights and Forecast - by Region
- 5.3.1. North America
- 5.3.2. South America
- 5.3.3. Europe
- 5.3.4. Middle East & Africa
- 5.3.5. Asia Pacific
- 5.1. Market Analysis, Insights and Forecast - by Application
- 6. North America SLA Batteries Analysis, Insights and Forecast, 2020-2032
- 6.1. Market Analysis, Insights and Forecast - by Application
- 6.1.1. Emergency Lighting
- 6.1.2. Security Systems
- 6.1.3. Back-Ups
- 6.1.4. Consumer Electronics
- 6.1.5. Others
- 6.2. Market Analysis, Insights and Forecast - by Types
- 6.2.1. General Purpose SLA AGM Batteries
- 6.2.2. Deep Cycle SLA AGM Batteries
- 6.2.3. Gel SLA Batteries
- 6.2.4. UPS SLA AGM Batteries
- 6.1. Market Analysis, Insights and Forecast - by Application
- 7. South America SLA Batteries Analysis, Insights and Forecast, 2020-2032
- 7.1. Market Analysis, Insights and Forecast - by Application
- 7.1.1. Emergency Lighting
- 7.1.2. Security Systems
- 7.1.3. Back-Ups
- 7.1.4. Consumer Electronics
- 7.1.5. Others
- 7.2. Market Analysis, Insights and Forecast - by Types
- 7.2.1. General Purpose SLA AGM Batteries
- 7.2.2. Deep Cycle SLA AGM Batteries
- 7.2.3. Gel SLA Batteries
- 7.2.4. UPS SLA AGM Batteries
- 7.1. Market Analysis, Insights and Forecast - by Application
- 8. Europe SLA Batteries Analysis, Insights and Forecast, 2020-2032
- 8.1. Market Analysis, Insights and Forecast - by Application
- 8.1.1. Emergency Lighting
- 8.1.2. Security Systems
- 8.1.3. Back-Ups
- 8.1.4. Consumer Electronics
- 8.1.5. Others
- 8.2. Market Analysis, Insights and Forecast - by Types
- 8.2.1. General Purpose SLA AGM Batteries
- 8.2.2. Deep Cycle SLA AGM Batteries
- 8.2.3. Gel SLA Batteries
- 8.2.4. UPS SLA AGM Batteries
- 8.1. Market Analysis, Insights and Forecast - by Application
- 9. Middle East & Africa SLA Batteries Analysis, Insights and Forecast, 2020-2032
- 9.1. Market Analysis, Insights and Forecast - by Application
- 9.1.1. Emergency Lighting
- 9.1.2. Security Systems
- 9.1.3. Back-Ups
- 9.1.4. Consumer Electronics
- 9.1.5. Others
- 9.2. Market Analysis, Insights and Forecast - by Types
- 9.2.1. General Purpose SLA AGM Batteries
- 9.2.2. Deep Cycle SLA AGM Batteries
- 9.2.3. Gel SLA Batteries
- 9.2.4. UPS SLA AGM Batteries
- 9.1. Market Analysis, Insights and Forecast - by Application
- 10. Asia Pacific SLA Batteries Analysis, Insights and Forecast, 2020-2032
- 10.1. Market Analysis, Insights and Forecast - by Application
- 10.1.1. Emergency Lighting
- 10.1.2. Security Systems
- 10.1.3. Back-Ups
- 10.1.4. Consumer Electronics
- 10.1.5. Others
- 10.2. Market Analysis, Insights and Forecast - by Types
- 10.2.1. General Purpose SLA AGM Batteries
- 10.2.2. Deep Cycle SLA AGM Batteries
- 10.2.3. Gel SLA Batteries
- 10.2.4. UPS SLA AGM Batteries
- 10.1. Market Analysis, Insights and Forecast - by Application
- 11. Competitive Analysis
- 11.1. Global Market Share Analysis 2025
- 11.2. Company Profiles
- 11.2.1 Panasonic
- 11.2.1.1. Overview
- 11.2.1.2. Products
- 11.2.1.3. SWOT Analysis
- 11.2.1.4. Recent Developments
- 11.2.1.5. Financials (Based on Availability)
- 11.2.2 Johnson Controls
- 11.2.2.1. Overview
- 11.2.2.2. Products
- 11.2.2.3. SWOT Analysis
- 11.2.2.4. Recent Developments
- 11.2.2.5. Financials (Based on Availability)
- 11.2.3 Yuasa
- 11.2.3.1. Overview
- 11.2.3.2. Products
- 11.2.3.3. SWOT Analysis
- 11.2.3.4. Recent Developments
- 11.2.3.5. Financials (Based on Availability)
- 11.2.4 Vision Battery
- 11.2.4.1. Overview
- 11.2.4.2. Products
- 11.2.4.3. SWOT Analysis
- 11.2.4.4. Recent Developments
- 11.2.4.5. Financials (Based on Availability)
- 11.2.5 SBS Battery
- 11.2.5.1. Overview
- 11.2.5.2. Products
- 11.2.5.3. SWOT Analysis
- 11.2.5.4. Recent Developments
- 11.2.5.5. Financials (Based on Availability)
- 11.2.6 Fiamm
- 11.2.6.1. Overview
- 11.2.6.2. Products
- 11.2.6.3. SWOT Analysis
- 11.2.6.4. Recent Developments
- 11.2.6.5. Financials (Based on Availability)
- 11.2.7 MCA
- 11.2.7.1. Overview
- 11.2.7.2. Products
- 11.2.7.3. SWOT Analysis
- 11.2.7.4. Recent Developments
- 11.2.7.5. Financials (Based on Availability)
- 11.2.8 IBT Battery
- 11.2.8.1. Overview
- 11.2.8.2. Products
- 11.2.8.3. SWOT Analysis
- 11.2.8.4. Recent Developments
- 11.2.8.5. Financials (Based on Availability)
- 11.2.9 Southern Battery
- 11.2.9.1. Overview
- 11.2.9.2. Products
- 11.2.9.3. SWOT Analysis
- 11.2.9.4. Recent Developments
- 11.2.9.5. Financials (Based on Availability)
- 11.2.10 Exide Technologies
- 11.2.10.1. Overview
- 11.2.10.2. Products
- 11.2.10.3. SWOT Analysis
- 11.2.10.4. Recent Developments
- 11.2.10.5. Financials (Based on Availability)
- 11.2.11 CSB Battery
- 11.2.11.1. Overview
- 11.2.11.2. Products
- 11.2.11.3. SWOT Analysis
- 11.2.11.4. Recent Developments
- 11.2.11.5. Financials (Based on Availability)
- 11.2.12 Atlasbx
- 11.2.12.1. Overview
- 11.2.12.2. Products
- 11.2.12.3. SWOT Analysis
- 11.2.12.4. Recent Developments
- 11.2.12.5. Financials (Based on Availability)
- 11.2.13 Amara Raja
- 11.2.13.1. Overview
- 11.2.13.2. Products
- 11.2.13.3. SWOT Analysis
- 11.2.13.4. Recent Developments
- 11.2.13.5. Financials (Based on Availability)
- 11.2.14 C&D Technologies
- 11.2.14.1. Overview
- 11.2.14.2. Products
- 11.2.14.3. SWOT Analysis
- 11.2.14.4. Recent Developments
- 11.2.14.5. Financials (Based on Availability)
- 11.2.15 Trojan
- 11.2.15.1. Overview
- 11.2.15.2. Products
- 11.2.15.3. SWOT Analysis
- 11.2.15.4. Recent Developments
- 11.2.15.5. Financials (Based on Availability)
- 11.2.16 NorthStar Battery
- 11.2.16.1. Overview
- 11.2.16.2. Products
- 11.2.16.3. SWOT Analysis
- 11.2.16.4. Recent Developments
- 11.2.16.5. Financials (Based on Availability)
- 11.2.17 Midac Power
- 11.2.17.1. Overview
- 11.2.17.2. Products
- 11.2.17.3. SWOT Analysis
- 11.2.17.4. Recent Developments
- 11.2.17.5. Financials (Based on Availability)
- 11.2.18 ACDelco
- 11.2.18.1. Overview
- 11.2.18.2. Products
- 11.2.18.3. SWOT Analysis
- 11.2.18.4. Recent Developments
- 11.2.18.5. Financials (Based on Availability)
- 11.2.1 Panasonic
List of Figures
- Figure 1: Global SLA Batteries Revenue Breakdown (million, %) by Region 2025 & 2033
- Figure 2: Global SLA Batteries Volume Breakdown (K, %) by Region 2025 & 2033
- Figure 3: North America SLA Batteries Revenue (million), by Application 2025 & 2033
- Figure 4: North America SLA Batteries Volume (K), by Application 2025 & 2033
- Figure 5: North America SLA Batteries Revenue Share (%), by Application 2025 & 2033
- Figure 6: North America SLA Batteries Volume Share (%), by Application 2025 & 2033
- Figure 7: North America SLA Batteries Revenue (million), by Types 2025 & 2033
- Figure 8: North America SLA Batteries Volume (K), by Types 2025 & 2033
- Figure 9: North America SLA Batteries Revenue Share (%), by Types 2025 & 2033
- Figure 10: North America SLA Batteries Volume Share (%), by Types 2025 & 2033
- Figure 11: North America SLA Batteries Revenue (million), by Country 2025 & 2033
- Figure 12: North America SLA Batteries Volume (K), by Country 2025 & 2033
- Figure 13: North America SLA Batteries Revenue Share (%), by Country 2025 & 2033
- Figure 14: North America SLA Batteries Volume Share (%), by Country 2025 & 2033
- Figure 15: South America SLA Batteries Revenue (million), by Application 2025 & 2033
- Figure 16: South America SLA Batteries Volume (K), by Application 2025 & 2033
- Figure 17: South America SLA Batteries Revenue Share (%), by Application 2025 & 2033
- Figure 18: South America SLA Batteries Volume Share (%), by Application 2025 & 2033
- Figure 19: South America SLA Batteries Revenue (million), by Types 2025 & 2033
- Figure 20: South America SLA Batteries Volume (K), by Types 2025 & 2033
- Figure 21: South America SLA Batteries Revenue Share (%), by Types 2025 & 2033
- Figure 22: South America SLA Batteries Volume Share (%), by Types 2025 & 2033
- Figure 23: South America SLA Batteries Revenue (million), by Country 2025 & 2033
- Figure 24: South America SLA Batteries Volume (K), by Country 2025 & 2033
- Figure 25: South America SLA Batteries Revenue Share (%), by Country 2025 & 2033
- Figure 26: South America SLA Batteries Volume Share (%), by Country 2025 & 2033
- Figure 27: Europe SLA Batteries Revenue (million), by Application 2025 & 2033
- Figure 28: Europe SLA Batteries Volume (K), by Application 2025 & 2033
- Figure 29: Europe SLA Batteries Revenue Share (%), by Application 2025 & 2033
- Figure 30: Europe SLA Batteries Volume Share (%), by Application 2025 & 2033
- Figure 31: Europe SLA Batteries Revenue (million), by Types 2025 & 2033
- Figure 32: Europe SLA Batteries Volume (K), by Types 2025 & 2033
- Figure 33: Europe SLA Batteries Revenue Share (%), by Types 2025 & 2033
- Figure 34: Europe SLA Batteries Volume Share (%), by Types 2025 & 2033
- Figure 35: Europe SLA Batteries Revenue (million), by Country 2025 & 2033
- Figure 36: Europe SLA Batteries Volume (K), by Country 2025 & 2033
- Figure 37: Europe SLA Batteries Revenue Share (%), by Country 2025 & 2033
- Figure 38: Europe SLA Batteries Volume Share (%), by Country 2025 & 2033
- Figure 39: Middle East & Africa SLA Batteries Revenue (million), by Application 2025 & 2033
- Figure 40: Middle East & Africa SLA Batteries Volume (K), by Application 2025 & 2033
- Figure 41: Middle East & Africa SLA Batteries Revenue Share (%), by Application 2025 & 2033
- Figure 42: Middle East & Africa SLA Batteries Volume Share (%), by Application 2025 & 2033
- Figure 43: Middle East & Africa SLA Batteries Revenue (million), by Types 2025 & 2033
- Figure 44: Middle East & Africa SLA Batteries Volume (K), by Types 2025 & 2033
- Figure 45: Middle East & Africa SLA Batteries Revenue Share (%), by Types 2025 & 2033
- Figure 46: Middle East & Africa SLA Batteries Volume Share (%), by Types 2025 & 2033
- Figure 47: Middle East & Africa SLA Batteries Revenue (million), by Country 2025 & 2033
- Figure 48: Middle East & Africa SLA Batteries Volume (K), by Country 2025 & 2033
- Figure 49: Middle East & Africa SLA Batteries Revenue Share (%), by Country 2025 & 2033
- Figure 50: Middle East & Africa SLA Batteries Volume Share (%), by Country 2025 & 2033
- Figure 51: Asia Pacific SLA Batteries Revenue (million), by Application 2025 & 2033
- Figure 52: Asia Pacific SLA Batteries Volume (K), by Application 2025 & 2033
- Figure 53: Asia Pacific SLA Batteries Revenue Share (%), by Application 2025 & 2033
- Figure 54: Asia Pacific SLA Batteries Volume Share (%), by Application 2025 & 2033
- Figure 55: Asia Pacific SLA Batteries Revenue (million), by Types 2025 & 2033
- Figure 56: Asia Pacific SLA Batteries Volume (K), by Types 2025 & 2033
- Figure 57: Asia Pacific SLA Batteries Revenue Share (%), by Types 2025 & 2033
- Figure 58: Asia Pacific SLA Batteries Volume Share (%), by Types 2025 & 2033
- Figure 59: Asia Pacific SLA Batteries Revenue (million), by Country 2025 & 2033
- Figure 60: Asia Pacific SLA Batteries Volume (K), by Country 2025 & 2033
- Figure 61: Asia Pacific SLA Batteries Revenue Share (%), by Country 2025 & 2033
- Figure 62: Asia Pacific SLA Batteries Volume Share (%), by Country 2025 & 2033
List of Tables
- Table 1: Global SLA Batteries Revenue million Forecast, by Application 2020 & 2033
- Table 2: Global SLA Batteries Volume K Forecast, by Application 2020 & 2033
- Table 3: Global SLA Batteries Revenue million Forecast, by Types 2020 & 2033
- Table 4: Global SLA Batteries Volume K Forecast, by Types 2020 & 2033
- Table 5: Global SLA Batteries Revenue million Forecast, by Region 2020 & 2033
- Table 6: Global SLA Batteries Volume K Forecast, by Region 2020 & 2033
- Table 7: Global SLA Batteries Revenue million Forecast, by Application 2020 & 2033
- Table 8: Global SLA Batteries Volume K Forecast, by Application 2020 & 2033
- Table 9: Global SLA Batteries Revenue million Forecast, by Types 2020 & 2033
- Table 10: Global SLA Batteries Volume K Forecast, by Types 2020 & 2033
- Table 11: Global SLA Batteries Revenue million Forecast, by Country 2020 & 2033
- Table 12: Global SLA Batteries Volume K Forecast, by Country 2020 & 2033
- Table 13: United States SLA Batteries Revenue (million) Forecast, by Application 2020 & 2033
- Table 14: United States SLA Batteries Volume (K) Forecast, by Application 2020 & 2033
- Table 15: Canada SLA Batteries Revenue (million) Forecast, by Application 2020 & 2033
- Table 16: Canada SLA Batteries Volume (K) Forecast, by Application 2020 & 2033
- Table 17: Mexico SLA Batteries Revenue (million) Forecast, by Application 2020 & 2033
- Table 18: Mexico SLA Batteries Volume (K) Forecast, by Application 2020 & 2033
- Table 19: Global SLA Batteries Revenue million Forecast, by Application 2020 & 2033
- Table 20: Global SLA Batteries Volume K Forecast, by Application 2020 & 2033
- Table 21: Global SLA Batteries Revenue million Forecast, by Types 2020 & 2033
- Table 22: Global SLA Batteries Volume K Forecast, by Types 2020 & 2033
- Table 23: Global SLA Batteries Revenue million Forecast, by Country 2020 & 2033
- Table 24: Global SLA Batteries Volume K Forecast, by Country 2020 & 2033
- Table 25: Brazil SLA Batteries Revenue (million) Forecast, by Application 2020 & 2033
- Table 26: Brazil SLA Batteries Volume (K) Forecast, by Application 2020 & 2033
- Table 27: Argentina SLA Batteries Revenue (million) Forecast, by Application 2020 & 2033
- Table 28: Argentina SLA Batteries Volume (K) Forecast, by Application 2020 & 2033
- Table 29: Rest of South America SLA Batteries Revenue (million) Forecast, by Application 2020 & 2033
- Table 30: Rest of South America SLA Batteries Volume (K) Forecast, by Application 2020 & 2033
- Table 31: Global SLA Batteries Revenue million Forecast, by Application 2020 & 2033
- Table 32: Global SLA Batteries Volume K Forecast, by Application 2020 & 2033
- Table 33: Global SLA Batteries Revenue million Forecast, by Types 2020 & 2033
- Table 34: Global SLA Batteries Volume K Forecast, by Types 2020 & 2033
- Table 35: Global SLA Batteries Revenue million Forecast, by Country 2020 & 2033
- Table 36: Global SLA Batteries Volume K Forecast, by Country 2020 & 2033
- Table 37: United Kingdom SLA Batteries Revenue (million) Forecast, by Application 2020 & 2033
- Table 38: United Kingdom SLA Batteries Volume (K) Forecast, by Application 2020 & 2033
- Table 39: Germany SLA Batteries Revenue (million) Forecast, by Application 2020 & 2033
- Table 40: Germany SLA Batteries Volume (K) Forecast, by Application 2020 & 2033
- Table 41: France SLA Batteries Revenue (million) Forecast, by Application 2020 & 2033
- Table 42: France SLA Batteries Volume (K) Forecast, by Application 2020 & 2033
- Table 43: Italy SLA Batteries Revenue (million) Forecast, by Application 2020 & 2033
- Table 44: Italy SLA Batteries Volume (K) Forecast, by Application 2020 & 2033
- Table 45: Spain SLA Batteries Revenue (million) Forecast, by Application 2020 & 2033
- Table 46: Spain SLA Batteries Volume (K) Forecast, by Application 2020 & 2033
- Table 47: Russia SLA Batteries Revenue (million) Forecast, by Application 2020 & 2033
- Table 48: Russia SLA Batteries Volume (K) Forecast, by Application 2020 & 2033
- Table 49: Benelux SLA Batteries Revenue (million) Forecast, by Application 2020 & 2033
- Table 50: Benelux SLA Batteries Volume (K) Forecast, by Application 2020 & 2033
- Table 51: Nordics SLA Batteries Revenue (million) Forecast, by Application 2020 & 2033
- Table 52: Nordics SLA Batteries Volume (K) Forecast, by Application 2020 & 2033
- Table 53: Rest of Europe SLA Batteries Revenue (million) Forecast, by Application 2020 & 2033
- Table 54: Rest of Europe SLA Batteries Volume (K) Forecast, by Application 2020 & 2033
- Table 55: Global SLA Batteries Revenue million Forecast, by Application 2020 & 2033
- Table 56: Global SLA Batteries Volume K Forecast, by Application 2020 & 2033
- Table 57: Global SLA Batteries Revenue million Forecast, by Types 2020 & 2033
- Table 58: Global SLA Batteries Volume K Forecast, by Types 2020 & 2033
- Table 59: Global SLA Batteries Revenue million Forecast, by Country 2020 & 2033
- Table 60: Global SLA Batteries Volume K Forecast, by Country 2020 & 2033
- Table 61: Turkey SLA Batteries Revenue (million) Forecast, by Application 2020 & 2033
- Table 62: Turkey SLA Batteries Volume (K) Forecast, by Application 2020 & 2033
- Table 63: Israel SLA Batteries Revenue (million) Forecast, by Application 2020 & 2033
- Table 64: Israel SLA Batteries Volume (K) Forecast, by Application 2020 & 2033
- Table 65: GCC SLA Batteries Revenue (million) Forecast, by Application 2020 & 2033
- Table 66: GCC SLA Batteries Volume (K) Forecast, by Application 2020 & 2033
- Table 67: North Africa SLA Batteries Revenue (million) Forecast, by Application 2020 & 2033
- Table 68: North Africa SLA Batteries Volume (K) Forecast, by Application 2020 & 2033
- Table 69: South Africa SLA Batteries Revenue (million) Forecast, by Application 2020 & 2033
- Table 70: South Africa SLA Batteries Volume (K) Forecast, by Application 2020 & 2033
- Table 71: Rest of Middle East & Africa SLA Batteries Revenue (million) Forecast, by Application 2020 & 2033
- Table 72: Rest of Middle East & Africa SLA Batteries Volume (K) Forecast, by Application 2020 & 2033
- Table 73: Global SLA Batteries Revenue million Forecast, by Application 2020 & 2033
- Table 74: Global SLA Batteries Volume K Forecast, by Application 2020 & 2033
- Table 75: Global SLA Batteries Revenue million Forecast, by Types 2020 & 2033
- Table 76: Global SLA Batteries Volume K Forecast, by Types 2020 & 2033
- Table 77: Global SLA Batteries Revenue million Forecast, by Country 2020 & 2033
- Table 78: Global SLA Batteries Volume K Forecast, by Country 2020 & 2033
- Table 79: China SLA Batteries Revenue (million) Forecast, by Application 2020 & 2033
- Table 80: China SLA Batteries Volume (K) Forecast, by Application 2020 & 2033
- Table 81: India SLA Batteries Revenue (million) Forecast, by Application 2020 & 2033
- Table 82: India SLA Batteries Volume (K) Forecast, by Application 2020 & 2033
- Table 83: Japan SLA Batteries Revenue (million) Forecast, by Application 2020 & 2033
- Table 84: Japan SLA Batteries Volume (K) Forecast, by Application 2020 & 2033
- Table 85: South Korea SLA Batteries Revenue (million) Forecast, by Application 2020 & 2033
- Table 86: South Korea SLA Batteries Volume (K) Forecast, by Application 2020 & 2033
- Table 87: ASEAN SLA Batteries Revenue (million) Forecast, by Application 2020 & 2033
- Table 88: ASEAN SLA Batteries Volume (K) Forecast, by Application 2020 & 2033
- Table 89: Oceania SLA Batteries Revenue (million) Forecast, by Application 2020 & 2033
- Table 90: Oceania SLA Batteries Volume (K) Forecast, by Application 2020 & 2033
- Table 91: Rest of Asia Pacific SLA Batteries Revenue (million) Forecast, by Application 2020 & 2033
- Table 92: Rest of Asia Pacific SLA Batteries Volume (K) Forecast, by Application 2020 & 2033
Frequently Asked Questions
1. What is the projected Compound Annual Growth Rate (CAGR) of the SLA Batteries?
The projected CAGR is approximately 5.6%.
2. Which companies are prominent players in the SLA Batteries?
Key companies in the market include Panasonic, Johnson Controls, Yuasa, Vision Battery, SBS Battery, Fiamm, MCA, IBT Battery, Southern Battery, Exide Technologies, CSB Battery, Atlasbx, Amara Raja, C&D Technologies, Trojan, NorthStar Battery, Midac Power, ACDelco.
3. What are the main segments of the SLA Batteries?
The market segments include Application, Types.
4. Can you provide details about the market size?
The market size is estimated to be USD 1692.2 million as of 2022.
5. What are some drivers contributing to market growth?
N/A
6. What are the notable trends driving market growth?
N/A
7. Are there any restraints impacting market growth?
N/A
8. Can you provide examples of recent developments in the market?
N/A
9. What pricing options are available for accessing the report?
Pricing options include single-user, multi-user, and enterprise licenses priced at USD 3350.00, USD 5025.00, and USD 6700.00 respectively.
10. Is the market size provided in terms of value or volume?
The market size is provided in terms of value, measured in million and volume, measured in K.
11. Are there any specific market keywords associated with the report?
Yes, the market keyword associated with the report is "SLA Batteries," which aids in identifying and referencing the specific market segment covered.
12. How do I determine which pricing option suits my needs best?
The pricing options vary based on user requirements and access needs. Individual users may opt for single-user licenses, while businesses requiring broader access may choose multi-user or enterprise licenses for cost-effective access to the report.
13. Are there any additional resources or data provided in the SLA Batteries report?
While the report offers comprehensive insights, it's advisable to review the specific contents or supplementary materials provided to ascertain if additional resources or data are available.
14. How can I stay updated on further developments or reports in the SLA Batteries?
To stay informed about further developments, trends, and reports in the SLA Batteries, consider subscribing to industry newsletters, following relevant companies and organizations, or regularly checking reputable industry news sources and publications.
Methodology
Step 1 - Identification of Relevant Samples Size from Population Database


Step 2 - Approaches for Defining Global Market Size (Value, Volume* & Price*)

Note*: In applicable scenarios
Step 3 - Data Sources
Primary Research
- Web Analytics
- Survey Reports
- Research Institute
- Latest Research Reports
- Opinion Leaders
Secondary Research
- Annual Reports
- White Paper
- Latest Press Release
- Industry Association
- Paid Database
- Investor Presentations

Step 4 - Data Triangulation
Involves using different sources of information in order to increase the validity of a study
These sources are likely to be stakeholders in a program - participants, other researchers, program staff, other community members, and so on.
Then we put all data in single framework & apply various statistical tools to find out the dynamic on the market.
During the analysis stage, feedback from the stakeholder groups would be compared to determine areas of agreement as well as areas of divergence