

Key Insights
The global shunt voltage reference market is poised for significant expansion, projected to reach $8.46 billion by 2025, with a robust Compound Annual Growth Rate (CAGR) of 14.15%. This growth is primarily propelled by the escalating demand for precise voltage regulation across diverse sectors. The automotive industry is a pivotal contributor, driven by the widespread adoption of Advanced Driver-Assistance Systems (ADAS) and the rapid evolution of Electric Vehicles (EVs). Concurrently, the burgeoning consumer electronics sector significantly bolsters market demand, as high-precision voltage references are indispensable for guaranteeing the dependable operation of sensitive electronic components. Technological advancements, leading to the development of smaller, more energy-efficient, and lower-power shunt voltage references, are further accelerating market expansion. The market is segmented by voltage type (1.25V, 2.5V, 4.096V, 5.0V) and application (electronics, isolated power supplies, adapters, automotive, others). The 5.0V segment currently holds a substantial market share due to its extensive application across various industries. Leading market participants, including Amphenol, NXP Semiconductors, Texas Instruments, and Analog Devices, are actively investing in research and development to pioneer innovations that cater to the dynamic needs of the market.
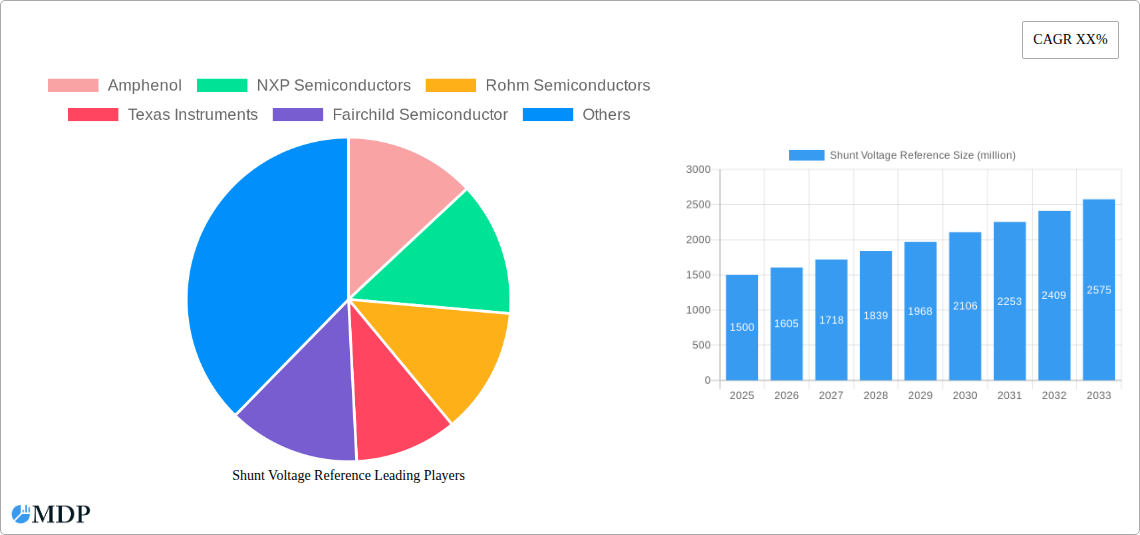
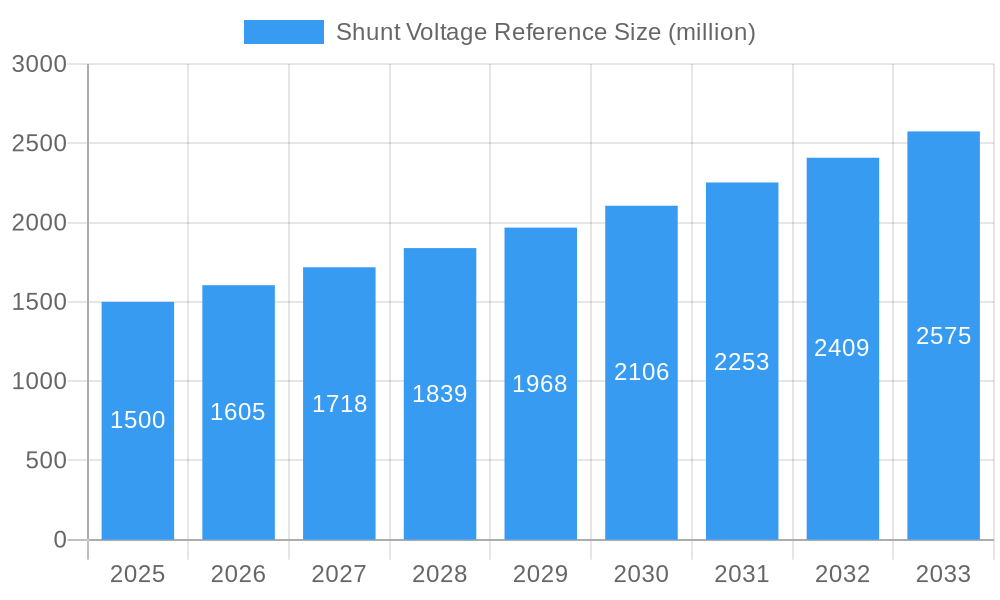
Shunt Voltage Reference Market Size (In Billion)
While the market demonstrates a positive growth trajectory, certain challenges persist. Volatility in raw material prices, particularly for semiconductors, coupled with geopolitical uncertainties, may influence production expenditures and market stability. The increasing complexity of electronic systems necessitates the development of more sophisticated and reliable voltage references, demanding heightened research and development investments from manufacturers. Intensifying competition among established entities and emerging players is anticipated, requiring strategic collaborations and technological breakthroughs for sustained market leadership. Nevertheless, the long-term outlook for the shunt voltage reference market remains highly promising, underpinned by the continuous trend of miniaturization, an increasing emphasis on power efficiency, and the expanding integration of advanced electronics across a multitude of industries. The projected CAGR of 14.15% from 2025 to 2033 signifies substantial future growth potential.
Shunt Voltage Reference Company Market Share
Shunt Voltage Reference Market Report: 2019-2033 Forecast
This comprehensive report provides an in-depth analysis of the global Shunt Voltage Reference market, projecting a value of $XX million by 2033. The study covers the period 2019-2033, with a base year of 2025 and a forecast period of 2025-2033. It offers invaluable insights for industry stakeholders, including manufacturers, suppliers, investors, and market entrants seeking a competitive edge. Key market players analyzed include Amphenol, NXP Semiconductors, Rohm Semiconductors, Texas Instruments, Fairchild Semiconductor, Arrow Electronics, Infineon Technologies, Intersil Corporation, Diodes Incorporated, Methode Electronics, Analog Devices, and Maxim Integrated. The report segments the market by application (Electronics, Isolated Power Supplies, Adapters, Automotive, Others) and type (1.25V, 2.5V, 4.096V, 5.0V).
Shunt Voltage Reference Market Dynamics & Concentration
The Shunt Voltage Reference market exhibits a moderately consolidated structure, with the top five players holding approximately XX% of the market share in 2025. Market concentration is influenced by factors such as technological innovation, stringent regulatory frameworks, and the availability of substitute products. The market witnessed XX M&A deals between 2019 and 2024, indicating a significant level of consolidation. End-user trends, particularly in the automotive and electronics sectors, significantly impact market growth. Innovation in precision and power efficiency drives demand.
- Market Share: Top 5 players hold approximately XX% in 2025.
- M&A Activity: XX deals between 2019 and 2024.
- Key Drivers: Technological innovation, stringent regulations, and substitute product availability.
- End-User Trends: Growing demand from automotive and electronics sectors.
Shunt Voltage Reference Industry Trends & Analysis
The global Shunt Voltage Reference market is projected to experience a Compound Annual Growth Rate (CAGR) of XX% during the forecast period (2025-2033). This growth is fueled by increasing demand from the electronics industry, particularly in high-precision applications. Technological advancements, such as the development of smaller, more energy-efficient devices, are further driving market expansion. Consumer preference for high-quality, reliable components contributes to market penetration. Competitive dynamics are characterized by intense R&D efforts and strategic partnerships among leading players. Market penetration in emerging economies also presents substantial growth opportunities.
Leading Markets & Segments in Shunt Voltage Reference
The electronics segment dominates the Shunt Voltage Reference market, accounting for approximately XX% of the total market value in 2025. This segment's dominance is driven by the proliferation of smart devices and increased demand for high-precision electronic equipment. The automotive sector is also experiencing substantial growth due to the increasing adoption of advanced driver-assistance systems (ADAS) and electric vehicles. Among the voltage types, the 5.0V segment holds the largest share, with xx million units shipped in 2025. Geographically, North America and Asia-Pacific are the leading markets.
- Key Drivers (Electronics Segment): High demand for high-precision electronic devices, smart device proliferation, and growing consumer electronics market.
- Key Drivers (Automotive Segment): Increased adoption of ADAS and electric vehicles, demand for improved vehicle performance and safety features.
- Dominant Voltage Type: 5.0V
- Leading Regions: North America and Asia-Pacific
Shunt Voltage Reference Product Developments
Recent product innovations focus on enhancing precision, reducing power consumption, and improving temperature stability. Miniaturization and integration are key technological trends. Manufacturers are actively developing products with improved performance characteristics to cater to the demands of various applications, ensuring competitive advantages in terms of accuracy and efficiency.
Key Drivers of Shunt Voltage Reference Growth
The market's growth is fueled by several factors, including: (1) the increasing demand for high-precision measurements in various applications; (2) the growing adoption of advanced technologies such as IoT and 5G, which require high-precision voltage references; and (3) stringent regulatory requirements for accuracy and reliability in industries like automotive and medical. Favorable economic conditions in several key markets also contribute to the growth.
Challenges in the Shunt Voltage Reference Market
The Shunt Voltage Reference market faces challenges such as intense competition from established and emerging players, potential supply chain disruptions, and the need to comply with evolving industry regulations. These factors can lead to price pressure and impact profitability. Furthermore, the market's growth might be limited by the availability of cost-effective alternatives. The overall impact of these factors on market growth is estimated to be a reduction of approximately XX% by 2033.
Emerging Opportunities in Shunt Voltage Reference
Emerging opportunities lie in the development of next-generation products with improved performance, miniaturization, and reduced power consumption. Strategic partnerships and collaborations between leading players and emerging technology developers offer significant growth potential. Market expansion into developing economies presents a considerable opportunity for market players.
Leading Players in the Shunt Voltage Reference Sector
- Amphenol
- NXP Semiconductors
- Rohm Semiconductors
- Texas Instruments
- Fairchild Semiconductor
- Arrow Electronics
- Infineon Technologies
- Intersil Corporation
- Diodes Incorporated
- Methode Electronics
- Analog Devices
- Maxim Integrated
Key Milestones in Shunt Voltage Reference Industry
- 2020: Introduction of a new generation of high-precision shunt voltage references by Texas Instruments.
- 2022: Acquisition of a smaller competitor by Analog Devices, expanding its market share.
- 2023: Launch of a new energy-efficient shunt voltage reference by Rohm Semiconductors.
- 2024: New industry standards for accuracy and reliability were implemented.
Strategic Outlook for Shunt Voltage Reference Market
The Shunt Voltage Reference market holds significant growth potential, driven by technological advancements and increasing demand across diverse sectors. Companies adopting strategies focused on innovation, strategic partnerships, and expansion into emerging markets are well-positioned to capture significant market share. The focus on miniaturization and improved energy efficiency will continue to shape the future of the market.
Shunt Voltage Reference Segmentation
-
1. Application
- 1.1. Electronics
- 1.2. Isolated Power Supplies
- 1.3. Adapters
- 1.4. Automotive
- 1.5. Others
-
2. Types
- 2.1. 1.25V
- 2.2. 2.5V
- 2.3. 4.096V
- 2.4. 5.0V
Shunt Voltage Reference Segmentation By Geography
-
1. North America
- 1.1. United States
- 1.2. Canada
- 1.3. Mexico
-
2. South America
- 2.1. Brazil
- 2.2. Argentina
- 2.3. Rest of South America
-
3. Europe
- 3.1. United Kingdom
- 3.2. Germany
- 3.3. France
- 3.4. Italy
- 3.5. Spain
- 3.6. Russia
- 3.7. Benelux
- 3.8. Nordics
- 3.9. Rest of Europe
-
4. Middle East & Africa
- 4.1. Turkey
- 4.2. Israel
- 4.3. GCC
- 4.4. North Africa
- 4.5. South Africa
- 4.6. Rest of Middle East & Africa
-
5. Asia Pacific
- 5.1. China
- 5.2. India
- 5.3. Japan
- 5.4. South Korea
- 5.5. ASEAN
- 5.6. Oceania
- 5.7. Rest of Asia Pacific
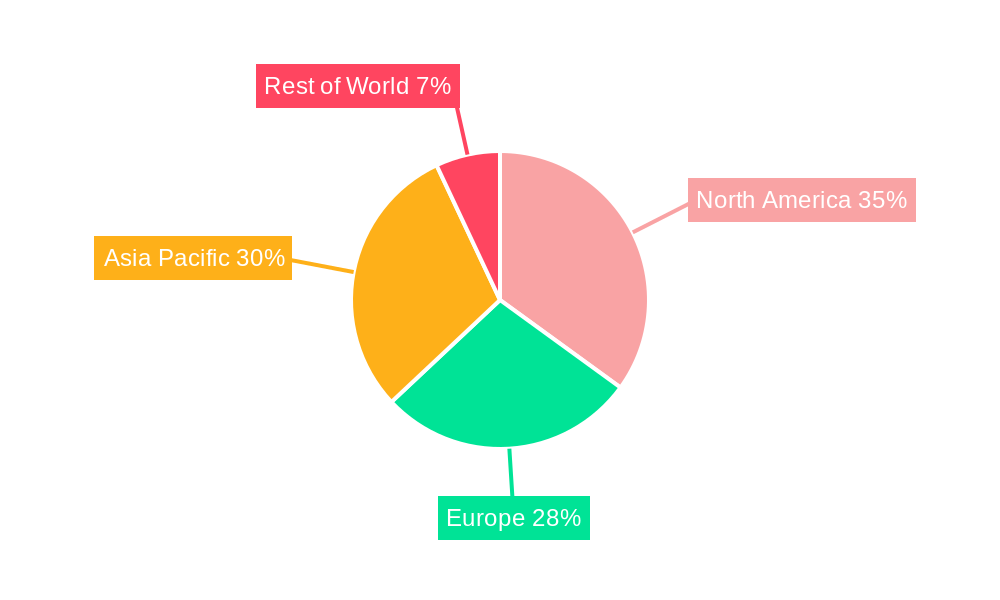
Shunt Voltage Reference Regional Market Share
Geographic Coverage of Shunt Voltage Reference
Shunt Voltage Reference REPORT HIGHLIGHTS
| Aspects | Details |
|---|---|
| Study Period | 2020-2034 |
| Base Year | 2025 |
| Estimated Year | 2026 |
| Forecast Period | 2026-2034 |
| Historical Period | 2020-2025 |
| Growth Rate | CAGR of 14.15% from 2020-2034 |
| Segmentation |
|
Table of Contents
- 1. Introduction
- 1.1. Research Scope
- 1.2. Market Segmentation
- 1.3. Research Methodology
- 1.4. Definitions and Assumptions
- 2. Executive Summary
- 2.1. Introduction
- 3. Market Dynamics
- 3.1. Introduction
- 3.2. Market Drivers
- 3.3. Market Restrains
- 3.4. Market Trends
- 4. Market Factor Analysis
- 4.1. Porters Five Forces
- 4.2. Supply/Value Chain
- 4.3. PESTEL analysis
- 4.4. Market Entropy
- 4.5. Patent/Trademark Analysis
- 5. Global Shunt Voltage Reference Analysis, Insights and Forecast, 2020-2032
- 5.1. Market Analysis, Insights and Forecast - by Application
- 5.1.1. Electronics
- 5.1.2. Isolated Power Supplies
- 5.1.3. Adapters
- 5.1.4. Automotive
- 5.1.5. Others
- 5.2. Market Analysis, Insights and Forecast - by Types
- 5.2.1. 1.25V
- 5.2.2. 2.5V
- 5.2.3. 4.096V
- 5.2.4. 5.0V
- 5.3. Market Analysis, Insights and Forecast - by Region
- 5.3.1. North America
- 5.3.2. South America
- 5.3.3. Europe
- 5.3.4. Middle East & Africa
- 5.3.5. Asia Pacific
- 5.1. Market Analysis, Insights and Forecast - by Application
- 6. North America Shunt Voltage Reference Analysis, Insights and Forecast, 2020-2032
- 6.1. Market Analysis, Insights and Forecast - by Application
- 6.1.1. Electronics
- 6.1.2. Isolated Power Supplies
- 6.1.3. Adapters
- 6.1.4. Automotive
- 6.1.5. Others
- 6.2. Market Analysis, Insights and Forecast - by Types
- 6.2.1. 1.25V
- 6.2.2. 2.5V
- 6.2.3. 4.096V
- 6.2.4. 5.0V
- 6.1. Market Analysis, Insights and Forecast - by Application
- 7. South America Shunt Voltage Reference Analysis, Insights and Forecast, 2020-2032
- 7.1. Market Analysis, Insights and Forecast - by Application
- 7.1.1. Electronics
- 7.1.2. Isolated Power Supplies
- 7.1.3. Adapters
- 7.1.4. Automotive
- 7.1.5. Others
- 7.2. Market Analysis, Insights and Forecast - by Types
- 7.2.1. 1.25V
- 7.2.2. 2.5V
- 7.2.3. 4.096V
- 7.2.4. 5.0V
- 7.1. Market Analysis, Insights and Forecast - by Application
- 8. Europe Shunt Voltage Reference Analysis, Insights and Forecast, 2020-2032
- 8.1. Market Analysis, Insights and Forecast - by Application
- 8.1.1. Electronics
- 8.1.2. Isolated Power Supplies
- 8.1.3. Adapters
- 8.1.4. Automotive
- 8.1.5. Others
- 8.2. Market Analysis, Insights and Forecast - by Types
- 8.2.1. 1.25V
- 8.2.2. 2.5V
- 8.2.3. 4.096V
- 8.2.4. 5.0V
- 8.1. Market Analysis, Insights and Forecast - by Application
- 9. Middle East & Africa Shunt Voltage Reference Analysis, Insights and Forecast, 2020-2032
- 9.1. Market Analysis, Insights and Forecast - by Application
- 9.1.1. Electronics
- 9.1.2. Isolated Power Supplies
- 9.1.3. Adapters
- 9.1.4. Automotive
- 9.1.5. Others
- 9.2. Market Analysis, Insights and Forecast - by Types
- 9.2.1. 1.25V
- 9.2.2. 2.5V
- 9.2.3. 4.096V
- 9.2.4. 5.0V
- 9.1. Market Analysis, Insights and Forecast - by Application
- 10. Asia Pacific Shunt Voltage Reference Analysis, Insights and Forecast, 2020-2032
- 10.1. Market Analysis, Insights and Forecast - by Application
- 10.1.1. Electronics
- 10.1.2. Isolated Power Supplies
- 10.1.3. Adapters
- 10.1.4. Automotive
- 10.1.5. Others
- 10.2. Market Analysis, Insights and Forecast - by Types
- 10.2.1. 1.25V
- 10.2.2. 2.5V
- 10.2.3. 4.096V
- 10.2.4. 5.0V
- 10.1. Market Analysis, Insights and Forecast - by Application
- 11. Competitive Analysis
- 11.1. Global Market Share Analysis 2025
- 11.2. Company Profiles
- 11.2.1 Amphenol
- 11.2.1.1. Overview
- 11.2.1.2. Products
- 11.2.1.3. SWOT Analysis
- 11.2.1.4. Recent Developments
- 11.2.1.5. Financials (Based on Availability)
- 11.2.2 NXP Semiconductors
- 11.2.2.1. Overview
- 11.2.2.2. Products
- 11.2.2.3. SWOT Analysis
- 11.2.2.4. Recent Developments
- 11.2.2.5. Financials (Based on Availability)
- 11.2.3 Rohm Semiconductors
- 11.2.3.1. Overview
- 11.2.3.2. Products
- 11.2.3.3. SWOT Analysis
- 11.2.3.4. Recent Developments
- 11.2.3.5. Financials (Based on Availability)
- 11.2.4 Texas Instruments
- 11.2.4.1. Overview
- 11.2.4.2. Products
- 11.2.4.3. SWOT Analysis
- 11.2.4.4. Recent Developments
- 11.2.4.5. Financials (Based on Availability)
- 11.2.5 Fairchild Semiconductor
- 11.2.5.1. Overview
- 11.2.5.2. Products
- 11.2.5.3. SWOT Analysis
- 11.2.5.4. Recent Developments
- 11.2.5.5. Financials (Based on Availability)
- 11.2.6 Arrow Electronics
- 11.2.6.1. Overview
- 11.2.6.2. Products
- 11.2.6.3. SWOT Analysis
- 11.2.6.4. Recent Developments
- 11.2.6.5. Financials (Based on Availability)
- 11.2.7 Infineon Technologies
- 11.2.7.1. Overview
- 11.2.7.2. Products
- 11.2.7.3. SWOT Analysis
- 11.2.7.4. Recent Developments
- 11.2.7.5. Financials (Based on Availability)
- 11.2.8 Intersil Corporation
- 11.2.8.1. Overview
- 11.2.8.2. Products
- 11.2.8.3. SWOT Analysis
- 11.2.8.4. Recent Developments
- 11.2.8.5. Financials (Based on Availability)
- 11.2.9 Diodes Incorporated
- 11.2.9.1. Overview
- 11.2.9.2. Products
- 11.2.9.3. SWOT Analysis
- 11.2.9.4. Recent Developments
- 11.2.9.5. Financials (Based on Availability)
- 11.2.10 Methode Electronics
- 11.2.10.1. Overview
- 11.2.10.2. Products
- 11.2.10.3. SWOT Analysis
- 11.2.10.4. Recent Developments
- 11.2.10.5. Financials (Based on Availability)
- 11.2.11 Analog Devices
- 11.2.11.1. Overview
- 11.2.11.2. Products
- 11.2.11.3. SWOT Analysis
- 11.2.11.4. Recent Developments
- 11.2.11.5. Financials (Based on Availability)
- 11.2.12 Maxim Integrated
- 11.2.12.1. Overview
- 11.2.12.2. Products
- 11.2.12.3. SWOT Analysis
- 11.2.12.4. Recent Developments
- 11.2.12.5. Financials (Based on Availability)
- 11.2.1 Amphenol
List of Figures
- Figure 1: Global Shunt Voltage Reference Revenue Breakdown (billion, %) by Region 2025 & 2033
- Figure 2: North America Shunt Voltage Reference Revenue (billion), by Application 2025 & 2033
- Figure 3: North America Shunt Voltage Reference Revenue Share (%), by Application 2025 & 2033
- Figure 4: North America Shunt Voltage Reference Revenue (billion), by Types 2025 & 2033
- Figure 5: North America Shunt Voltage Reference Revenue Share (%), by Types 2025 & 2033
- Figure 6: North America Shunt Voltage Reference Revenue (billion), by Country 2025 & 2033
- Figure 7: North America Shunt Voltage Reference Revenue Share (%), by Country 2025 & 2033
- Figure 8: South America Shunt Voltage Reference Revenue (billion), by Application 2025 & 2033
- Figure 9: South America Shunt Voltage Reference Revenue Share (%), by Application 2025 & 2033
- Figure 10: South America Shunt Voltage Reference Revenue (billion), by Types 2025 & 2033
- Figure 11: South America Shunt Voltage Reference Revenue Share (%), by Types 2025 & 2033
- Figure 12: South America Shunt Voltage Reference Revenue (billion), by Country 2025 & 2033
- Figure 13: South America Shunt Voltage Reference Revenue Share (%), by Country 2025 & 2033
- Figure 14: Europe Shunt Voltage Reference Revenue (billion), by Application 2025 & 2033
- Figure 15: Europe Shunt Voltage Reference Revenue Share (%), by Application 2025 & 2033
- Figure 16: Europe Shunt Voltage Reference Revenue (billion), by Types 2025 & 2033
- Figure 17: Europe Shunt Voltage Reference Revenue Share (%), by Types 2025 & 2033
- Figure 18: Europe Shunt Voltage Reference Revenue (billion), by Country 2025 & 2033
- Figure 19: Europe Shunt Voltage Reference Revenue Share (%), by Country 2025 & 2033
- Figure 20: Middle East & Africa Shunt Voltage Reference Revenue (billion), by Application 2025 & 2033
- Figure 21: Middle East & Africa Shunt Voltage Reference Revenue Share (%), by Application 2025 & 2033
- Figure 22: Middle East & Africa Shunt Voltage Reference Revenue (billion), by Types 2025 & 2033
- Figure 23: Middle East & Africa Shunt Voltage Reference Revenue Share (%), by Types 2025 & 2033
- Figure 24: Middle East & Africa Shunt Voltage Reference Revenue (billion), by Country 2025 & 2033
- Figure 25: Middle East & Africa Shunt Voltage Reference Revenue Share (%), by Country 2025 & 2033
- Figure 26: Asia Pacific Shunt Voltage Reference Revenue (billion), by Application 2025 & 2033
- Figure 27: Asia Pacific Shunt Voltage Reference Revenue Share (%), by Application 2025 & 2033
- Figure 28: Asia Pacific Shunt Voltage Reference Revenue (billion), by Types 2025 & 2033
- Figure 29: Asia Pacific Shunt Voltage Reference Revenue Share (%), by Types 2025 & 2033
- Figure 30: Asia Pacific Shunt Voltage Reference Revenue (billion), by Country 2025 & 2033
- Figure 31: Asia Pacific Shunt Voltage Reference Revenue Share (%), by Country 2025 & 2033
List of Tables
- Table 1: Global Shunt Voltage Reference Revenue billion Forecast, by Application 2020 & 2033
- Table 2: Global Shunt Voltage Reference Revenue billion Forecast, by Types 2020 & 2033
- Table 3: Global Shunt Voltage Reference Revenue billion Forecast, by Region 2020 & 2033
- Table 4: Global Shunt Voltage Reference Revenue billion Forecast, by Application 2020 & 2033
- Table 5: Global Shunt Voltage Reference Revenue billion Forecast, by Types 2020 & 2033
- Table 6: Global Shunt Voltage Reference Revenue billion Forecast, by Country 2020 & 2033
- Table 7: United States Shunt Voltage Reference Revenue (billion) Forecast, by Application 2020 & 2033
- Table 8: Canada Shunt Voltage Reference Revenue (billion) Forecast, by Application 2020 & 2033
- Table 9: Mexico Shunt Voltage Reference Revenue (billion) Forecast, by Application 2020 & 2033
- Table 10: Global Shunt Voltage Reference Revenue billion Forecast, by Application 2020 & 2033
- Table 11: Global Shunt Voltage Reference Revenue billion Forecast, by Types 2020 & 2033
- Table 12: Global Shunt Voltage Reference Revenue billion Forecast, by Country 2020 & 2033
- Table 13: Brazil Shunt Voltage Reference Revenue (billion) Forecast, by Application 2020 & 2033
- Table 14: Argentina Shunt Voltage Reference Revenue (billion) Forecast, by Application 2020 & 2033
- Table 15: Rest of South America Shunt Voltage Reference Revenue (billion) Forecast, by Application 2020 & 2033
- Table 16: Global Shunt Voltage Reference Revenue billion Forecast, by Application 2020 & 2033
- Table 17: Global Shunt Voltage Reference Revenue billion Forecast, by Types 2020 & 2033
- Table 18: Global Shunt Voltage Reference Revenue billion Forecast, by Country 2020 & 2033
- Table 19: United Kingdom Shunt Voltage Reference Revenue (billion) Forecast, by Application 2020 & 2033
- Table 20: Germany Shunt Voltage Reference Revenue (billion) Forecast, by Application 2020 & 2033
- Table 21: France Shunt Voltage Reference Revenue (billion) Forecast, by Application 2020 & 2033
- Table 22: Italy Shunt Voltage Reference Revenue (billion) Forecast, by Application 2020 & 2033
- Table 23: Spain Shunt Voltage Reference Revenue (billion) Forecast, by Application 2020 & 2033
- Table 24: Russia Shunt Voltage Reference Revenue (billion) Forecast, by Application 2020 & 2033
- Table 25: Benelux Shunt Voltage Reference Revenue (billion) Forecast, by Application 2020 & 2033
- Table 26: Nordics Shunt Voltage Reference Revenue (billion) Forecast, by Application 2020 & 2033
- Table 27: Rest of Europe Shunt Voltage Reference Revenue (billion) Forecast, by Application 2020 & 2033
- Table 28: Global Shunt Voltage Reference Revenue billion Forecast, by Application 2020 & 2033
- Table 29: Global Shunt Voltage Reference Revenue billion Forecast, by Types 2020 & 2033
- Table 30: Global Shunt Voltage Reference Revenue billion Forecast, by Country 2020 & 2033
- Table 31: Turkey Shunt Voltage Reference Revenue (billion) Forecast, by Application 2020 & 2033
- Table 32: Israel Shunt Voltage Reference Revenue (billion) Forecast, by Application 2020 & 2033
- Table 33: GCC Shunt Voltage Reference Revenue (billion) Forecast, by Application 2020 & 2033
- Table 34: North Africa Shunt Voltage Reference Revenue (billion) Forecast, by Application 2020 & 2033
- Table 35: South Africa Shunt Voltage Reference Revenue (billion) Forecast, by Application 2020 & 2033
- Table 36: Rest of Middle East & Africa Shunt Voltage Reference Revenue (billion) Forecast, by Application 2020 & 2033
- Table 37: Global Shunt Voltage Reference Revenue billion Forecast, by Application 2020 & 2033
- Table 38: Global Shunt Voltage Reference Revenue billion Forecast, by Types 2020 & 2033
- Table 39: Global Shunt Voltage Reference Revenue billion Forecast, by Country 2020 & 2033
- Table 40: China Shunt Voltage Reference Revenue (billion) Forecast, by Application 2020 & 2033
- Table 41: India Shunt Voltage Reference Revenue (billion) Forecast, by Application 2020 & 2033
- Table 42: Japan Shunt Voltage Reference Revenue (billion) Forecast, by Application 2020 & 2033
- Table 43: South Korea Shunt Voltage Reference Revenue (billion) Forecast, by Application 2020 & 2033
- Table 44: ASEAN Shunt Voltage Reference Revenue (billion) Forecast, by Application 2020 & 2033
- Table 45: Oceania Shunt Voltage Reference Revenue (billion) Forecast, by Application 2020 & 2033
- Table 46: Rest of Asia Pacific Shunt Voltage Reference Revenue (billion) Forecast, by Application 2020 & 2033
Frequently Asked Questions
1. What is the projected Compound Annual Growth Rate (CAGR) of the Shunt Voltage Reference?
The projected CAGR is approximately 14.15%.
2. Which companies are prominent players in the Shunt Voltage Reference?
Key companies in the market include Amphenol, NXP Semiconductors, Rohm Semiconductors, Texas Instruments, Fairchild Semiconductor, Arrow Electronics, Infineon Technologies, Intersil Corporation, Diodes Incorporated, Methode Electronics, Analog Devices, Maxim Integrated.
3. What are the main segments of the Shunt Voltage Reference?
The market segments include Application, Types.
4. Can you provide details about the market size?
The market size is estimated to be USD 8.46 billion as of 2022.
5. What are some drivers contributing to market growth?
N/A
6. What are the notable trends driving market growth?
N/A
7. Are there any restraints impacting market growth?
N/A
8. Can you provide examples of recent developments in the market?
N/A
9. What pricing options are available for accessing the report?
Pricing options include single-user, multi-user, and enterprise licenses priced at USD 4900.00, USD 7350.00, and USD 9800.00 respectively.
10. Is the market size provided in terms of value or volume?
The market size is provided in terms of value, measured in billion.
11. Are there any specific market keywords associated with the report?
Yes, the market keyword associated with the report is "Shunt Voltage Reference," which aids in identifying and referencing the specific market segment covered.
12. How do I determine which pricing option suits my needs best?
The pricing options vary based on user requirements and access needs. Individual users may opt for single-user licenses, while businesses requiring broader access may choose multi-user or enterprise licenses for cost-effective access to the report.
13. Are there any additional resources or data provided in the Shunt Voltage Reference report?
While the report offers comprehensive insights, it's advisable to review the specific contents or supplementary materials provided to ascertain if additional resources or data are available.
14. How can I stay updated on further developments or reports in the Shunt Voltage Reference?
To stay informed about further developments, trends, and reports in the Shunt Voltage Reference, consider subscribing to industry newsletters, following relevant companies and organizations, or regularly checking reputable industry news sources and publications.
Methodology
Step 1 - Identification of Relevant Samples Size from Population Database


Step 2 - Approaches for Defining Global Market Size (Value, Volume* & Price*)

Note*: In applicable scenarios
Step 3 - Data Sources
Primary Research
- Web Analytics
- Survey Reports
- Research Institute
- Latest Research Reports
- Opinion Leaders
Secondary Research
- Annual Reports
- White Paper
- Latest Press Release
- Industry Association
- Paid Database
- Investor Presentations

Step 4 - Data Triangulation
Involves using different sources of information in order to increase the validity of a study
These sources are likely to be stakeholders in a program - participants, other researchers, program staff, other community members, and so on.
Then we put all data in single framework & apply various statistical tools to find out the dynamic on the market.
During the analysis stage, feedback from the stakeholder groups would be compared to determine areas of agreement as well as areas of divergence