

Key Insights
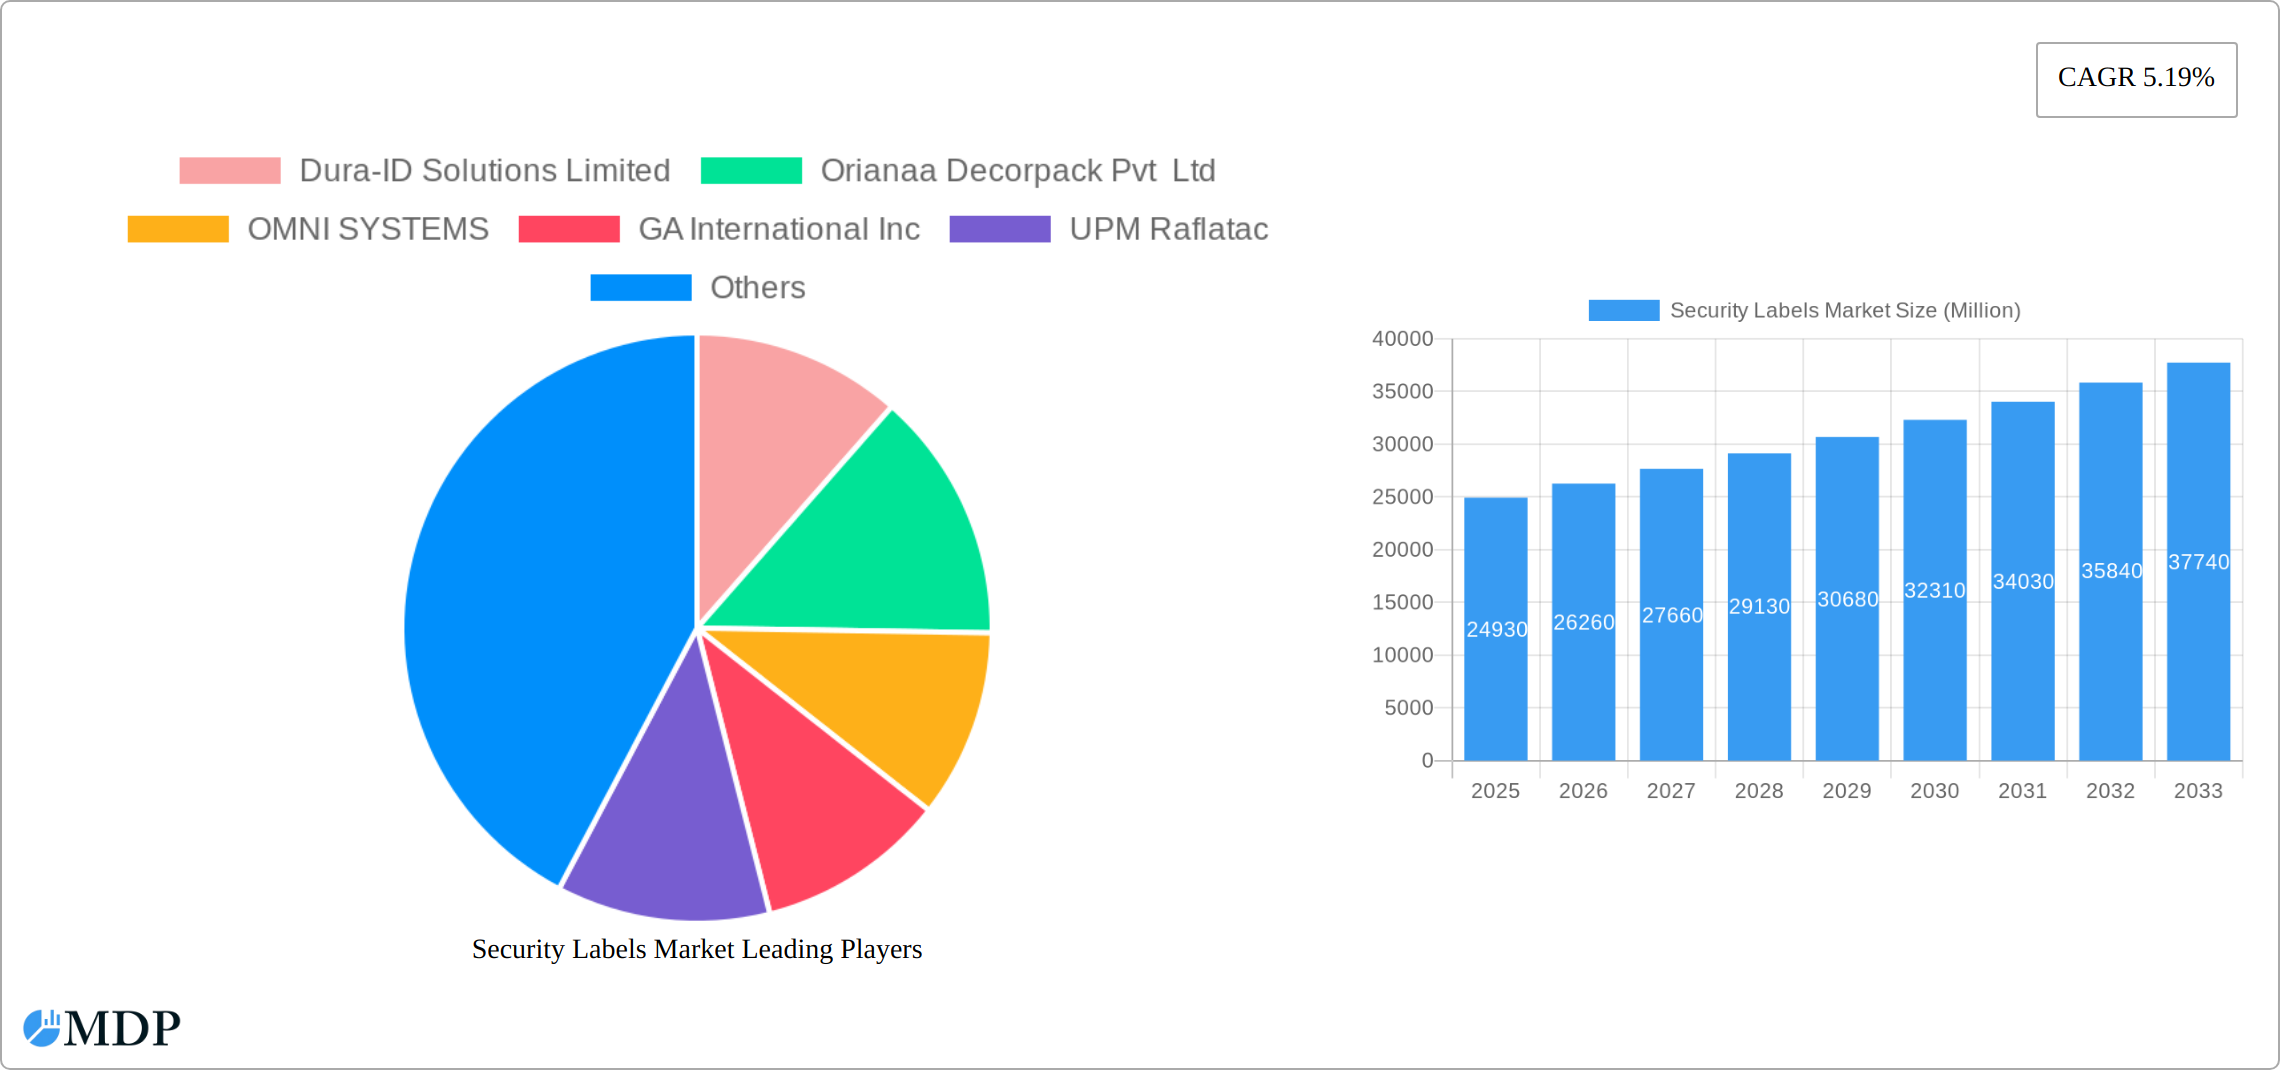
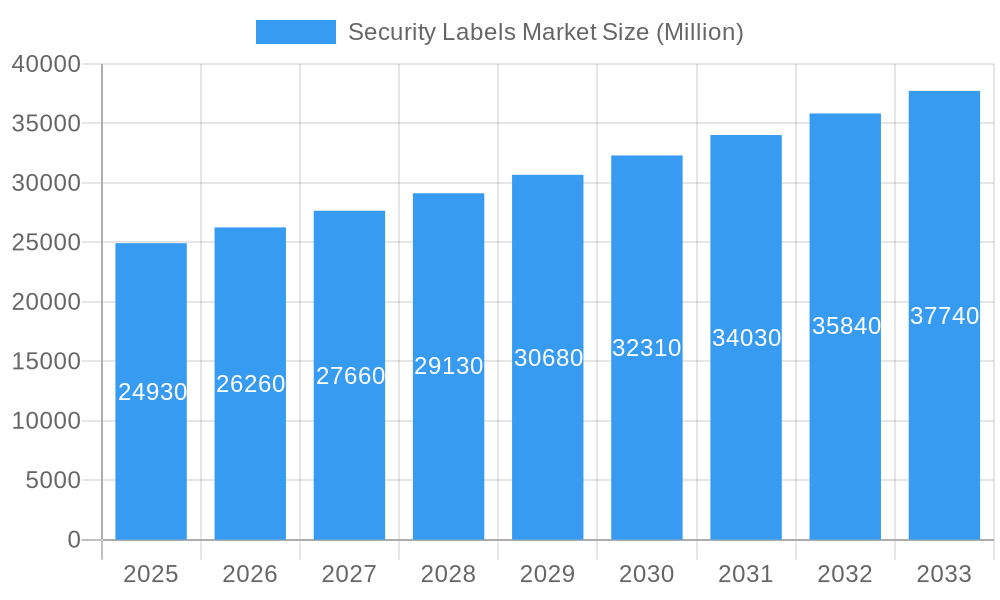
The global security labels market, valued at $24.93 billion in 2025, is projected to experience robust growth, driven by increasing demand for product authentication and brand protection across diverse industries. A compound annual growth rate (CAGR) of 5.19% from 2025 to 2033 indicates a significant expansion, reaching an estimated value exceeding $36 billion by 2033. This growth is fueled by several key factors. The rise in e-commerce and counterfeiting necessitates advanced security features, boosting demand for tamper-evident labels, holograms, and RFID tags. Furthermore, stringent government regulations concerning product traceability and supply chain security are mandating the adoption of security labels across various sectors, particularly pharmaceuticals, electronics, and food & beverage. The growing awareness of brand protection among businesses is another significant driver. The market is segmented by raw material (metal and plastic/polymer labels), mechanism (pressure-sensitive, shrink sleeve, and others), product type (warning/security, branding, weatherproof, asset tags), printing technology (analog and digital), and end-user industry (electronics, food & beverage, automotive, healthcare). Digital printing is gaining traction due to its versatility and cost-effectiveness for customized security labels. The increasing adoption of smart packaging and connected products will further contribute to market expansion in the coming years. While the market shows promising growth, challenges such as the high initial investment for advanced security technologies and the complexity of integrating these solutions into existing supply chains could act as potential restraints. However, technological advancements and innovative solutions addressing these challenges are likely to mitigate their impact.
Security Labels Market Market Size (In Billion)
Geographic expansion offers substantial opportunities. North America and Europe currently hold significant market share, driven by high consumer awareness and stringent regulations. However, Asia-Pacific, particularly China and India, is poised for rapid growth due to increasing industrialization and rising consumer spending. The adoption of advanced security features in developing economies will unlock significant potential. Key players in this market, including 3M, Avery Dennison, and CCL Industries, are continuously investing in research and development to improve label security and integrate new technologies. Strategic partnerships and mergers & acquisitions are expected to further shape the competitive landscape. The market's future hinges on ongoing innovation, technological advancements in security features, and the continued response to increasing counterfeiting and brand protection concerns.
Security Labels Market Company Market Share
Security Labels Market: A Comprehensive Report (2019-2033)
This in-depth report provides a comprehensive analysis of the Security Labels Market, covering market dynamics, industry trends, leading segments, key players, and future outlook. The study period spans from 2019 to 2033, with 2025 as the base and estimated year. This report is invaluable for industry stakeholders, investors, and businesses seeking to understand and capitalize on opportunities within this rapidly evolving market. The market is expected to reach xx Million by 2033, exhibiting a CAGR of xx% during the forecast period (2025-2033).
Security Labels Market Market Dynamics & Concentration
The Security Labels Market exhibits a moderately concentrated landscape, with several key players commanding substantial market share. However, a dynamic ecosystem also includes numerous smaller, specialized firms catering to niche applications. Innovation is a pivotal driver, fueled by advancements in printing technologies (with digital printing experiencing rapid adoption), material science (including the development of sophisticated tamper-evident materials), and smart label technologies (notably RFID integration). Stringent regulatory frameworks, particularly those mandating product safety and traceability, exert considerable influence on market growth trajectories. The market faces competitive pressure from substitute technologies, such as digital watermarking and blockchain solutions. The increasing demand for secure packaging across sensitive sectors, like pharmaceuticals and electronics, significantly propels market expansion. A notable level of mergers and acquisitions (M&A) activity has been observed, with larger companies strategically acquiring smaller entities to bolster their technological capabilities and expand their market reach. This consolidation trend is expected to continue, shaping the competitive dynamics of the market in the coming years.
- Market Share (2025): The top 5 players collectively hold an estimated xx% of the global market share.
- M&A Activity (Past 5 Years): Approximately xx M&A deals have been recorded in the Security Labels Market, reflecting a significant wave of consolidation.
Security Labels Market Industry Trends & Analysis
The Security Labels Market is experiencing robust growth, driven by a surge in demand for product authentication, brand protection, and supply chain security across diverse industries. Disruptive technologies, such as the integration of RFID and other smart label technologies, are fundamentally reshaping the market landscape, enabling real-time tracking and sophisticated security features. A notable shift in consumer preferences towards sustainable and eco-friendly labeling solutions is also influencing market trends. Competitive intensity remains high, with companies focusing on innovation, cost optimization, and strategic alliances to enhance their market positioning. Several factors contribute to this growth, including the rise of e-commerce, increasingly stringent regulations against counterfeiting and to ensure product safety, and a growing demand for tamper-evident labels. The market is adapting to these changes through continuous innovation in materials, printing techniques, and security features.
- CAGR (Forecast Period): The market is projected to grow at a CAGR of xx% during the forecast period.
- Market Penetration (Digital Printing): Digital printing technology is exhibiting strong market penetration, estimated at xx% in 2025, projected to reach xx% by 2033.
Leading Markets & Segments in Security Labels Market
The North American region currently holds the largest market share in the Security Labels Market, driven by strong demand from the healthcare and electronics sectors. Within segments:
- By Raw Material: Plastic/Polymer Labels dominate due to their versatility and cost-effectiveness. Metal Labels hold a smaller but significant niche for high-security applications.
- By Mechanism: Pressure-sensitive labeling is the most prevalent mechanism, while shrink sleeve labeling is gaining traction in certain applications.
- By Product Type: Warning/Security Labels represent the largest segment, reflecting the rising concerns about product safety and counterfeiting.
- By Printing Technology: Digital printing is experiencing rapid growth due to its flexibility and cost-effectiveness for short-run applications.
- By End-user Industry: The electronics industry, followed by the healthcare and food & beverage sectors, are the leading consumers of security labels.
Key Drivers:
- North America: Strong regulatory environment, high adoption of advanced technologies, and robust healthcare and electronics industries.
- Europe: Growing focus on supply chain security and brand protection, coupled with stringent regulatory standards.
- Asia-Pacific: Rapid industrialization, expanding e-commerce sector, and increasing consumer awareness of counterfeit products.
Security Labels Market Product Developments
Recent product innovations focus on integrating advanced technologies like RFID, NFC, and QR codes into security labels, enhancing traceability, authentication, and brand protection capabilities. These developments are targeted at improving supply chain efficiency, reducing counterfeiting, and enhancing consumer trust. Companies are also focusing on developing sustainable and eco-friendly materials for security labels, aligning with growing environmental concerns.
Key Drivers of Security Labels Market Growth
The growth of the Security Labels Market is propelled by several key factors: the escalating prevalence of counterfeiting, stringent regulatory mandates for product traceability and safety, the increasing adoption of digital printing for enhanced customization and cost-effectiveness, and the burgeoning e-commerce sector's demand for secure packaging. The integration of smart technologies like RFID and blockchain further enhances security and functionality, significantly contributing to market expansion. The convergence of these factors creates a robust environment for market growth and innovation.
Challenges in the Security Labels Market Market
The Security Labels Market faces significant challenges, including supply chain disruptions, volatile raw material prices, and intense competition. Navigating varying regulatory landscapes across different regions, adhering to stringent environmental regulations concerning label materials, and keeping pace with rapid technological advancements present substantial obstacles. The persistent challenge of counterfeiting security labels themselves poses a significant threat to market integrity and requires ongoing countermeasures.
Emerging Opportunities in Security Labels Market
The Security Labels Market presents compelling opportunities stemming from technological breakthroughs in material science and digital printing. Strategic collaborations between label manufacturers and technology providers are expected to fuel innovation, leading to new and enhanced security solutions. Expansion into developing economies and a growing focus on sustainable and eco-friendly label solutions are poised to contribute significantly to future market growth. The demand for advanced security features and sustainable practices will drive the development of innovative products and solutions.
Leading Players in the Security Labels Market Sector
- Dura-ID Solutions Limited
- Orianaa Decorpack Pvt Ltd
- OMNI SYSTEMS
- GA International Inc
- UPM Raflatac
- DuPont de Nemours Inc
- Brook + Whittle Ltd
- 3M Company
- CCL Industries Inc
- Avery Dennison Corporation
- Asean Pack
- Computer Imprintable Label Systems Ltd (CISL Ltd)
- LabelTac com
- Brady Corporation
Key Milestones in Security Labels Market Industry
- April 2024: ProMach acquires Etiflex, expanding its pressure-sensitive and RFID label capabilities and entering the Mexican market.
- November 2023: All4Labels launches INTEGRITAG, a dedicated entity for security and intelligent label solutions, combining RFID, holographic, and high-security labeling expertise.
- April 2023: CCL Industries acquires eAgile Inc. (RFID solutions for healthcare) and Alert Systems ApS (anti-theft solutions), strengthening its position in intelligent label technology.
Strategic Outlook for Security Labels Market Market
The Security Labels Market holds significant long-term growth potential, driven by technological advancements and evolving industry needs. Companies focusing on innovation, strategic partnerships, and sustainable solutions are poised to capitalize on this growth. Expansion into emerging markets and the development of next-generation smart labels with enhanced security features will be crucial for success in the years to come.
Security Labels Market Segmentation
-
1. Raw Material
- 1.1. Metal Labels
- 1.2. Plastic/Polymer Labels
-
2. Mechanism
- 2.1. Pressure Sensitive Labelling
- 2.2. Shrink Sleeve Labelling
- 2.3. Other Mechanism
-
3. Product Type
- 3.1. Warning/Security Labels
- 3.2. Branding Labels
- 3.3. Weatherproof Labels
- 3.4. Equipment Asset Tags
- 3.5. Other Product Types
-
4. Printing Technology
- 4.1. Analog Printing
- 4.2. Digital Printing
-
5. End-user Industry
- 5.1. Electronics Industry
- 5.2. Food & Beverage
- 5.3. Automotive
- 5.4. Healthcare
- 5.5. Other End-user Industry
Security Labels Market Segmentation By Geography
-
1. North America
- 1.1. United States
- 1.2. Canada
-
2. Europe
- 2.1. Germany
- 2.2. United Kingdom
- 2.3. France
- 2.4. Spain
-
3. Asia
- 3.1. China
- 3.2. Japan
- 3.3. India
- 3.4. South Korea
- 4. Australia and New Zealand
-
5. Latin America
- 5.1. Brazil
- 5.2. Mexico
- 5.3. Argentina
-
6. Middle East and Africa
- 6.1. United Arab Emirates
- 6.2. Saudi Arabia
- 6.3. South Africa
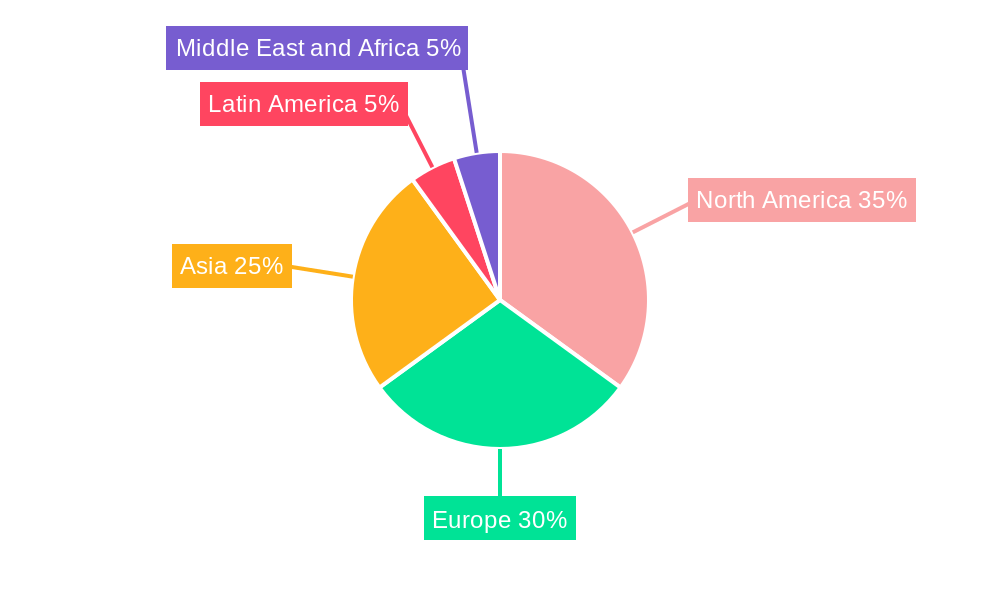
Security Labels Market Regional Market Share
Geographic Coverage of Security Labels Market
Security Labels Market REPORT HIGHLIGHTS
| Aspects | Details |
|---|---|
| Study Period | 2020-2034 |
| Base Year | 2025 |
| Estimated Year | 2026 |
| Forecast Period | 2026-2034 |
| Historical Period | 2020-2025 |
| Growth Rate | CAGR of 5.19% from 2020-2034 |
| Segmentation |
|
Table of Contents
- 1. Introduction
- 1.1. Research Scope
- 1.2. Market Segmentation
- 1.3. Research Objective
- 1.4. Definitions and Assumptions
- 2. Executive Summary
- 2.1. Market Snapshot
- 3. Market Dynamics
- 3.1. Market Drivers
- 3.2. Market Restrains
- 3.3. Market Trends
- 3.4. Market Opportunities
- 4. Market Factor Analysis
- 4.1. Porters Five Forces
- 4.1.1. Bargaining Power of Suppliers
- 4.1.2. Bargaining Power of Buyers
- 4.1.3. Threat of New Entrants
- 4.1.4. Threat of Substitutes
- 4.1.5. Competitive Rivalry
- 4.2. PESTEL analysis
- 4.3. BCG Analysis
- 4.3.1. Stars (High Growth, High Market Share)
- 4.3.2. Cash Cows (Low Growth, High Market Share)
- 4.3.3. Question Mark (High Growth, Low Market Share)
- 4.3.4. Dogs (Low Growth, Low Market Share)
- 4.4. Ansoff Matrix Analysis
- 4.5. Supply Chain Analysis
- 4.6. Regulatory Landscape
- 4.7. Current Market Potential and Opportunity Assessment (TAM–SAM–SOM Framework)
- 4.8. MDP Analyst Note
- 4.1. Porters Five Forces
- 5. Market Analysis, Insights and Forecast 2021-2033
- 5.1. Market Analysis, Insights and Forecast - by Raw Material
- 5.1.1. Metal Labels
- 5.1.2. Plastic/Polymer Labels
- 5.2. Market Analysis, Insights and Forecast - by Mechanism
- 5.2.1. Pressure Sensitive Labelling
- 5.2.2. Shrink Sleeve Labelling
- 5.2.3. Other Mechanism
- 5.3. Market Analysis, Insights and Forecast - by Product Type
- 5.3.1. Warning/Security Labels
- 5.3.2. Branding Labels
- 5.3.3. Weatherproof Labels
- 5.3.4. Equipment Asset Tags
- 5.3.5. Other Product Types
- 5.4. Market Analysis, Insights and Forecast - by Printing Technology
- 5.4.1. Analog Printing
- 5.4.2. Digital Printing
- 5.5. Market Analysis, Insights and Forecast - by End-user Industry
- 5.5.1. Electronics Industry
- 5.5.2. Food & Beverage
- 5.5.3. Automotive
- 5.5.4. Healthcare
- 5.5.5. Other End-user Industry
- 5.6. Market Analysis, Insights and Forecast - by Region
- 5.6.1. North America
- 5.6.2. Europe
- 5.6.3. Asia
- 5.6.4. Australia and New Zealand
- 5.6.5. Latin America
- 5.6.6. Middle East and Africa
- 5.1. Market Analysis, Insights and Forecast - by Raw Material
- 6. Global Security Labels Market Analysis, Insights and Forecast, 2021-2033
- 6.1. Market Analysis, Insights and Forecast - by Raw Material
- 6.1.1. Metal Labels
- 6.1.2. Plastic/Polymer Labels
- 6.2. Market Analysis, Insights and Forecast - by Mechanism
- 6.2.1. Pressure Sensitive Labelling
- 6.2.2. Shrink Sleeve Labelling
- 6.2.3. Other Mechanism
- 6.3. Market Analysis, Insights and Forecast - by Product Type
- 6.3.1. Warning/Security Labels
- 6.3.2. Branding Labels
- 6.3.3. Weatherproof Labels
- 6.3.4. Equipment Asset Tags
- 6.3.5. Other Product Types
- 6.4. Market Analysis, Insights and Forecast - by Printing Technology
- 6.4.1. Analog Printing
- 6.4.2. Digital Printing
- 6.5. Market Analysis, Insights and Forecast - by End-user Industry
- 6.5.1. Electronics Industry
- 6.5.2. Food & Beverage
- 6.5.3. Automotive
- 6.5.4. Healthcare
- 6.5.5. Other End-user Industry
- 6.1. Market Analysis, Insights and Forecast - by Raw Material
- 7. North America Security Labels Market Analysis, Insights and Forecast, 2020-2032
- 7.1. Market Analysis, Insights and Forecast - by Raw Material
- 7.1.1. Metal Labels
- 7.1.2. Plastic/Polymer Labels
- 7.2. Market Analysis, Insights and Forecast - by Mechanism
- 7.2.1. Pressure Sensitive Labelling
- 7.2.2. Shrink Sleeve Labelling
- 7.2.3. Other Mechanism
- 7.3. Market Analysis, Insights and Forecast - by Product Type
- 7.3.1. Warning/Security Labels
- 7.3.2. Branding Labels
- 7.3.3. Weatherproof Labels
- 7.3.4. Equipment Asset Tags
- 7.3.5. Other Product Types
- 7.4. Market Analysis, Insights and Forecast - by Printing Technology
- 7.4.1. Analog Printing
- 7.4.2. Digital Printing
- 7.5. Market Analysis, Insights and Forecast - by End-user Industry
- 7.5.1. Electronics Industry
- 7.5.2. Food & Beverage
- 7.5.3. Automotive
- 7.5.4. Healthcare
- 7.5.5. Other End-user Industry
- 7.1. Market Analysis, Insights and Forecast - by Raw Material
- 8. Europe Security Labels Market Analysis, Insights and Forecast, 2020-2032
- 8.1. Market Analysis, Insights and Forecast - by Raw Material
- 8.1.1. Metal Labels
- 8.1.2. Plastic/Polymer Labels
- 8.2. Market Analysis, Insights and Forecast - by Mechanism
- 8.2.1. Pressure Sensitive Labelling
- 8.2.2. Shrink Sleeve Labelling
- 8.2.3. Other Mechanism
- 8.3. Market Analysis, Insights and Forecast - by Product Type
- 8.3.1. Warning/Security Labels
- 8.3.2. Branding Labels
- 8.3.3. Weatherproof Labels
- 8.3.4. Equipment Asset Tags
- 8.3.5. Other Product Types
- 8.4. Market Analysis, Insights and Forecast - by Printing Technology
- 8.4.1. Analog Printing
- 8.4.2. Digital Printing
- 8.5. Market Analysis, Insights and Forecast - by End-user Industry
- 8.5.1. Electronics Industry
- 8.5.2. Food & Beverage
- 8.5.3. Automotive
- 8.5.4. Healthcare
- 8.5.5. Other End-user Industry
- 8.1. Market Analysis, Insights and Forecast - by Raw Material
- 9. Asia Security Labels Market Analysis, Insights and Forecast, 2020-2032
- 9.1. Market Analysis, Insights and Forecast - by Raw Material
- 9.1.1. Metal Labels
- 9.1.2. Plastic/Polymer Labels
- 9.2. Market Analysis, Insights and Forecast - by Mechanism
- 9.2.1. Pressure Sensitive Labelling
- 9.2.2. Shrink Sleeve Labelling
- 9.2.3. Other Mechanism
- 9.3. Market Analysis, Insights and Forecast - by Product Type
- 9.3.1. Warning/Security Labels
- 9.3.2. Branding Labels
- 9.3.3. Weatherproof Labels
- 9.3.4. Equipment Asset Tags
- 9.3.5. Other Product Types
- 9.4. Market Analysis, Insights and Forecast - by Printing Technology
- 9.4.1. Analog Printing
- 9.4.2. Digital Printing
- 9.5. Market Analysis, Insights and Forecast - by End-user Industry
- 9.5.1. Electronics Industry
- 9.5.2. Food & Beverage
- 9.5.3. Automotive
- 9.5.4. Healthcare
- 9.5.5. Other End-user Industry
- 9.1. Market Analysis, Insights and Forecast - by Raw Material
- 10. Australia and New Zealand Security Labels Market Analysis, Insights and Forecast, 2020-2032
- 10.1. Market Analysis, Insights and Forecast - by Raw Material
- 10.1.1. Metal Labels
- 10.1.2. Plastic/Polymer Labels
- 10.2. Market Analysis, Insights and Forecast - by Mechanism
- 10.2.1. Pressure Sensitive Labelling
- 10.2.2. Shrink Sleeve Labelling
- 10.2.3. Other Mechanism
- 10.3. Market Analysis, Insights and Forecast - by Product Type
- 10.3.1. Warning/Security Labels
- 10.3.2. Branding Labels
- 10.3.3. Weatherproof Labels
- 10.3.4. Equipment Asset Tags
- 10.3.5. Other Product Types
- 10.4. Market Analysis, Insights and Forecast - by Printing Technology
- 10.4.1. Analog Printing
- 10.4.2. Digital Printing
- 10.5. Market Analysis, Insights and Forecast - by End-user Industry
- 10.5.1. Electronics Industry
- 10.5.2. Food & Beverage
- 10.5.3. Automotive
- 10.5.4. Healthcare
- 10.5.5. Other End-user Industry
- 10.1. Market Analysis, Insights and Forecast - by Raw Material
- 11. Latin America Security Labels Market Analysis, Insights and Forecast, 2020-2032
- 11.1. Market Analysis, Insights and Forecast - by Raw Material
- 11.1.1. Metal Labels
- 11.1.2. Plastic/Polymer Labels
- 11.2. Market Analysis, Insights and Forecast - by Mechanism
- 11.2.1. Pressure Sensitive Labelling
- 11.2.2. Shrink Sleeve Labelling
- 11.2.3. Other Mechanism
- 11.3. Market Analysis, Insights and Forecast - by Product Type
- 11.3.1. Warning/Security Labels
- 11.3.2. Branding Labels
- 11.3.3. Weatherproof Labels
- 11.3.4. Equipment Asset Tags
- 11.3.5. Other Product Types
- 11.4. Market Analysis, Insights and Forecast - by Printing Technology
- 11.4.1. Analog Printing
- 11.4.2. Digital Printing
- 11.5. Market Analysis, Insights and Forecast - by End-user Industry
- 11.5.1. Electronics Industry
- 11.5.2. Food & Beverage
- 11.5.3. Automotive
- 11.5.4. Healthcare
- 11.5.5. Other End-user Industry
- 11.1. Market Analysis, Insights and Forecast - by Raw Material
- 12. Middle East and Africa Security Labels Market Analysis, Insights and Forecast, 2020-2032
- 12.1. Market Analysis, Insights and Forecast - by Raw Material
- 12.1.1. Metal Labels
- 12.1.2. Plastic/Polymer Labels
- 12.2. Market Analysis, Insights and Forecast - by Mechanism
- 12.2.1. Pressure Sensitive Labelling
- 12.2.2. Shrink Sleeve Labelling
- 12.2.3. Other Mechanism
- 12.3. Market Analysis, Insights and Forecast - by Product Type
- 12.3.1. Warning/Security Labels
- 12.3.2. Branding Labels
- 12.3.3. Weatherproof Labels
- 12.3.4. Equipment Asset Tags
- 12.3.5. Other Product Types
- 12.4. Market Analysis, Insights and Forecast - by Printing Technology
- 12.4.1. Analog Printing
- 12.4.2. Digital Printing
- 12.5. Market Analysis, Insights and Forecast - by End-user Industry
- 12.5.1. Electronics Industry
- 12.5.2. Food & Beverage
- 12.5.3. Automotive
- 12.5.4. Healthcare
- 12.5.5. Other End-user Industry
- 12.1. Market Analysis, Insights and Forecast - by Raw Material
- 13. Competitive Analysis
- 13.1. Company Profiles
- 13.1.1 Dura-ID Solutions Limited
- 13.1.1.1. Company Overview
- 13.1.1.2. Products
- 13.1.1.3. Company Financials
- 13.1.1.4. SWOT Analysis
- 13.1.2 Orianaa Decorpack Pvt Ltd
- 13.1.2.1. Company Overview
- 13.1.2.2. Products
- 13.1.2.3. Company Financials
- 13.1.2.4. SWOT Analysis
- 13.1.3 OMNI SYSTEMS
- 13.1.3.1. Company Overview
- 13.1.3.2. Products
- 13.1.3.3. Company Financials
- 13.1.3.4. SWOT Analysis
- 13.1.4 GA International Inc
- 13.1.4.1. Company Overview
- 13.1.4.2. Products
- 13.1.4.3. Company Financials
- 13.1.4.4. SWOT Analysis
- 13.1.5 UPM Raflatac
- 13.1.5.1. Company Overview
- 13.1.5.2. Products
- 13.1.5.3. Company Financials
- 13.1.5.4. SWOT Analysis
- 13.1.6 DuPont de Nemours Inc
- 13.1.6.1. Company Overview
- 13.1.6.2. Products
- 13.1.6.3. Company Financials
- 13.1.6.4. SWOT Analysis
- 13.1.7 Brook + Whittle Ltd
- 13.1.7.1. Company Overview
- 13.1.7.2. Products
- 13.1.7.3. Company Financials
- 13.1.7.4. SWOT Analysis
- 13.1.8 3M Company
- 13.1.8.1. Company Overview
- 13.1.8.2. Products
- 13.1.8.3. Company Financials
- 13.1.8.4. SWOT Analysis
- 13.1.9 CCL Industries Inc
- 13.1.9.1. Company Overview
- 13.1.9.2. Products
- 13.1.9.3. Company Financials
- 13.1.9.4. SWOT Analysis
- 13.1.10 Avery Dennison Corporation
- 13.1.10.1. Company Overview
- 13.1.10.2. Products
- 13.1.10.3. Company Financials
- 13.1.10.4. SWOT Analysis
- 13.1.11 Asean Pack
- 13.1.11.1. Company Overview
- 13.1.11.2. Products
- 13.1.11.3. Company Financials
- 13.1.11.4. SWOT Analysis
- 13.1.12 Computer Imprintable Label Systems Ltd (CISL Ltd)
- 13.1.12.1. Company Overview
- 13.1.12.2. Products
- 13.1.12.3. Company Financials
- 13.1.12.4. SWOT Analysis
- 13.1.13 LabelTac com
- 13.1.13.1. Company Overview
- 13.1.13.2. Products
- 13.1.13.3. Company Financials
- 13.1.13.4. SWOT Analysis
- 13.1.14 Brady Corporation
- 13.1.14.1. Company Overview
- 13.1.14.2. Products
- 13.1.14.3. Company Financials
- 13.1.14.4. SWOT Analysis
- 13.1.1 Dura-ID Solutions Limited
- 13.2. Market Entropy
- 13.2.1 Company's Key Areas Served
- 13.2.2 Recent Developments
- 13.3. Company Market Share Analysis 2025
- 13.3.1 Top 5 Companies Market Share Analysis
- 13.3.2 Top 3 Companies Market Share Analysis
- 13.4. List of Potential Customers
- 14. Research Methodology
List of Figures
- Figure 1: Global Security Labels Market Revenue Breakdown (Million, %) by Region 2025 & 2033
- Figure 2: North America Security Labels Market Revenue (Million), by Raw Material 2025 & 2033
- Figure 3: North America Security Labels Market Revenue Share (%), by Raw Material 2025 & 2033
- Figure 4: North America Security Labels Market Revenue (Million), by Mechanism 2025 & 2033
- Figure 5: North America Security Labels Market Revenue Share (%), by Mechanism 2025 & 2033
- Figure 6: North America Security Labels Market Revenue (Million), by Product Type 2025 & 2033
- Figure 7: North America Security Labels Market Revenue Share (%), by Product Type 2025 & 2033
- Figure 8: North America Security Labels Market Revenue (Million), by Printing Technology 2025 & 2033
- Figure 9: North America Security Labels Market Revenue Share (%), by Printing Technology 2025 & 2033
- Figure 10: North America Security Labels Market Revenue (Million), by End-user Industry 2025 & 2033
- Figure 11: North America Security Labels Market Revenue Share (%), by End-user Industry 2025 & 2033
- Figure 12: North America Security Labels Market Revenue (Million), by Country 2025 & 2033
- Figure 13: North America Security Labels Market Revenue Share (%), by Country 2025 & 2033
- Figure 14: Europe Security Labels Market Revenue (Million), by Raw Material 2025 & 2033
- Figure 15: Europe Security Labels Market Revenue Share (%), by Raw Material 2025 & 2033
- Figure 16: Europe Security Labels Market Revenue (Million), by Mechanism 2025 & 2033
- Figure 17: Europe Security Labels Market Revenue Share (%), by Mechanism 2025 & 2033
- Figure 18: Europe Security Labels Market Revenue (Million), by Product Type 2025 & 2033
- Figure 19: Europe Security Labels Market Revenue Share (%), by Product Type 2025 & 2033
- Figure 20: Europe Security Labels Market Revenue (Million), by Printing Technology 2025 & 2033
- Figure 21: Europe Security Labels Market Revenue Share (%), by Printing Technology 2025 & 2033
- Figure 22: Europe Security Labels Market Revenue (Million), by End-user Industry 2025 & 2033
- Figure 23: Europe Security Labels Market Revenue Share (%), by End-user Industry 2025 & 2033
- Figure 24: Europe Security Labels Market Revenue (Million), by Country 2025 & 2033
- Figure 25: Europe Security Labels Market Revenue Share (%), by Country 2025 & 2033
- Figure 26: Asia Security Labels Market Revenue (Million), by Raw Material 2025 & 2033
- Figure 27: Asia Security Labels Market Revenue Share (%), by Raw Material 2025 & 2033
- Figure 28: Asia Security Labels Market Revenue (Million), by Mechanism 2025 & 2033
- Figure 29: Asia Security Labels Market Revenue Share (%), by Mechanism 2025 & 2033
- Figure 30: Asia Security Labels Market Revenue (Million), by Product Type 2025 & 2033
- Figure 31: Asia Security Labels Market Revenue Share (%), by Product Type 2025 & 2033
- Figure 32: Asia Security Labels Market Revenue (Million), by Printing Technology 2025 & 2033
- Figure 33: Asia Security Labels Market Revenue Share (%), by Printing Technology 2025 & 2033
- Figure 34: Asia Security Labels Market Revenue (Million), by End-user Industry 2025 & 2033
- Figure 35: Asia Security Labels Market Revenue Share (%), by End-user Industry 2025 & 2033
- Figure 36: Asia Security Labels Market Revenue (Million), by Country 2025 & 2033
- Figure 37: Asia Security Labels Market Revenue Share (%), by Country 2025 & 2033
- Figure 38: Australia and New Zealand Security Labels Market Revenue (Million), by Raw Material 2025 & 2033
- Figure 39: Australia and New Zealand Security Labels Market Revenue Share (%), by Raw Material 2025 & 2033
- Figure 40: Australia and New Zealand Security Labels Market Revenue (Million), by Mechanism 2025 & 2033
- Figure 41: Australia and New Zealand Security Labels Market Revenue Share (%), by Mechanism 2025 & 2033
- Figure 42: Australia and New Zealand Security Labels Market Revenue (Million), by Product Type 2025 & 2033
- Figure 43: Australia and New Zealand Security Labels Market Revenue Share (%), by Product Type 2025 & 2033
- Figure 44: Australia and New Zealand Security Labels Market Revenue (Million), by Printing Technology 2025 & 2033
- Figure 45: Australia and New Zealand Security Labels Market Revenue Share (%), by Printing Technology 2025 & 2033
- Figure 46: Australia and New Zealand Security Labels Market Revenue (Million), by End-user Industry 2025 & 2033
- Figure 47: Australia and New Zealand Security Labels Market Revenue Share (%), by End-user Industry 2025 & 2033
- Figure 48: Australia and New Zealand Security Labels Market Revenue (Million), by Country 2025 & 2033
- Figure 49: Australia and New Zealand Security Labels Market Revenue Share (%), by Country 2025 & 2033
- Figure 50: Latin America Security Labels Market Revenue (Million), by Raw Material 2025 & 2033
- Figure 51: Latin America Security Labels Market Revenue Share (%), by Raw Material 2025 & 2033
- Figure 52: Latin America Security Labels Market Revenue (Million), by Mechanism 2025 & 2033
- Figure 53: Latin America Security Labels Market Revenue Share (%), by Mechanism 2025 & 2033
- Figure 54: Latin America Security Labels Market Revenue (Million), by Product Type 2025 & 2033
- Figure 55: Latin America Security Labels Market Revenue Share (%), by Product Type 2025 & 2033
- Figure 56: Latin America Security Labels Market Revenue (Million), by Printing Technology 2025 & 2033
- Figure 57: Latin America Security Labels Market Revenue Share (%), by Printing Technology 2025 & 2033
- Figure 58: Latin America Security Labels Market Revenue (Million), by End-user Industry 2025 & 2033
- Figure 59: Latin America Security Labels Market Revenue Share (%), by End-user Industry 2025 & 2033
- Figure 60: Latin America Security Labels Market Revenue (Million), by Country 2025 & 2033
- Figure 61: Latin America Security Labels Market Revenue Share (%), by Country 2025 & 2033
- Figure 62: Middle East and Africa Security Labels Market Revenue (Million), by Raw Material 2025 & 2033
- Figure 63: Middle East and Africa Security Labels Market Revenue Share (%), by Raw Material 2025 & 2033
- Figure 64: Middle East and Africa Security Labels Market Revenue (Million), by Mechanism 2025 & 2033
- Figure 65: Middle East and Africa Security Labels Market Revenue Share (%), by Mechanism 2025 & 2033
- Figure 66: Middle East and Africa Security Labels Market Revenue (Million), by Product Type 2025 & 2033
- Figure 67: Middle East and Africa Security Labels Market Revenue Share (%), by Product Type 2025 & 2033
- Figure 68: Middle East and Africa Security Labels Market Revenue (Million), by Printing Technology 2025 & 2033
- Figure 69: Middle East and Africa Security Labels Market Revenue Share (%), by Printing Technology 2025 & 2033
- Figure 70: Middle East and Africa Security Labels Market Revenue (Million), by End-user Industry 2025 & 2033
- Figure 71: Middle East and Africa Security Labels Market Revenue Share (%), by End-user Industry 2025 & 2033
- Figure 72: Middle East and Africa Security Labels Market Revenue (Million), by Country 2025 & 2033
- Figure 73: Middle East and Africa Security Labels Market Revenue Share (%), by Country 2025 & 2033
List of Tables
- Table 1: Global Security Labels Market Revenue Million Forecast, by Raw Material 2020 & 2033
- Table 2: Global Security Labels Market Revenue Million Forecast, by Mechanism 2020 & 2033
- Table 3: Global Security Labels Market Revenue Million Forecast, by Product Type 2020 & 2033
- Table 4: Global Security Labels Market Revenue Million Forecast, by Printing Technology 2020 & 2033
- Table 5: Global Security Labels Market Revenue Million Forecast, by End-user Industry 2020 & 2033
- Table 6: Global Security Labels Market Revenue Million Forecast, by Region 2020 & 2033
- Table 7: Global Security Labels Market Revenue Million Forecast, by Raw Material 2020 & 2033
- Table 8: Global Security Labels Market Revenue Million Forecast, by Mechanism 2020 & 2033
- Table 9: Global Security Labels Market Revenue Million Forecast, by Product Type 2020 & 2033
- Table 10: Global Security Labels Market Revenue Million Forecast, by Printing Technology 2020 & 2033
- Table 11: Global Security Labels Market Revenue Million Forecast, by End-user Industry 2020 & 2033
- Table 12: Global Security Labels Market Revenue Million Forecast, by Country 2020 & 2033
- Table 13: United States Security Labels Market Revenue (Million) Forecast, by Application 2020 & 2033
- Table 14: Canada Security Labels Market Revenue (Million) Forecast, by Application 2020 & 2033
- Table 15: Global Security Labels Market Revenue Million Forecast, by Raw Material 2020 & 2033
- Table 16: Global Security Labels Market Revenue Million Forecast, by Mechanism 2020 & 2033
- Table 17: Global Security Labels Market Revenue Million Forecast, by Product Type 2020 & 2033
- Table 18: Global Security Labels Market Revenue Million Forecast, by Printing Technology 2020 & 2033
- Table 19: Global Security Labels Market Revenue Million Forecast, by End-user Industry 2020 & 2033
- Table 20: Global Security Labels Market Revenue Million Forecast, by Country 2020 & 2033
- Table 21: Germany Security Labels Market Revenue (Million) Forecast, by Application 2020 & 2033
- Table 22: United Kingdom Security Labels Market Revenue (Million) Forecast, by Application 2020 & 2033
- Table 23: France Security Labels Market Revenue (Million) Forecast, by Application 2020 & 2033
- Table 24: Spain Security Labels Market Revenue (Million) Forecast, by Application 2020 & 2033
- Table 25: Global Security Labels Market Revenue Million Forecast, by Raw Material 2020 & 2033
- Table 26: Global Security Labels Market Revenue Million Forecast, by Mechanism 2020 & 2033
- Table 27: Global Security Labels Market Revenue Million Forecast, by Product Type 2020 & 2033
- Table 28: Global Security Labels Market Revenue Million Forecast, by Printing Technology 2020 & 2033
- Table 29: Global Security Labels Market Revenue Million Forecast, by End-user Industry 2020 & 2033
- Table 30: Global Security Labels Market Revenue Million Forecast, by Country 2020 & 2033
- Table 31: China Security Labels Market Revenue (Million) Forecast, by Application 2020 & 2033
- Table 32: Japan Security Labels Market Revenue (Million) Forecast, by Application 2020 & 2033
- Table 33: India Security Labels Market Revenue (Million) Forecast, by Application 2020 & 2033
- Table 34: South Korea Security Labels Market Revenue (Million) Forecast, by Application 2020 & 2033
- Table 35: Global Security Labels Market Revenue Million Forecast, by Raw Material 2020 & 2033
- Table 36: Global Security Labels Market Revenue Million Forecast, by Mechanism 2020 & 2033
- Table 37: Global Security Labels Market Revenue Million Forecast, by Product Type 2020 & 2033
- Table 38: Global Security Labels Market Revenue Million Forecast, by Printing Technology 2020 & 2033
- Table 39: Global Security Labels Market Revenue Million Forecast, by End-user Industry 2020 & 2033
- Table 40: Global Security Labels Market Revenue Million Forecast, by Country 2020 & 2033
- Table 41: Global Security Labels Market Revenue Million Forecast, by Raw Material 2020 & 2033
- Table 42: Global Security Labels Market Revenue Million Forecast, by Mechanism 2020 & 2033
- Table 43: Global Security Labels Market Revenue Million Forecast, by Product Type 2020 & 2033
- Table 44: Global Security Labels Market Revenue Million Forecast, by Printing Technology 2020 & 2033
- Table 45: Global Security Labels Market Revenue Million Forecast, by End-user Industry 2020 & 2033
- Table 46: Global Security Labels Market Revenue Million Forecast, by Country 2020 & 2033
- Table 47: Brazil Security Labels Market Revenue (Million) Forecast, by Application 2020 & 2033
- Table 48: Mexico Security Labels Market Revenue (Million) Forecast, by Application 2020 & 2033
- Table 49: Argentina Security Labels Market Revenue (Million) Forecast, by Application 2020 & 2033
- Table 50: Global Security Labels Market Revenue Million Forecast, by Raw Material 2020 & 2033
- Table 51: Global Security Labels Market Revenue Million Forecast, by Mechanism 2020 & 2033
- Table 52: Global Security Labels Market Revenue Million Forecast, by Product Type 2020 & 2033
- Table 53: Global Security Labels Market Revenue Million Forecast, by Printing Technology 2020 & 2033
- Table 54: Global Security Labels Market Revenue Million Forecast, by End-user Industry 2020 & 2033
- Table 55: Global Security Labels Market Revenue Million Forecast, by Country 2020 & 2033
- Table 56: United Arab Emirates Security Labels Market Revenue (Million) Forecast, by Application 2020 & 2033
- Table 57: Saudi Arabia Security Labels Market Revenue (Million) Forecast, by Application 2020 & 2033
- Table 58: South Africa Security Labels Market Revenue (Million) Forecast, by Application 2020 & 2033
Frequently Asked Questions
1. What is the projected Compound Annual Growth Rate (CAGR) of the Security Labels Market?
The projected CAGR is approximately 5.19%.
2. Which companies are prominent players in the Security Labels Market?
Key companies in the market include Dura-ID Solutions Limited, Orianaa Decorpack Pvt Ltd, OMNI SYSTEMS, GA International Inc, UPM Raflatac, DuPont de Nemours Inc, Brook + Whittle Ltd, 3M Company, CCL Industries Inc, Avery Dennison Corporation, Asean Pack, Computer Imprintable Label Systems Ltd (CISL Ltd), LabelTac com, Brady Corporation.
3. What are the main segments of the Security Labels Market?
The market segments include Raw Material, Mechanism, Product Type, Printing Technology, End-user Industry.
4. Can you provide details about the market size?
The market size is estimated to be USD 24.93 Million as of 2022.
5. What are some drivers contributing to market growth?
Food and Beverage is Expected to Register Significant Growth; APAC to Witness Significant Growth.
6. What are the notable trends driving market growth?
Warning/Security Labels is Expected to Register a Significant Growth.
7. Are there any restraints impacting market growth?
Increasing Cost of Raw Materials.
8. Can you provide examples of recent developments in the market?
April 2024: ProMach, a prominent global player in the manufacturing and distribution of processing and packaging equipment, announced the acquisition of Etiflex, a well-known producer of pressure-sensitive and RFID labels. This acquisition enhances ProMach's labeling and coding expertise across North America and marks the company's initial foray into the Mexican market.
9. What pricing options are available for accessing the report?
Pricing options include single-user, multi-user, and enterprise licenses priced at USD 4750, USD 5250, and USD 8750 respectively.
10. Is the market size provided in terms of value or volume?
The market size is provided in terms of value, measured in Million.
11. Are there any specific market keywords associated with the report?
Yes, the market keyword associated with the report is "Security Labels Market," which aids in identifying and referencing the specific market segment covered.
12. How do I determine which pricing option suits my needs best?
The pricing options vary based on user requirements and access needs. Individual users may opt for single-user licenses, while businesses requiring broader access may choose multi-user or enterprise licenses for cost-effective access to the report.
13. Are there any additional resources or data provided in the Security Labels Market report?
While the report offers comprehensive insights, it's advisable to review the specific contents or supplementary materials provided to ascertain if additional resources or data are available.
14. How can I stay updated on further developments or reports in the Security Labels Market?
To stay informed about further developments, trends, and reports in the Security Labels Market, consider subscribing to industry newsletters, following relevant companies and organizations, or regularly checking reputable industry news sources and publications.
Methodology
Step 1 - Identification of Relevant Samples Size from Population Database


Step 2 - Approaches for Defining Global Market Size (Value, Volume* & Price*)

Note*: In applicable scenarios
Step 3 - Data Sources
Primary Research
- Web Analytics
- Survey Reports
- Research Institute
- Latest Research Reports
- Opinion Leaders
Secondary Research
- Annual Reports
- White Paper
- Latest Press Release
- Industry Association
- Paid Database
- Investor Presentations

Step 4 - Data Triangulation
Involves using different sources of information in order to increase the validity of a study
These sources are likely to be stakeholders in a program - participants, other researchers, program staff, other community members, and so on.
Then we put all data in single framework & apply various statistical tools to find out the dynamic on the market.
During the analysis stage, feedback from the stakeholder groups would be compared to determine areas of agreement as well as areas of divergence