

Key Insights
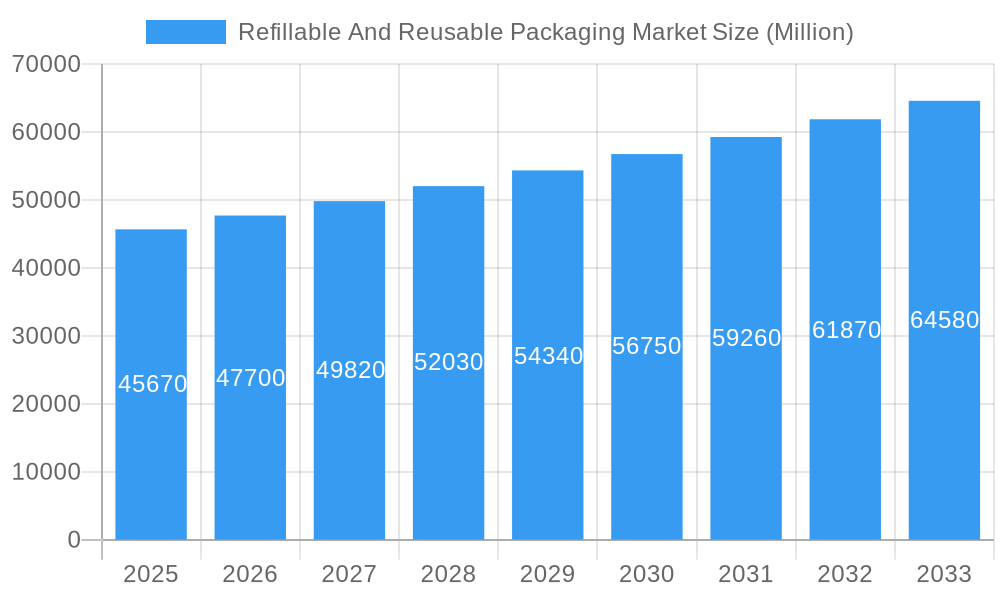
The refillable and reusable packaging market, currently valued at $45.67 billion in 2025, is experiencing robust growth, projected to expand at a compound annual growth rate (CAGR) of 4.43% from 2025 to 2033. This expansion is driven by a confluence of factors, including the increasing consumer awareness of environmental sustainability and the resulting demand for eco-friendly packaging solutions. Government regulations aimed at reducing plastic waste and promoting circular economy initiatives are further bolstering market growth. The food and beverage sector is a significant driver, with companies increasingly adopting reusable containers for delivery and takeout services. Similarly, the cosmetics and personal care industry is witnessing a shift towards refillable packaging formats to minimize waste and enhance brand image. Growth is also propelled by innovations in material science, with the development of durable and lightweight alternatives to traditional packaging materials, such as biodegradable plastics and recycled paperboard. Competitive landscape analysis reveals key players like Nefab Group, Smurfit Kappa Group, and Amcor PLC actively investing in research and development, expanding their product portfolios, and forging strategic partnerships to capitalize on this burgeoning market.
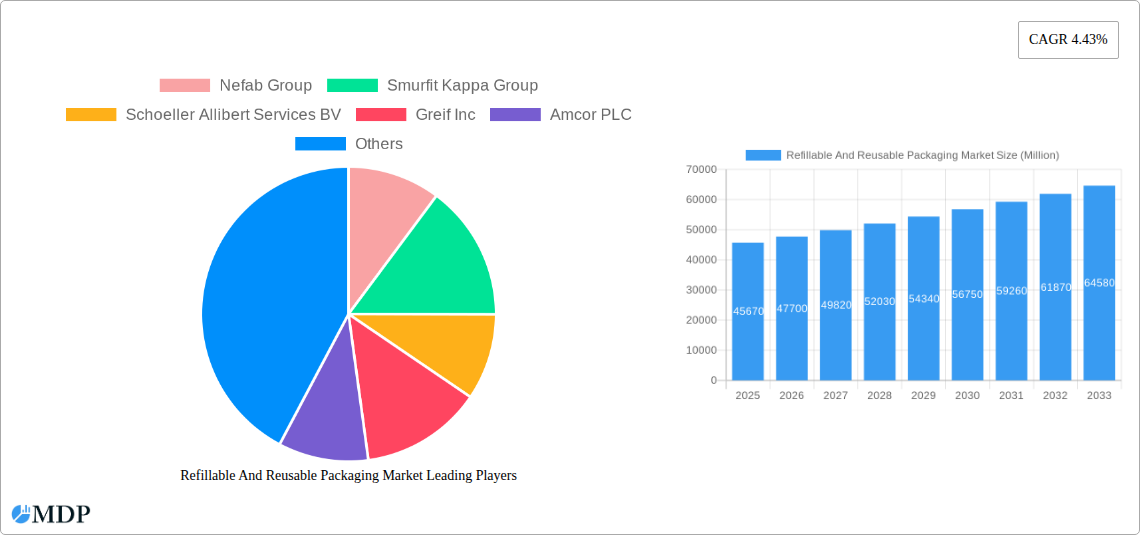
Refillable And Reusable Packaging Market Market Size (In Billion)
However, the market faces certain challenges. The relatively higher initial cost of reusable packaging compared to single-use alternatives could hinder adoption among price-sensitive consumers. Furthermore, the logistical complexities associated with cleaning, sanitizing, and efficiently managing the return and reuse of packaging present operational hurdles for businesses. Overcoming these challenges requires collaboration between packaging manufacturers, retailers, and consumers to create robust and efficient return systems and promote consumer education on the benefits of refillable and reusable options. Despite these restraints, the long-term outlook for the refillable and reusable packaging market remains exceptionally positive, driven by a growing consumer preference for sustainable and environmentally conscious products and a global push towards a circular economy model. The market segmentation reveals strong growth across various end-user industries and materials, indicating the wide-ranging applicability and future potential of this sector.
Refillable And Reusable Packaging Market Company Market Share
Refillable and Reusable Packaging Market: A Comprehensive Report (2019-2033)
This comprehensive report provides an in-depth analysis of the refillable and reusable packaging market, offering actionable insights for stakeholders across the value chain. With a study period spanning 2019-2033, a base year of 2025, and a forecast period of 2025-2033, this report leverages extensive market research and data analysis to deliver a clear understanding of current market dynamics and future growth potential. The market is projected to reach xx Million by 2033, exhibiting a CAGR of xx% during the forecast period.
Refillable And Reusable Packaging Market Market Dynamics & Concentration
The refillable and reusable packaging market is experiencing significant growth driven by increasing environmental concerns, stringent regulations, and a growing consumer preference for sustainable products. Market concentration is moderate, with several key players holding substantial market share, while a number of smaller, specialized companies are also active. The market is characterized by ongoing innovation in materials, designs, and technologies, leading to the development of more efficient and sustainable packaging solutions. Regulatory frameworks, particularly those focused on reducing plastic waste and promoting circular economy models, are further accelerating market growth. Product substitution, with reusable packaging replacing single-use alternatives, is a key trend. Mergers and acquisitions (M&A) activity is relatively high, indicating a dynamic and competitive landscape. For example, Nefab Group's acquisition of PolyFlex Products Inc. in June 2023 strengthened its position in reusable packaging solutions.
- Market Concentration: Moderate, with top 5 players holding approximately xx% of the market share in 2025.
- Innovation Drivers: Development of lightweight, durable materials; advancements in logistics and collection systems; integrated digital tracking solutions.
- Regulatory Frameworks: Growing number of policies promoting reusable packaging and reducing single-use plastics.
- Product Substitutes: Single-use packaging options, compostable alternatives.
- End-User Trends: Increased demand for sustainable and eco-friendly packaging from environmentally conscious consumers.
- M&A Activity: Significant M&A activity in recent years, with xx deals recorded between 2019 and 2024.
Refillable And Reusable Packaging Market Industry Trends & Analysis
The refillable and reusable packaging market is experiencing robust growth, fueled by several key trends. The increasing awareness of environmental sustainability is a major driver, pushing consumers and businesses to adopt eco-friendly alternatives. Technological advancements, such as improved material science and advanced logistics systems, are enhancing the efficiency and practicality of reusable packaging solutions. Changing consumer preferences, with a growing demand for convenience and transparency, are shaping the market landscape. Competitive dynamics are intensifying, with companies investing in innovation and sustainability initiatives to gain a competitive edge. The market is witnessing a shift towards circular economy models, encouraging reuse, recycling, and waste reduction. The CAGR for the market during the forecast period is estimated at xx%. Market penetration of reusable packaging in key sectors, such as food and beverage, is projected to increase from xx% in 2025 to xx% by 2033.
Leading Markets & Segments in Refillable And Reusable Packaging Market
The Food and Beverage segment dominates the refillable and reusable packaging market, driven by increasing consumer demand for sustainable food packaging options and stricter regulations on single-use plastics in this sector. Within materials, plastic currently holds the largest market share due to its versatility and cost-effectiveness, although the market share of alternative materials like paper and paperboard is growing rapidly, pushed by sustainability concerns. Bottles and containers are the leading product type, owing to their widespread use in food and beverage, cosmetics, and household care applications. Geographically, Western Europe and North America are currently the leading regions, while Asia-Pacific is projected to show strong growth in the forecast period.
- By End-user Industry:
- Food and Beverage: High demand for sustainable packaging and stringent regulations.
- Cosmetics and Personal Care: Growing emphasis on eco-friendly and refillable options.
- Household Care: Increasing adoption of concentrated refills and reusable containers.
- By Material:
- Plastic: High versatility and cost-effectiveness, though facing environmental concerns.
- Paper and Paperboard: Growing market share driven by sustainability initiatives.
- Metal: Niche applications, particularly in durable goods and industrial sectors.
- By Product:
- Bottles and Containers: Dominant product type across various end-user industries.
- Pallets and Crates: High demand in logistics and industrial applications.
Refillable And Reusable Packaging Market Product Developments
Recent innovations focus on developing lightweight, durable, and easily cleanable reusable packaging using recycled and renewable materials. Technological advancements like digital tracking and traceability systems are enhancing the efficiency and effectiveness of reusable packaging systems. New designs focus on improved ergonomics, stackability, and compatibility with existing infrastructure. The market is witnessing a growing trend towards modular and adaptable packaging systems that can be used for various products and applications. For instance, Berry Global Inc.'s launch of a 14-liter HDPE reusable container for refill packaging solutions reflects this trend.
Key Drivers of Refillable And Reusable Packaging Market Growth
The market is propelled by several key factors. Growing consumer awareness of environmental issues and a preference for sustainable products are primary drivers. Stringent government regulations aimed at reducing plastic waste and promoting circular economy models are significantly impacting market growth. Technological advancements in materials science and logistics are making reusable packaging more efficient and cost-effective. Furthermore, increasing corporate social responsibility initiatives are pushing businesses to adopt sustainable packaging solutions to enhance their brand image.
Challenges in the Refillable And Reusable Packaging Market Market
The market faces several challenges. High initial investment costs associated with reusable packaging systems can be a barrier to entry for some businesses. Effective logistics and collection infrastructure is crucial for successful implementation of reusable packaging systems, and the lack of such infrastructure in certain regions poses a significant challenge. Competition from single-use packaging options, which are often cheaper and more readily available, remains a considerable obstacle. The cost of cleaning and sanitizing reusable packaging also impacts adoption.
Emerging Opportunities in Refillable And Reusable Packaging Market
Significant opportunities exist for market expansion. The development of innovative and sustainable materials, such as bioplastics and compostable materials, opens new avenues for growth. Strategic partnerships between packaging manufacturers, retailers, and logistics providers can create efficient and cost-effective reusable packaging systems. Expanding into developing markets with growing environmental awareness presents a significant opportunity for growth. Advancements in digital technologies for tracking and managing reusable packaging further create opportunities.
Leading Players in the Refillable And Reusable Packaging Market Sector
- Nefab Group
- Smurfit Kappa Group
- Schoeller Allibert Services BV
- Greif Inc
- Amcor PLC
- Mondi PLC
- IPL Inc
- IFCO Systems
- Petainer Ltd
- Bormioli Luigi Corporation
- Vetropack Holding Ltd
- Jiangmen UA Packaging Co Lt
- GWP Group
- Refillism
- Berry Global Inc
- Orbis Corporation
- International Paper
Key Milestones in Refillable And Reusable Packaging Market Industry
- June 2023: Nefab Group AB acquired PolyFlex Products Inc., expanding its presence in reusable packaging solutions. This acquisition significantly bolstered Nefab's market position, particularly within the industrial sector.
- October 2023: Berry Global Inc. launched a 14-liter HDPE reusable container as part of a new refill packaging solution piloted at Aldi UK. This launch showcases the growing interest in innovative and sustainable refill systems.
Strategic Outlook for Refillable And Reusable Packaging Market Market
The refillable and reusable packaging market holds immense potential for future growth. Continued innovation in materials and technologies will drive efficiency and cost-effectiveness. Strategic collaborations across the value chain will be essential for streamlining logistics and promoting widespread adoption. Focus on circular economy principles and environmentally conscious practices will further accelerate market expansion. The market is poised for substantial growth driven by increasing consumer demand, regulatory pressures, and ongoing technological advancements.
Refillable And Reusable Packaging Market Segmentation
-
1. Material
- 1.1. Plastic
- 1.2. Paper and Paperboard
- 1.3. Metal
- 1.4. Glass
-
2. Product
- 2.1. Bottles and Containers
- 2.2. Pallets and Crates
- 2.3. IBCs
- 2.4. Drums and Barrels
- 2.5. Boxes and Cartons
- 2.6. Cans and Pails
- 2.7. Others P
-
3. End-user Industry
- 3.1. Food and Beverage
- 3.2. Cosmetics and Personal Care
- 3.3. Household Care
- 3.4. Chemicals and Petrochemicals
- 3.5. Building and Construction
- 3.6. Shipping and Transportation
- 3.7. Other En
Refillable And Reusable Packaging Market Segmentation By Geography
- 1. North America
- 2. Europe
- 3. Asia Pacific
- 4. Latin America
- 5. Middle East and Africa
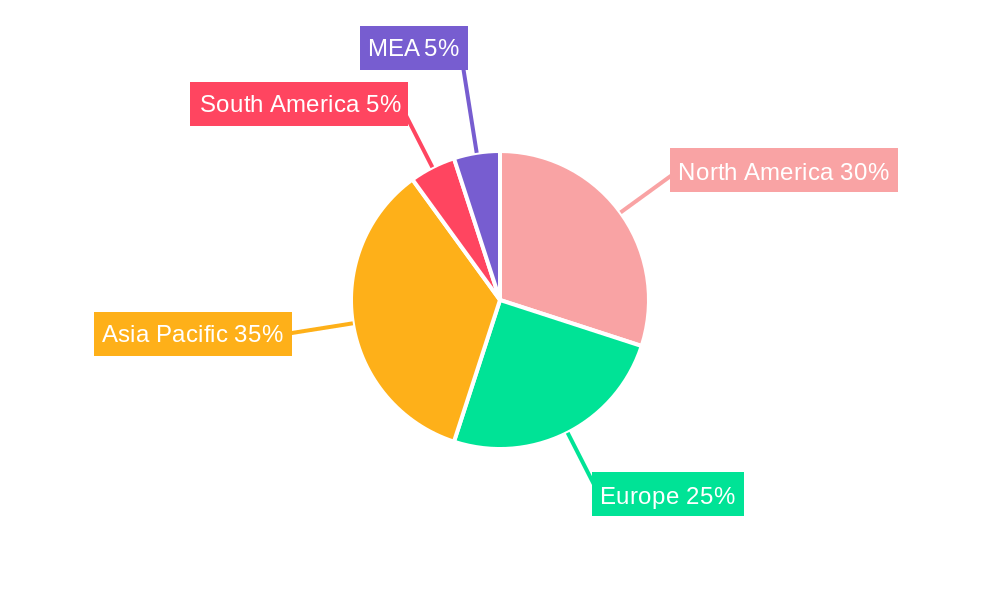
Refillable And Reusable Packaging Market Regional Market Share
Geographic Coverage of Refillable And Reusable Packaging Market
Refillable And Reusable Packaging Market REPORT HIGHLIGHTS
| Aspects | Details |
|---|---|
| Study Period | 2020-2034 |
| Base Year | 2025 |
| Estimated Year | 2026 |
| Forecast Period | 2026-2034 |
| Historical Period | 2020-2025 |
| Growth Rate | CAGR of 4.43% from 2020-2034 |
| Segmentation |
|
Table of Contents
- 1. Introduction
- 1.1. Research Scope
- 1.2. Market Segmentation
- 1.3. Research Objective
- 1.4. Definitions and Assumptions
- 2. Executive Summary
- 2.1. Market Snapshot
- 3. Market Dynamics
- 3.1. Market Drivers
- 3.2. Market Restrains
- 3.3. Market Trends
- 3.4. Market Opportunities
- 4. Market Factor Analysis
- 4.1. Porters Five Forces
- 4.1.1. Bargaining Power of Suppliers
- 4.1.2. Bargaining Power of Buyers
- 4.1.3. Threat of New Entrants
- 4.1.4. Threat of Substitutes
- 4.1.5. Competitive Rivalry
- 4.2. PESTEL analysis
- 4.3. BCG Analysis
- 4.3.1. Stars (High Growth, High Market Share)
- 4.3.2. Cash Cows (Low Growth, High Market Share)
- 4.3.3. Question Mark (High Growth, Low Market Share)
- 4.3.4. Dogs (Low Growth, Low Market Share)
- 4.4. Ansoff Matrix Analysis
- 4.5. Supply Chain Analysis
- 4.6. Regulatory Landscape
- 4.7. Current Market Potential and Opportunity Assessment (TAM–SAM–SOM Framework)
- 4.8. MDP Analyst Note
- 4.1. Porters Five Forces
- 5. Market Analysis, Insights and Forecast 2021-2033
- 5.1. Market Analysis, Insights and Forecast - by Material
- 5.1.1. Plastic
- 5.1.2. Paper and Paperboard
- 5.1.3. Metal
- 5.1.4. Glass
- 5.2. Market Analysis, Insights and Forecast - by Product
- 5.2.1. Bottles and Containers
- 5.2.2. Pallets and Crates
- 5.2.3. IBCs
- 5.2.4. Drums and Barrels
- 5.2.5. Boxes and Cartons
- 5.2.6. Cans and Pails
- 5.2.7. Others P
- 5.3. Market Analysis, Insights and Forecast - by End-user Industry
- 5.3.1. Food and Beverage
- 5.3.2. Cosmetics and Personal Care
- 5.3.3. Household Care
- 5.3.4. Chemicals and Petrochemicals
- 5.3.5. Building and Construction
- 5.3.6. Shipping and Transportation
- 5.3.7. Other En
- 5.4. Market Analysis, Insights and Forecast - by Region
- 5.4.1. North America
- 5.4.2. Europe
- 5.4.3. Asia Pacific
- 5.4.4. Latin America
- 5.4.5. Middle East and Africa
- 5.1. Market Analysis, Insights and Forecast - by Material
- 6. Global Refillable And Reusable Packaging Market Analysis, Insights and Forecast, 2021-2033
- 6.1. Market Analysis, Insights and Forecast - by Material
- 6.1.1. Plastic
- 6.1.2. Paper and Paperboard
- 6.1.3. Metal
- 6.1.4. Glass
- 6.2. Market Analysis, Insights and Forecast - by Product
- 6.2.1. Bottles and Containers
- 6.2.2. Pallets and Crates
- 6.2.3. IBCs
- 6.2.4. Drums and Barrels
- 6.2.5. Boxes and Cartons
- 6.2.6. Cans and Pails
- 6.2.7. Others P
- 6.3. Market Analysis, Insights and Forecast - by End-user Industry
- 6.3.1. Food and Beverage
- 6.3.2. Cosmetics and Personal Care
- 6.3.3. Household Care
- 6.3.4. Chemicals and Petrochemicals
- 6.3.5. Building and Construction
- 6.3.6. Shipping and Transportation
- 6.3.7. Other En
- 6.1. Market Analysis, Insights and Forecast - by Material
- 7. North America Refillable And Reusable Packaging Market Analysis, Insights and Forecast, 2020-2032
- 7.1. Market Analysis, Insights and Forecast - by Material
- 7.1.1. Plastic
- 7.1.2. Paper and Paperboard
- 7.1.3. Metal
- 7.1.4. Glass
- 7.2. Market Analysis, Insights and Forecast - by Product
- 7.2.1. Bottles and Containers
- 7.2.2. Pallets and Crates
- 7.2.3. IBCs
- 7.2.4. Drums and Barrels
- 7.2.5. Boxes and Cartons
- 7.2.6. Cans and Pails
- 7.2.7. Others P
- 7.3. Market Analysis, Insights and Forecast - by End-user Industry
- 7.3.1. Food and Beverage
- 7.3.2. Cosmetics and Personal Care
- 7.3.3. Household Care
- 7.3.4. Chemicals and Petrochemicals
- 7.3.5. Building and Construction
- 7.3.6. Shipping and Transportation
- 7.3.7. Other En
- 7.1. Market Analysis, Insights and Forecast - by Material
- 8. Europe Refillable And Reusable Packaging Market Analysis, Insights and Forecast, 2020-2032
- 8.1. Market Analysis, Insights and Forecast - by Material
- 8.1.1. Plastic
- 8.1.2. Paper and Paperboard
- 8.1.3. Metal
- 8.1.4. Glass
- 8.2. Market Analysis, Insights and Forecast - by Product
- 8.2.1. Bottles and Containers
- 8.2.2. Pallets and Crates
- 8.2.3. IBCs
- 8.2.4. Drums and Barrels
- 8.2.5. Boxes and Cartons
- 8.2.6. Cans and Pails
- 8.2.7. Others P
- 8.3. Market Analysis, Insights and Forecast - by End-user Industry
- 8.3.1. Food and Beverage
- 8.3.2. Cosmetics and Personal Care
- 8.3.3. Household Care
- 8.3.4. Chemicals and Petrochemicals
- 8.3.5. Building and Construction
- 8.3.6. Shipping and Transportation
- 8.3.7. Other En
- 8.1. Market Analysis, Insights and Forecast - by Material
- 9. Asia Pacific Refillable And Reusable Packaging Market Analysis, Insights and Forecast, 2020-2032
- 9.1. Market Analysis, Insights and Forecast - by Material
- 9.1.1. Plastic
- 9.1.2. Paper and Paperboard
- 9.1.3. Metal
- 9.1.4. Glass
- 9.2. Market Analysis, Insights and Forecast - by Product
- 9.2.1. Bottles and Containers
- 9.2.2. Pallets and Crates
- 9.2.3. IBCs
- 9.2.4. Drums and Barrels
- 9.2.5. Boxes and Cartons
- 9.2.6. Cans and Pails
- 9.2.7. Others P
- 9.3. Market Analysis, Insights and Forecast - by End-user Industry
- 9.3.1. Food and Beverage
- 9.3.2. Cosmetics and Personal Care
- 9.3.3. Household Care
- 9.3.4. Chemicals and Petrochemicals
- 9.3.5. Building and Construction
- 9.3.6. Shipping and Transportation
- 9.3.7. Other En
- 9.1. Market Analysis, Insights and Forecast - by Material
- 10. Latin America Refillable And Reusable Packaging Market Analysis, Insights and Forecast, 2020-2032
- 10.1. Market Analysis, Insights and Forecast - by Material
- 10.1.1. Plastic
- 10.1.2. Paper and Paperboard
- 10.1.3. Metal
- 10.1.4. Glass
- 10.2. Market Analysis, Insights and Forecast - by Product
- 10.2.1. Bottles and Containers
- 10.2.2. Pallets and Crates
- 10.2.3. IBCs
- 10.2.4. Drums and Barrels
- 10.2.5. Boxes and Cartons
- 10.2.6. Cans and Pails
- 10.2.7. Others P
- 10.3. Market Analysis, Insights and Forecast - by End-user Industry
- 10.3.1. Food and Beverage
- 10.3.2. Cosmetics and Personal Care
- 10.3.3. Household Care
- 10.3.4. Chemicals and Petrochemicals
- 10.3.5. Building and Construction
- 10.3.6. Shipping and Transportation
- 10.3.7. Other En
- 10.1. Market Analysis, Insights and Forecast - by Material
- 11. Middle East and Africa Refillable And Reusable Packaging Market Analysis, Insights and Forecast, 2020-2032
- 11.1. Market Analysis, Insights and Forecast - by Material
- 11.1.1. Plastic
- 11.1.2. Paper and Paperboard
- 11.1.3. Metal
- 11.1.4. Glass
- 11.2. Market Analysis, Insights and Forecast - by Product
- 11.2.1. Bottles and Containers
- 11.2.2. Pallets and Crates
- 11.2.3. IBCs
- 11.2.4. Drums and Barrels
- 11.2.5. Boxes and Cartons
- 11.2.6. Cans and Pails
- 11.2.7. Others P
- 11.3. Market Analysis, Insights and Forecast - by End-user Industry
- 11.3.1. Food and Beverage
- 11.3.2. Cosmetics and Personal Care
- 11.3.3. Household Care
- 11.3.4. Chemicals and Petrochemicals
- 11.3.5. Building and Construction
- 11.3.6. Shipping and Transportation
- 11.3.7. Other En
- 11.1. Market Analysis, Insights and Forecast - by Material
- 12. Competitive Analysis
- 12.1. Company Profiles
- 12.1.1 Nefab Group
- 12.1.1.1. Company Overview
- 12.1.1.2. Products
- 12.1.1.3. Company Financials
- 12.1.1.4. SWOT Analysis
- 12.1.2 Smurfit Kappa Group
- 12.1.2.1. Company Overview
- 12.1.2.2. Products
- 12.1.2.3. Company Financials
- 12.1.2.4. SWOT Analysis
- 12.1.3 Schoeller Allibert Services BV
- 12.1.3.1. Company Overview
- 12.1.3.2. Products
- 12.1.3.3. Company Financials
- 12.1.3.4. SWOT Analysis
- 12.1.4 Greif Inc
- 12.1.4.1. Company Overview
- 12.1.4.2. Products
- 12.1.4.3. Company Financials
- 12.1.4.4. SWOT Analysis
- 12.1.5 Amcor PLC
- 12.1.5.1. Company Overview
- 12.1.5.2. Products
- 12.1.5.3. Company Financials
- 12.1.5.4. SWOT Analysis
- 12.1.6 Mondi PLC
- 12.1.6.1. Company Overview
- 12.1.6.2. Products
- 12.1.6.3. Company Financials
- 12.1.6.4. SWOT Analysis
- 12.1.7 IPL Inc
- 12.1.7.1. Company Overview
- 12.1.7.2. Products
- 12.1.7.3. Company Financials
- 12.1.7.4. SWOT Analysis
- 12.1.8 IFCO Systems
- 12.1.8.1. Company Overview
- 12.1.8.2. Products
- 12.1.8.3. Company Financials
- 12.1.8.4. SWOT Analysis
- 12.1.9 Petainer Ltd
- 12.1.9.1. Company Overview
- 12.1.9.2. Products
- 12.1.9.3. Company Financials
- 12.1.9.4. SWOT Analysis
- 12.1.10 Bormioli Luigi Corporation
- 12.1.10.1. Company Overview
- 12.1.10.2. Products
- 12.1.10.3. Company Financials
- 12.1.10.4. SWOT Analysis
- 12.1.11 Vetropack Holding Ltd
- 12.1.11.1. Company Overview
- 12.1.11.2. Products
- 12.1.11.3. Company Financials
- 12.1.11.4. SWOT Analysis
- 12.1.12 Jiangmen UA Packaging Co Lt
- 12.1.12.1. Company Overview
- 12.1.12.2. Products
- 12.1.12.3. Company Financials
- 12.1.12.4. SWOT Analysis
- 12.1.13 GWP Group
- 12.1.13.1. Company Overview
- 12.1.13.2. Products
- 12.1.13.3. Company Financials
- 12.1.13.4. SWOT Analysis
- 12.1.14 Refillism
- 12.1.14.1. Company Overview
- 12.1.14.2. Products
- 12.1.14.3. Company Financials
- 12.1.14.4. SWOT Analysis
- 12.1.15 Berry Global Inc
- 12.1.15.1. Company Overview
- 12.1.15.2. Products
- 12.1.15.3. Company Financials
- 12.1.15.4. SWOT Analysis
- 12.1.16 Orbis Corporation
- 12.1.16.1. Company Overview
- 12.1.16.2. Products
- 12.1.16.3. Company Financials
- 12.1.16.4. SWOT Analysis
- 12.1.17 International Paper
- 12.1.17.1. Company Overview
- 12.1.17.2. Products
- 12.1.17.3. Company Financials
- 12.1.17.4. SWOT Analysis
- 12.1.1 Nefab Group
- 12.2. Market Entropy
- 12.2.1 Company's Key Areas Served
- 12.2.2 Recent Developments
- 12.3. Company Market Share Analysis 2025
- 12.3.1 Top 5 Companies Market Share Analysis
- 12.3.2 Top 3 Companies Market Share Analysis
- 12.4. List of Potential Customers
- 13. Research Methodology
List of Figures
- Figure 1: Global Refillable And Reusable Packaging Market Revenue Breakdown (Million, %) by Region 2025 & 2033
- Figure 2: North America Refillable And Reusable Packaging Market Revenue (Million), by Material 2025 & 2033
- Figure 3: North America Refillable And Reusable Packaging Market Revenue Share (%), by Material 2025 & 2033
- Figure 4: North America Refillable And Reusable Packaging Market Revenue (Million), by Product 2025 & 2033
- Figure 5: North America Refillable And Reusable Packaging Market Revenue Share (%), by Product 2025 & 2033
- Figure 6: North America Refillable And Reusable Packaging Market Revenue (Million), by End-user Industry 2025 & 2033
- Figure 7: North America Refillable And Reusable Packaging Market Revenue Share (%), by End-user Industry 2025 & 2033
- Figure 8: North America Refillable And Reusable Packaging Market Revenue (Million), by Country 2025 & 2033
- Figure 9: North America Refillable And Reusable Packaging Market Revenue Share (%), by Country 2025 & 2033
- Figure 10: Europe Refillable And Reusable Packaging Market Revenue (Million), by Material 2025 & 2033
- Figure 11: Europe Refillable And Reusable Packaging Market Revenue Share (%), by Material 2025 & 2033
- Figure 12: Europe Refillable And Reusable Packaging Market Revenue (Million), by Product 2025 & 2033
- Figure 13: Europe Refillable And Reusable Packaging Market Revenue Share (%), by Product 2025 & 2033
- Figure 14: Europe Refillable And Reusable Packaging Market Revenue (Million), by End-user Industry 2025 & 2033
- Figure 15: Europe Refillable And Reusable Packaging Market Revenue Share (%), by End-user Industry 2025 & 2033
- Figure 16: Europe Refillable And Reusable Packaging Market Revenue (Million), by Country 2025 & 2033
- Figure 17: Europe Refillable And Reusable Packaging Market Revenue Share (%), by Country 2025 & 2033
- Figure 18: Asia Pacific Refillable And Reusable Packaging Market Revenue (Million), by Material 2025 & 2033
- Figure 19: Asia Pacific Refillable And Reusable Packaging Market Revenue Share (%), by Material 2025 & 2033
- Figure 20: Asia Pacific Refillable And Reusable Packaging Market Revenue (Million), by Product 2025 & 2033
- Figure 21: Asia Pacific Refillable And Reusable Packaging Market Revenue Share (%), by Product 2025 & 2033
- Figure 22: Asia Pacific Refillable And Reusable Packaging Market Revenue (Million), by End-user Industry 2025 & 2033
- Figure 23: Asia Pacific Refillable And Reusable Packaging Market Revenue Share (%), by End-user Industry 2025 & 2033
- Figure 24: Asia Pacific Refillable And Reusable Packaging Market Revenue (Million), by Country 2025 & 2033
- Figure 25: Asia Pacific Refillable And Reusable Packaging Market Revenue Share (%), by Country 2025 & 2033
- Figure 26: Latin America Refillable And Reusable Packaging Market Revenue (Million), by Material 2025 & 2033
- Figure 27: Latin America Refillable And Reusable Packaging Market Revenue Share (%), by Material 2025 & 2033
- Figure 28: Latin America Refillable And Reusable Packaging Market Revenue (Million), by Product 2025 & 2033
- Figure 29: Latin America Refillable And Reusable Packaging Market Revenue Share (%), by Product 2025 & 2033
- Figure 30: Latin America Refillable And Reusable Packaging Market Revenue (Million), by End-user Industry 2025 & 2033
- Figure 31: Latin America Refillable And Reusable Packaging Market Revenue Share (%), by End-user Industry 2025 & 2033
- Figure 32: Latin America Refillable And Reusable Packaging Market Revenue (Million), by Country 2025 & 2033
- Figure 33: Latin America Refillable And Reusable Packaging Market Revenue Share (%), by Country 2025 & 2033
- Figure 34: Middle East and Africa Refillable And Reusable Packaging Market Revenue (Million), by Material 2025 & 2033
- Figure 35: Middle East and Africa Refillable And Reusable Packaging Market Revenue Share (%), by Material 2025 & 2033
- Figure 36: Middle East and Africa Refillable And Reusable Packaging Market Revenue (Million), by Product 2025 & 2033
- Figure 37: Middle East and Africa Refillable And Reusable Packaging Market Revenue Share (%), by Product 2025 & 2033
- Figure 38: Middle East and Africa Refillable And Reusable Packaging Market Revenue (Million), by End-user Industry 2025 & 2033
- Figure 39: Middle East and Africa Refillable And Reusable Packaging Market Revenue Share (%), by End-user Industry 2025 & 2033
- Figure 40: Middle East and Africa Refillable And Reusable Packaging Market Revenue (Million), by Country 2025 & 2033
- Figure 41: Middle East and Africa Refillable And Reusable Packaging Market Revenue Share (%), by Country 2025 & 2033
List of Tables
- Table 1: Global Refillable And Reusable Packaging Market Revenue Million Forecast, by Material 2020 & 2033
- Table 2: Global Refillable And Reusable Packaging Market Revenue Million Forecast, by Product 2020 & 2033
- Table 3: Global Refillable And Reusable Packaging Market Revenue Million Forecast, by End-user Industry 2020 & 2033
- Table 4: Global Refillable And Reusable Packaging Market Revenue Million Forecast, by Region 2020 & 2033
- Table 5: Global Refillable And Reusable Packaging Market Revenue Million Forecast, by Material 2020 & 2033
- Table 6: Global Refillable And Reusable Packaging Market Revenue Million Forecast, by Product 2020 & 2033
- Table 7: Global Refillable And Reusable Packaging Market Revenue Million Forecast, by End-user Industry 2020 & 2033
- Table 8: Global Refillable And Reusable Packaging Market Revenue Million Forecast, by Country 2020 & 2033
- Table 9: Global Refillable And Reusable Packaging Market Revenue Million Forecast, by Material 2020 & 2033
- Table 10: Global Refillable And Reusable Packaging Market Revenue Million Forecast, by Product 2020 & 2033
- Table 11: Global Refillable And Reusable Packaging Market Revenue Million Forecast, by End-user Industry 2020 & 2033
- Table 12: Global Refillable And Reusable Packaging Market Revenue Million Forecast, by Country 2020 & 2033
- Table 13: Global Refillable And Reusable Packaging Market Revenue Million Forecast, by Material 2020 & 2033
- Table 14: Global Refillable And Reusable Packaging Market Revenue Million Forecast, by Product 2020 & 2033
- Table 15: Global Refillable And Reusable Packaging Market Revenue Million Forecast, by End-user Industry 2020 & 2033
- Table 16: Global Refillable And Reusable Packaging Market Revenue Million Forecast, by Country 2020 & 2033
- Table 17: Global Refillable And Reusable Packaging Market Revenue Million Forecast, by Material 2020 & 2033
- Table 18: Global Refillable And Reusable Packaging Market Revenue Million Forecast, by Product 2020 & 2033
- Table 19: Global Refillable And Reusable Packaging Market Revenue Million Forecast, by End-user Industry 2020 & 2033
- Table 20: Global Refillable And Reusable Packaging Market Revenue Million Forecast, by Country 2020 & 2033
- Table 21: Global Refillable And Reusable Packaging Market Revenue Million Forecast, by Material 2020 & 2033
- Table 22: Global Refillable And Reusable Packaging Market Revenue Million Forecast, by Product 2020 & 2033
- Table 23: Global Refillable And Reusable Packaging Market Revenue Million Forecast, by End-user Industry 2020 & 2033
- Table 24: Global Refillable And Reusable Packaging Market Revenue Million Forecast, by Country 2020 & 2033
Frequently Asked Questions
1. What is the projected Compound Annual Growth Rate (CAGR) of the Refillable And Reusable Packaging Market?
The projected CAGR is approximately 4.43%.
2. Which companies are prominent players in the Refillable And Reusable Packaging Market?
Key companies in the market include Nefab Group, Smurfit Kappa Group, Schoeller Allibert Services BV, Greif Inc, Amcor PLC, Mondi PLC, IPL Inc, IFCO Systems, Petainer Ltd, Bormioli Luigi Corporation, Vetropack Holding Ltd, Jiangmen UA Packaging Co Lt, GWP Group, Refillism, Berry Global Inc, Orbis Corporation, International Paper.
3. What are the main segments of the Refillable And Reusable Packaging Market?
The market segments include Material, Product, End-user Industry.
4. Can you provide details about the market size?
The market size is estimated to be USD 45.67 Million as of 2022.
5. What are some drivers contributing to market growth?
Rising Demand for Sustainable and Recyclable Refillable Packaging; Increasing Need for Smart and Trackable Reusable Packaging Solutions.
6. What are the notable trends driving market growth?
Pallets and Crates are Expected to Witness Growth.
7. Are there any restraints impacting market growth?
Supply Chain Disruptions and Regulatory Changes Might Limit the Market Growth.
8. Can you provide examples of recent developments in the market?
October 2023: Berry Global Inc. launched a 14-liter HDPE reusable container. The container plays a central role as the vessel for a new refill packaging solution from the Refill Coalition. The pilot for the solution was initiated at Aldi UK in its Solihull branch.
9. What pricing options are available for accessing the report?
Pricing options include single-user, multi-user, and enterprise licenses priced at USD 4750, USD 5250, and USD 8750 respectively.
10. Is the market size provided in terms of value or volume?
The market size is provided in terms of value, measured in Million.
11. Are there any specific market keywords associated with the report?
Yes, the market keyword associated with the report is "Refillable And Reusable Packaging Market," which aids in identifying and referencing the specific market segment covered.
12. How do I determine which pricing option suits my needs best?
The pricing options vary based on user requirements and access needs. Individual users may opt for single-user licenses, while businesses requiring broader access may choose multi-user or enterprise licenses for cost-effective access to the report.
13. Are there any additional resources or data provided in the Refillable And Reusable Packaging Market report?
While the report offers comprehensive insights, it's advisable to review the specific contents or supplementary materials provided to ascertain if additional resources or data are available.
14. How can I stay updated on further developments or reports in the Refillable And Reusable Packaging Market?
To stay informed about further developments, trends, and reports in the Refillable And Reusable Packaging Market, consider subscribing to industry newsletters, following relevant companies and organizations, or regularly checking reputable industry news sources and publications.
Methodology
Step 1 - Identification of Relevant Samples Size from Population Database


Step 2 - Approaches for Defining Global Market Size (Value, Volume* & Price*)

Note*: In applicable scenarios
Step 3 - Data Sources
Primary Research
- Web Analytics
- Survey Reports
- Research Institute
- Latest Research Reports
- Opinion Leaders
Secondary Research
- Annual Reports
- White Paper
- Latest Press Release
- Industry Association
- Paid Database
- Investor Presentations

Step 4 - Data Triangulation
Involves using different sources of information in order to increase the validity of a study
These sources are likely to be stakeholders in a program - participants, other researchers, program staff, other community members, and so on.
Then we put all data in single framework & apply various statistical tools to find out the dynamic on the market.
During the analysis stage, feedback from the stakeholder groups would be compared to determine areas of agreement as well as areas of divergence