

Key Insights
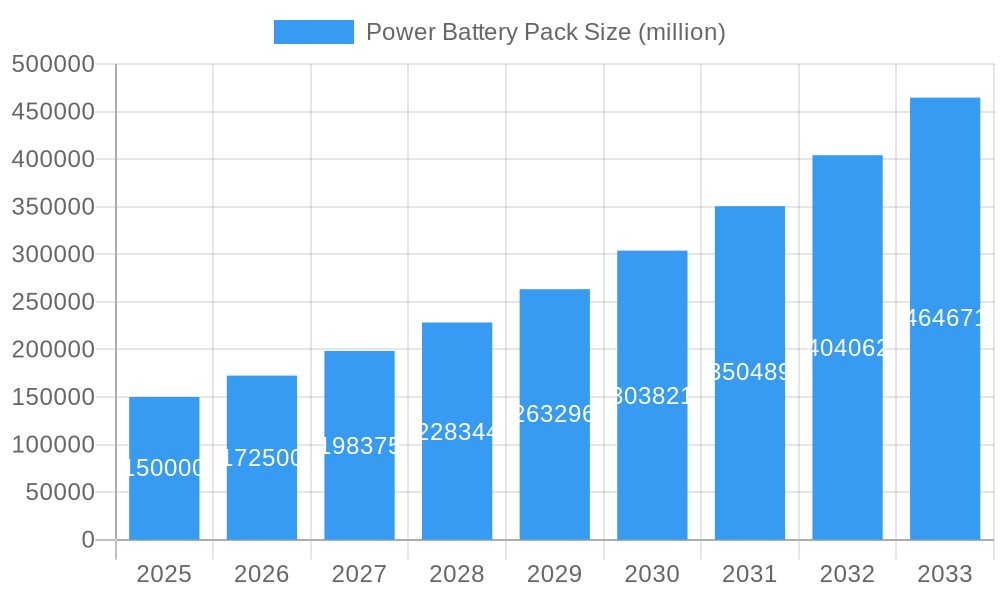
The global power battery pack market is experiencing robust growth, driven by the burgeoning electric vehicle (EV) sector and increasing demand for energy storage solutions. The market, estimated at $150 billion in 2025, is projected to expand at a Compound Annual Growth Rate (CAGR) of 15% from 2025 to 2033, reaching approximately $500 billion by 2033. This expansion is fueled by several key factors. Firstly, stringent government regulations aimed at reducing carbon emissions are mandating the adoption of EVs across passenger cars, commercial vehicles, and logistics fleets. Secondly, advancements in battery technology, particularly in lithium-ion battery chemistries like Lithium Iron Phosphate (LFP) and ternary batteries, are enhancing energy density, lifespan, and safety, making them more attractive for various applications. The rising adoption of renewable energy sources and the need for efficient energy storage further contribute to market growth. Leading players like CATL, LG Chem, and Panasonic are aggressively investing in research and development, expanding their production capacities, and strategically forming partnerships to capitalize on this burgeoning opportunity. The market is segmented by application (passenger car, commercial vehicle, logistics vehicle) and battery type (Lithium Cobalt Oxide, Lithium Manganese, LFP, Ternary), with LFP batteries gaining significant traction due to their cost-effectiveness and improved performance. Geographic distribution shows strong growth in Asia-Pacific, particularly in China, driven by a large domestic EV market and supportive government policies, while North America and Europe are also witnessing substantial growth.
Power Battery Pack Market Size (In Billion)
However, the market faces challenges. Supply chain constraints, particularly concerning raw materials like lithium and cobalt, could hinder production and increase costs. Furthermore, concerns about battery safety, recycling infrastructure, and the environmental impact of battery production and disposal need to be addressed for sustainable growth. Competition among battery manufacturers is intense, with a focus on cost reduction, innovation, and securing supply chains. Despite these challenges, the long-term outlook for the power battery pack market remains positive, driven by the irreversible shift towards electrification across various transportation and energy sectors. The continued development of higher-energy-density and more cost-effective battery technologies will play a pivotal role in shaping this growth trajectory.
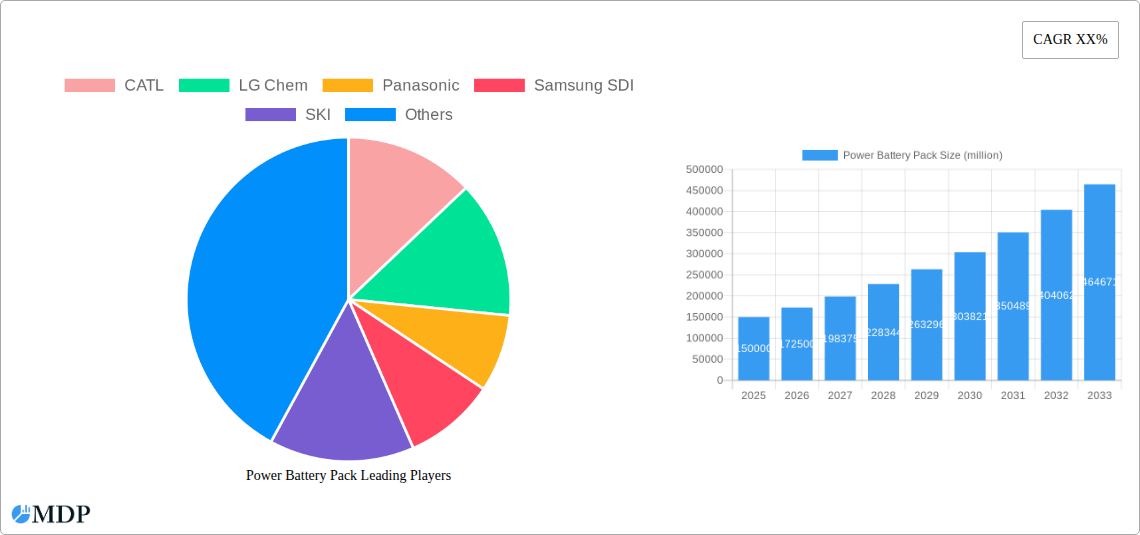
Power Battery Pack Company Market Share
Power Battery Pack Market Report: 2019-2033 Forecast - A Comprehensive Analysis
This comprehensive report provides an in-depth analysis of the global power battery pack market, offering actionable insights for stakeholders across the entire value chain. The study covers the period from 2019 to 2033, with a focus on the 2025-2033 forecast period and in-depth analysis of the Base Year 2025. The report projects a market exceeding xx million units by 2033, driven by burgeoning demand across diverse sectors. Key players like CATL, LG Chem, Panasonic, Samsung SDI, and BYD are thoroughly examined, along with emerging competitors. This report is crucial for businesses seeking to understand market dynamics, identify growth opportunities, and navigate the competitive landscape.
Power Battery Pack Market Dynamics & Concentration
The global power battery pack market is experiencing robust growth, driven by the increasing adoption of electric vehicles (EVs) and energy storage systems (ESS). Market concentration is moderate, with a few dominant players holding significant market share. CATL, LG Chem, and Panasonic collectively hold approximately xx% of the global market share in 2025, while several other significant players such as Samsung SDI, SK Innovation (SKI), BYD, and AESC contribute to a competitive landscape. Innovation is a key driver, with continuous improvements in battery technology, including increased energy density, improved safety features, and faster charging capabilities. Stringent regulatory frameworks promoting EV adoption in various regions are also contributing to growth. Product substitutes, such as fuel cells and alternative energy sources, pose limited competition currently, although their potential impact is considered within the forecast. Mergers and acquisitions (M&A) activities are relatively frequent within the industry, reflecting the drive for consolidation and technological advancement. Between 2019 and 2024, over xx M&A deals were recorded, further shaping the market structure.
- Market Share (2025): CATL (xx%), LG Chem (xx%), Panasonic (xx%), Others (xx%)
- M&A Deal Count (2019-2024): xx
Power Battery Pack Industry Trends & Analysis
The power battery pack market is characterized by a compound annual growth rate (CAGR) of xx% during the forecast period (2025-2033). This growth is fueled by several key factors. Firstly, the global shift towards electric mobility, driven by environmental concerns and government incentives, is a major catalyst. Secondly, technological advancements such as the development of solid-state batteries and improved battery management systems are enhancing battery performance and lifespan, bolstering consumer confidence. Consumer preferences are shifting towards EVs with longer ranges and faster charging times, creating demand for higher-energy-density battery packs. Competitive dynamics are intense, with existing players investing heavily in R&D and capacity expansion, and new entrants emerging. The market penetration of EVs continues to grow, reaching xx% in key markets by 2025, which further fuels market growth. The increasing adoption of battery packs in renewable energy storage, grid-scale energy storage and other industrial applications are also contributing to growth.
Leading Markets & Segments in Power Battery Pack
The passenger car segment dominates the power battery pack market, accounting for approximately xx% of total demand in 2025. However, the commercial vehicle and logistics vehicle segments are experiencing rapid growth, driven by the electrification of transportation fleets. Among battery types, Lithium Iron Phosphate (LFP) battery packs are gaining popularity due to their cost-effectiveness and safety features, while Ternary battery packs are favored for their high energy density. China remains the leading market due to its massive EV adoption rate, supported by substantial government investments in infrastructure and supportive policies. Other key markets include Europe and North America, exhibiting strong growth potential.
- Key Drivers for Passenger Car Segment:
- Increasing consumer preference for EVs.
- Government incentives and subsidies.
- Improving battery technology and cost reductions.
- Key Drivers for Commercial Vehicle Segment:
- Electrification mandates and environmental regulations.
- Focus on reducing operating costs.
- Technological advancements improving vehicle range and payload.
- Dominant Regions/Countries (2025): China (xx%), Europe (xx%), North America (xx%)
Power Battery Pack Product Developments
Recent product developments focus on improving energy density, extending lifespan, enhancing safety, and reducing costs. Innovations include the use of advanced materials, improved cell designs, and sophisticated battery management systems. These advancements are expanding the applications of power battery packs to include diverse sectors beyond electric vehicles, including energy storage systems and portable power supplies. Competitive advantages are built around superior battery performance, cost efficiency, and reliable supply chains. The market is seeing significant developments in solid-state batteries, expected to disrupt the industry with improved safety and performance.
Key Drivers of Power Battery Pack Growth
Technological advancements are a primary driver of market growth, with continuous improvements in battery chemistry, cell design, and manufacturing processes. Government policies supporting EV adoption, including subsidies and emission regulations, significantly accelerate market expansion. The falling cost of battery production, driven by economies of scale and technological innovation, is making EVs more affordable and accessible. Furthermore, the increasing awareness about environmental sustainability is driving consumer demand for electric vehicles and hence power battery packs.
Challenges in the Power Battery Pack Market
The power battery pack market faces significant challenges, including the volatility of raw material prices, particularly lithium and cobalt. Supply chain disruptions and geopolitical uncertainties can impact production and availability. Stringent safety regulations and testing requirements can increase development costs and time to market. Intense competition from both established and emerging players can squeeze profit margins and limit growth opportunities for some players. These factors could potentially limit market growth and create barriers to entry for new companies.
Emerging Opportunities in Power Battery Pack
Significant opportunities exist in the development and commercialization of next-generation battery technologies, such as solid-state batteries and lithium-sulfur batteries, offering enhanced performance and safety features. Strategic partnerships between battery manufacturers, automotive companies, and energy providers are creating opportunities for large-scale deployment of power battery packs. Expanding market penetration into developing economies with rapidly growing EV markets presents significant growth potential.
Key Milestones in Power Battery Pack Industry
- 2020: CATL announces mass production of its LFP battery with improved energy density.
- 2021: LG Chem unveils a new generation of high-energy-density battery cells for EVs.
- 2022: Several major automotive manufacturers announce partnerships with battery suppliers to secure long-term supply chains.
- 2023: Significant investments are made in building new battery gigafactories globally.
- 2024: Several countries introduce stricter emission regulations, driving faster adoption of EVs.
Strategic Outlook for Power Battery Pack Market
The power battery pack market is poised for sustained growth driven by increasing demand for EVs, advancements in battery technology, and supportive government policies. Companies can leverage strategic opportunities by focusing on innovation, developing strong supply chains, and forming strategic partnerships. The market will witness further consolidation through M&A activity and an emphasis on sustainability. Expanding into new applications, such as grid-scale energy storage, will create new revenue streams and market growth.
Power Battery Pack Segmentation
-
1. Application
- 1.1. Passenger Car
- 1.2. Commercial Vehicle
- 1.3. Logistics Vehicle
-
2. Types
- 2.1. Lithium Cobalt Oxide Battery Pack
- 2.2. Lithium Manganese Battery Pack
- 2.3. Lithium Iron Phosphate Battery Pack
- 2.4. Ternary Battery Pack
Power Battery Pack Segmentation By Geography
-
1. North America
- 1.1. United States
- 1.2. Canada
- 1.3. Mexico
-
2. South America
- 2.1. Brazil
- 2.2. Argentina
- 2.3. Rest of South America
-
3. Europe
- 3.1. United Kingdom
- 3.2. Germany
- 3.3. France
- 3.4. Italy
- 3.5. Spain
- 3.6. Russia
- 3.7. Benelux
- 3.8. Nordics
- 3.9. Rest of Europe
-
4. Middle East & Africa
- 4.1. Turkey
- 4.2. Israel
- 4.3. GCC
- 4.4. North Africa
- 4.5. South Africa
- 4.6. Rest of Middle East & Africa
-
5. Asia Pacific
- 5.1. China
- 5.2. India
- 5.3. Japan
- 5.4. South Korea
- 5.5. ASEAN
- 5.6. Oceania
- 5.7. Rest of Asia Pacific
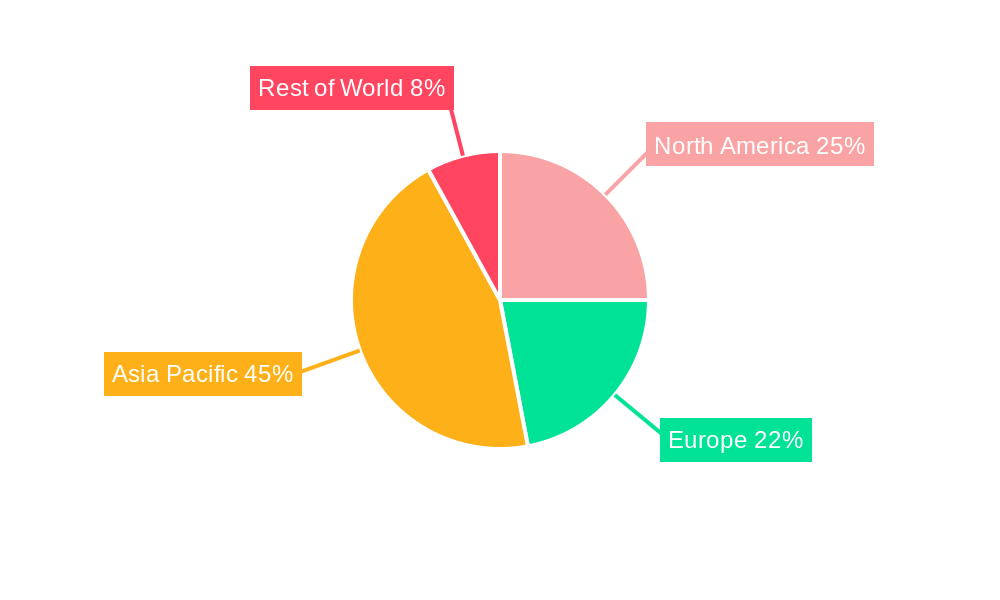
Power Battery Pack Regional Market Share
Geographic Coverage of Power Battery Pack
Power Battery Pack REPORT HIGHLIGHTS
| Aspects | Details |
|---|---|
| Study Period | 2020-2034 |
| Base Year | 2025 |
| Estimated Year | 2026 |
| Forecast Period | 2026-2034 |
| Historical Period | 2020-2025 |
| Growth Rate | CAGR of XX% from 2020-2034 |
| Segmentation |
|
Table of Contents
- 1. Introduction
- 1.1. Research Scope
- 1.2. Market Segmentation
- 1.3. Research Methodology
- 1.4. Definitions and Assumptions
- 2. Executive Summary
- 2.1. Introduction
- 3. Market Dynamics
- 3.1. Introduction
- 3.2. Market Drivers
- 3.3. Market Restrains
- 3.4. Market Trends
- 4. Market Factor Analysis
- 4.1. Porters Five Forces
- 4.2. Supply/Value Chain
- 4.3. PESTEL analysis
- 4.4. Market Entropy
- 4.5. Patent/Trademark Analysis
- 5. Global Power Battery Pack Analysis, Insights and Forecast, 2020-2032
- 5.1. Market Analysis, Insights and Forecast - by Application
- 5.1.1. Passenger Car
- 5.1.2. Commercial Vehicle
- 5.1.3. Logistics Vehicle
- 5.2. Market Analysis, Insights and Forecast - by Types
- 5.2.1. Lithium Cobalt Oxide Battery Pack
- 5.2.2. Lithium Manganese Battery Pack
- 5.2.3. Lithium Iron Phosphate Battery Pack
- 5.2.4. Ternary Battery Pack
- 5.3. Market Analysis, Insights and Forecast - by Region
- 5.3.1. North America
- 5.3.2. South America
- 5.3.3. Europe
- 5.3.4. Middle East & Africa
- 5.3.5. Asia Pacific
- 5.1. Market Analysis, Insights and Forecast - by Application
- 6. North America Power Battery Pack Analysis, Insights and Forecast, 2020-2032
- 6.1. Market Analysis, Insights and Forecast - by Application
- 6.1.1. Passenger Car
- 6.1.2. Commercial Vehicle
- 6.1.3. Logistics Vehicle
- 6.2. Market Analysis, Insights and Forecast - by Types
- 6.2.1. Lithium Cobalt Oxide Battery Pack
- 6.2.2. Lithium Manganese Battery Pack
- 6.2.3. Lithium Iron Phosphate Battery Pack
- 6.2.4. Ternary Battery Pack
- 6.1. Market Analysis, Insights and Forecast - by Application
- 7. South America Power Battery Pack Analysis, Insights and Forecast, 2020-2032
- 7.1. Market Analysis, Insights and Forecast - by Application
- 7.1.1. Passenger Car
- 7.1.2. Commercial Vehicle
- 7.1.3. Logistics Vehicle
- 7.2. Market Analysis, Insights and Forecast - by Types
- 7.2.1. Lithium Cobalt Oxide Battery Pack
- 7.2.2. Lithium Manganese Battery Pack
- 7.2.3. Lithium Iron Phosphate Battery Pack
- 7.2.4. Ternary Battery Pack
- 7.1. Market Analysis, Insights and Forecast - by Application
- 8. Europe Power Battery Pack Analysis, Insights and Forecast, 2020-2032
- 8.1. Market Analysis, Insights and Forecast - by Application
- 8.1.1. Passenger Car
- 8.1.2. Commercial Vehicle
- 8.1.3. Logistics Vehicle
- 8.2. Market Analysis, Insights and Forecast - by Types
- 8.2.1. Lithium Cobalt Oxide Battery Pack
- 8.2.2. Lithium Manganese Battery Pack
- 8.2.3. Lithium Iron Phosphate Battery Pack
- 8.2.4. Ternary Battery Pack
- 8.1. Market Analysis, Insights and Forecast - by Application
- 9. Middle East & Africa Power Battery Pack Analysis, Insights and Forecast, 2020-2032
- 9.1. Market Analysis, Insights and Forecast - by Application
- 9.1.1. Passenger Car
- 9.1.2. Commercial Vehicle
- 9.1.3. Logistics Vehicle
- 9.2. Market Analysis, Insights and Forecast - by Types
- 9.2.1. Lithium Cobalt Oxide Battery Pack
- 9.2.2. Lithium Manganese Battery Pack
- 9.2.3. Lithium Iron Phosphate Battery Pack
- 9.2.4. Ternary Battery Pack
- 9.1. Market Analysis, Insights and Forecast - by Application
- 10. Asia Pacific Power Battery Pack Analysis, Insights and Forecast, 2020-2032
- 10.1. Market Analysis, Insights and Forecast - by Application
- 10.1.1. Passenger Car
- 10.1.2. Commercial Vehicle
- 10.1.3. Logistics Vehicle
- 10.2. Market Analysis, Insights and Forecast - by Types
- 10.2.1. Lithium Cobalt Oxide Battery Pack
- 10.2.2. Lithium Manganese Battery Pack
- 10.2.3. Lithium Iron Phosphate Battery Pack
- 10.2.4. Ternary Battery Pack
- 10.1. Market Analysis, Insights and Forecast - by Application
- 11. Competitive Analysis
- 11.1. Global Market Share Analysis 2025
- 11.2. Company Profiles
- 11.2.1 CATL
- 11.2.1.1. Overview
- 11.2.1.2. Products
- 11.2.1.3. SWOT Analysis
- 11.2.1.4. Recent Developments
- 11.2.1.5. Financials (Based on Availability)
- 11.2.2 LG Chem
- 11.2.2.1. Overview
- 11.2.2.2. Products
- 11.2.2.3. SWOT Analysis
- 11.2.2.4. Recent Developments
- 11.2.2.5. Financials (Based on Availability)
- 11.2.3 Panasonic
- 11.2.3.1. Overview
- 11.2.3.2. Products
- 11.2.3.3. SWOT Analysis
- 11.2.3.4. Recent Developments
- 11.2.3.5. Financials (Based on Availability)
- 11.2.4 Samsung SDI
- 11.2.4.1. Overview
- 11.2.4.2. Products
- 11.2.4.3. SWOT Analysis
- 11.2.4.4. Recent Developments
- 11.2.4.5. Financials (Based on Availability)
- 11.2.5 SKI
- 11.2.5.1. Overview
- 11.2.5.2. Products
- 11.2.5.3. SWOT Analysis
- 11.2.5.4. Recent Developments
- 11.2.5.5. Financials (Based on Availability)
- 11.2.6 BYD
- 11.2.6.1. Overview
- 11.2.6.2. Products
- 11.2.6.3. SWOT Analysis
- 11.2.6.4. Recent Developments
- 11.2.6.5. Financials (Based on Availability)
- 11.2.7 AESC
- 11.2.7.1. Overview
- 11.2.7.2. Products
- 11.2.7.3. SWOT Analysis
- 11.2.7.4. Recent Developments
- 11.2.7.5. Financials (Based on Availability)
- 11.2.8 CALB
- 11.2.8.1. Overview
- 11.2.8.2. Products
- 11.2.8.3. SWOT Analysis
- 11.2.8.4. Recent Developments
- 11.2.8.5. Financials (Based on Availability)
- 11.2.9 Guoxuan High-Tech
- 11.2.9.1. Overview
- 11.2.9.2. Products
- 11.2.9.3. SWOT Analysis
- 11.2.9.4. Recent Developments
- 11.2.9.5. Financials (Based on Availability)
- 11.2.10 Pride Power
- 11.2.10.1. Overview
- 11.2.10.2. Products
- 11.2.10.3. SWOT Analysis
- 11.2.10.4. Recent Developments
- 11.2.10.5. Financials (Based on Availability)
- 11.2.11 Shanghai Advanced Traction Battery Systems Co Ltd
- 11.2.11.1. Overview
- 11.2.11.2. Products
- 11.2.11.3. SWOT Analysis
- 11.2.11.4. Recent Developments
- 11.2.11.5. Financials (Based on Availability)
- 11.2.12 Chang'an New Energy
- 11.2.12.1. Overview
- 11.2.12.2. Products
- 11.2.12.3. SWOT Analysis
- 11.2.12.4. Recent Developments
- 11.2.12.5. Financials (Based on Availability)
- 11.2.13 Pride Power
- 11.2.13.1. Overview
- 11.2.13.2. Products
- 11.2.13.3. SWOT Analysis
- 11.2.13.4. Recent Developments
- 11.2.13.5. Financials (Based on Availability)
- 11.2.14 SINOEV Technologies
- 11.2.14.1. Overview
- 11.2.14.2. Products
- 11.2.14.3. SWOT Analysis
- 11.2.14.4. Recent Developments
- 11.2.14.5. Financials (Based on Availability)
- 11.2.15 Zhuhai CosMX Battery Co Ltd
- 11.2.15.1. Overview
- 11.2.15.2. Products
- 11.2.15.3. SWOT Analysis
- 11.2.15.4. Recent Developments
- 11.2.15.5. Financials (Based on Availability)
- 11.2.1 CATL
List of Figures
- Figure 1: Global Power Battery Pack Revenue Breakdown (million, %) by Region 2025 & 2033
- Figure 2: North America Power Battery Pack Revenue (million), by Application 2025 & 2033
- Figure 3: North America Power Battery Pack Revenue Share (%), by Application 2025 & 2033
- Figure 4: North America Power Battery Pack Revenue (million), by Types 2025 & 2033
- Figure 5: North America Power Battery Pack Revenue Share (%), by Types 2025 & 2033
- Figure 6: North America Power Battery Pack Revenue (million), by Country 2025 & 2033
- Figure 7: North America Power Battery Pack Revenue Share (%), by Country 2025 & 2033
- Figure 8: South America Power Battery Pack Revenue (million), by Application 2025 & 2033
- Figure 9: South America Power Battery Pack Revenue Share (%), by Application 2025 & 2033
- Figure 10: South America Power Battery Pack Revenue (million), by Types 2025 & 2033
- Figure 11: South America Power Battery Pack Revenue Share (%), by Types 2025 & 2033
- Figure 12: South America Power Battery Pack Revenue (million), by Country 2025 & 2033
- Figure 13: South America Power Battery Pack Revenue Share (%), by Country 2025 & 2033
- Figure 14: Europe Power Battery Pack Revenue (million), by Application 2025 & 2033
- Figure 15: Europe Power Battery Pack Revenue Share (%), by Application 2025 & 2033
- Figure 16: Europe Power Battery Pack Revenue (million), by Types 2025 & 2033
- Figure 17: Europe Power Battery Pack Revenue Share (%), by Types 2025 & 2033
- Figure 18: Europe Power Battery Pack Revenue (million), by Country 2025 & 2033
- Figure 19: Europe Power Battery Pack Revenue Share (%), by Country 2025 & 2033
- Figure 20: Middle East & Africa Power Battery Pack Revenue (million), by Application 2025 & 2033
- Figure 21: Middle East & Africa Power Battery Pack Revenue Share (%), by Application 2025 & 2033
- Figure 22: Middle East & Africa Power Battery Pack Revenue (million), by Types 2025 & 2033
- Figure 23: Middle East & Africa Power Battery Pack Revenue Share (%), by Types 2025 & 2033
- Figure 24: Middle East & Africa Power Battery Pack Revenue (million), by Country 2025 & 2033
- Figure 25: Middle East & Africa Power Battery Pack Revenue Share (%), by Country 2025 & 2033
- Figure 26: Asia Pacific Power Battery Pack Revenue (million), by Application 2025 & 2033
- Figure 27: Asia Pacific Power Battery Pack Revenue Share (%), by Application 2025 & 2033
- Figure 28: Asia Pacific Power Battery Pack Revenue (million), by Types 2025 & 2033
- Figure 29: Asia Pacific Power Battery Pack Revenue Share (%), by Types 2025 & 2033
- Figure 30: Asia Pacific Power Battery Pack Revenue (million), by Country 2025 & 2033
- Figure 31: Asia Pacific Power Battery Pack Revenue Share (%), by Country 2025 & 2033
List of Tables
- Table 1: Global Power Battery Pack Revenue million Forecast, by Application 2020 & 2033
- Table 2: Global Power Battery Pack Revenue million Forecast, by Types 2020 & 2033
- Table 3: Global Power Battery Pack Revenue million Forecast, by Region 2020 & 2033
- Table 4: Global Power Battery Pack Revenue million Forecast, by Application 2020 & 2033
- Table 5: Global Power Battery Pack Revenue million Forecast, by Types 2020 & 2033
- Table 6: Global Power Battery Pack Revenue million Forecast, by Country 2020 & 2033
- Table 7: United States Power Battery Pack Revenue (million) Forecast, by Application 2020 & 2033
- Table 8: Canada Power Battery Pack Revenue (million) Forecast, by Application 2020 & 2033
- Table 9: Mexico Power Battery Pack Revenue (million) Forecast, by Application 2020 & 2033
- Table 10: Global Power Battery Pack Revenue million Forecast, by Application 2020 & 2033
- Table 11: Global Power Battery Pack Revenue million Forecast, by Types 2020 & 2033
- Table 12: Global Power Battery Pack Revenue million Forecast, by Country 2020 & 2033
- Table 13: Brazil Power Battery Pack Revenue (million) Forecast, by Application 2020 & 2033
- Table 14: Argentina Power Battery Pack Revenue (million) Forecast, by Application 2020 & 2033
- Table 15: Rest of South America Power Battery Pack Revenue (million) Forecast, by Application 2020 & 2033
- Table 16: Global Power Battery Pack Revenue million Forecast, by Application 2020 & 2033
- Table 17: Global Power Battery Pack Revenue million Forecast, by Types 2020 & 2033
- Table 18: Global Power Battery Pack Revenue million Forecast, by Country 2020 & 2033
- Table 19: United Kingdom Power Battery Pack Revenue (million) Forecast, by Application 2020 & 2033
- Table 20: Germany Power Battery Pack Revenue (million) Forecast, by Application 2020 & 2033
- Table 21: France Power Battery Pack Revenue (million) Forecast, by Application 2020 & 2033
- Table 22: Italy Power Battery Pack Revenue (million) Forecast, by Application 2020 & 2033
- Table 23: Spain Power Battery Pack Revenue (million) Forecast, by Application 2020 & 2033
- Table 24: Russia Power Battery Pack Revenue (million) Forecast, by Application 2020 & 2033
- Table 25: Benelux Power Battery Pack Revenue (million) Forecast, by Application 2020 & 2033
- Table 26: Nordics Power Battery Pack Revenue (million) Forecast, by Application 2020 & 2033
- Table 27: Rest of Europe Power Battery Pack Revenue (million) Forecast, by Application 2020 & 2033
- Table 28: Global Power Battery Pack Revenue million Forecast, by Application 2020 & 2033
- Table 29: Global Power Battery Pack Revenue million Forecast, by Types 2020 & 2033
- Table 30: Global Power Battery Pack Revenue million Forecast, by Country 2020 & 2033
- Table 31: Turkey Power Battery Pack Revenue (million) Forecast, by Application 2020 & 2033
- Table 32: Israel Power Battery Pack Revenue (million) Forecast, by Application 2020 & 2033
- Table 33: GCC Power Battery Pack Revenue (million) Forecast, by Application 2020 & 2033
- Table 34: North Africa Power Battery Pack Revenue (million) Forecast, by Application 2020 & 2033
- Table 35: South Africa Power Battery Pack Revenue (million) Forecast, by Application 2020 & 2033
- Table 36: Rest of Middle East & Africa Power Battery Pack Revenue (million) Forecast, by Application 2020 & 2033
- Table 37: Global Power Battery Pack Revenue million Forecast, by Application 2020 & 2033
- Table 38: Global Power Battery Pack Revenue million Forecast, by Types 2020 & 2033
- Table 39: Global Power Battery Pack Revenue million Forecast, by Country 2020 & 2033
- Table 40: China Power Battery Pack Revenue (million) Forecast, by Application 2020 & 2033
- Table 41: India Power Battery Pack Revenue (million) Forecast, by Application 2020 & 2033
- Table 42: Japan Power Battery Pack Revenue (million) Forecast, by Application 2020 & 2033
- Table 43: South Korea Power Battery Pack Revenue (million) Forecast, by Application 2020 & 2033
- Table 44: ASEAN Power Battery Pack Revenue (million) Forecast, by Application 2020 & 2033
- Table 45: Oceania Power Battery Pack Revenue (million) Forecast, by Application 2020 & 2033
- Table 46: Rest of Asia Pacific Power Battery Pack Revenue (million) Forecast, by Application 2020 & 2033
Frequently Asked Questions
1. What is the projected Compound Annual Growth Rate (CAGR) of the Power Battery Pack?
The projected CAGR is approximately XX%.
2. Which companies are prominent players in the Power Battery Pack?
Key companies in the market include CATL, LG Chem, Panasonic, Samsung SDI, SKI, BYD, AESC, CALB, Guoxuan High-Tech, Pride Power, Shanghai Advanced Traction Battery Systems Co Ltd, Chang'an New Energy, Pride Power, SINOEV Technologies, Zhuhai CosMX Battery Co Ltd.
3. What are the main segments of the Power Battery Pack?
The market segments include Application, Types.
4. Can you provide details about the market size?
The market size is estimated to be USD XXX million as of 2022.
5. What are some drivers contributing to market growth?
N/A
6. What are the notable trends driving market growth?
N/A
7. Are there any restraints impacting market growth?
N/A
8. Can you provide examples of recent developments in the market?
N/A
9. What pricing options are available for accessing the report?
Pricing options include single-user, multi-user, and enterprise licenses priced at USD 4900.00, USD 7350.00, and USD 9800.00 respectively.
10. Is the market size provided in terms of value or volume?
The market size is provided in terms of value, measured in million.
11. Are there any specific market keywords associated with the report?
Yes, the market keyword associated with the report is "Power Battery Pack," which aids in identifying and referencing the specific market segment covered.
12. How do I determine which pricing option suits my needs best?
The pricing options vary based on user requirements and access needs. Individual users may opt for single-user licenses, while businesses requiring broader access may choose multi-user or enterprise licenses for cost-effective access to the report.
13. Are there any additional resources or data provided in the Power Battery Pack report?
While the report offers comprehensive insights, it's advisable to review the specific contents or supplementary materials provided to ascertain if additional resources or data are available.
14. How can I stay updated on further developments or reports in the Power Battery Pack?
To stay informed about further developments, trends, and reports in the Power Battery Pack, consider subscribing to industry newsletters, following relevant companies and organizations, or regularly checking reputable industry news sources and publications.
Methodology
Step 1 - Identification of Relevant Samples Size from Population Database


Step 2 - Approaches for Defining Global Market Size (Value, Volume* & Price*)

Note*: In applicable scenarios
Step 3 - Data Sources
Primary Research
- Web Analytics
- Survey Reports
- Research Institute
- Latest Research Reports
- Opinion Leaders
Secondary Research
- Annual Reports
- White Paper
- Latest Press Release
- Industry Association
- Paid Database
- Investor Presentations

Step 4 - Data Triangulation
Involves using different sources of information in order to increase the validity of a study
These sources are likely to be stakeholders in a program - participants, other researchers, program staff, other community members, and so on.
Then we put all data in single framework & apply various statistical tools to find out the dynamic on the market.
During the analysis stage, feedback from the stakeholder groups would be compared to determine areas of agreement as well as areas of divergence