

Key Insights
The global plastic caps and closures market is forecast to reach 53.73 billion by 2033, expanding at a Compound Annual Growth Rate (CAGR) of 3.2% from the base year 2025. This growth is propelled by key industry drivers, including the expanding food and beverage sector's demand for convenient and tamper-evident packaging, and the pharmaceutical industry's need for secure, sterile closures. The rise of e-commerce and single-serve packaging further fuels demand. Innovations in materials science are yielding lighter, more durable, and recyclable solutions. However, environmental concerns and regulatory pressures to reduce plastic waste present significant market restraints. The market is segmented by application (food, pharmaceutical, beverage, cosmetics) and raw material (PP, HDPE, LDPE). Key industry players like Aptar Group Inc., Ball Corporation, and Amcor Ltd. are driving innovation and expansion. Emerging economies in Asia-Pacific and South America offer strong growth potential due to rising disposable incomes, while North America and Europe remain significant contributors through their established consumer goods industries.
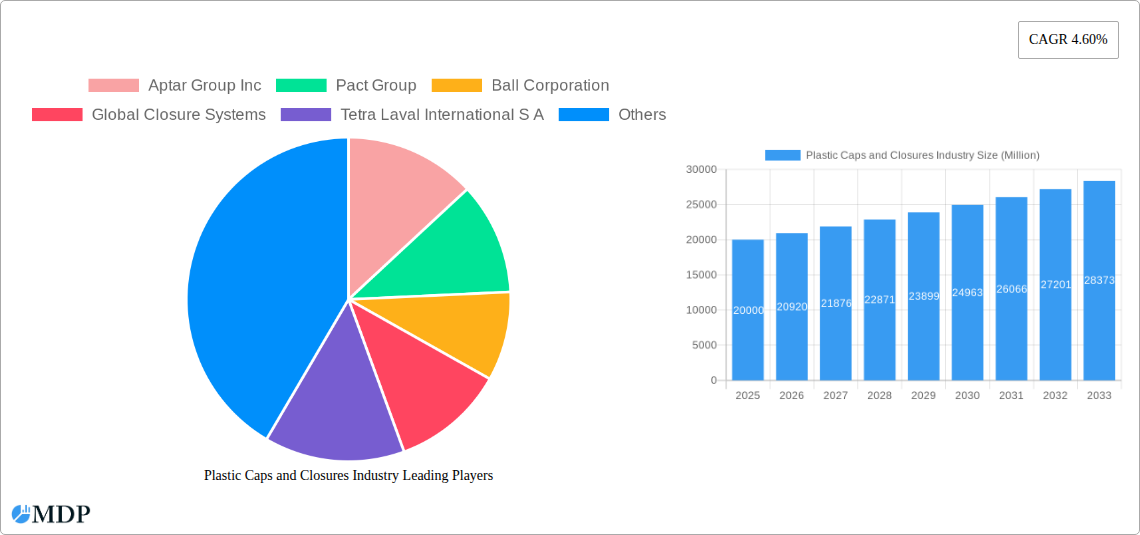
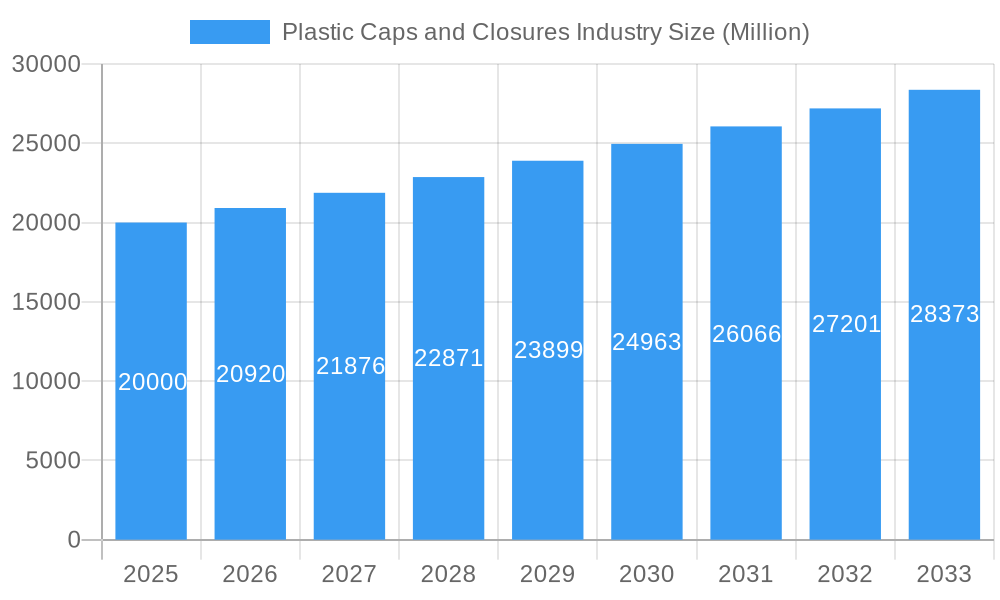
Plastic Caps and Closures Industry Market Size (In Billion)
The competitive landscape features established multinational corporations and regional players. Successful strategies focus on delivering innovative and sustainable solutions, including recyclable and biodegradable materials, enhanced tamper-evident features, and customized offerings. Future market success will depend on navigating environmental regulations, embracing circular economy principles, and continuous innovation to meet evolving consumer demands for convenience and sustainability. The transition to sustainable packaging practices offers both challenges and opportunities, requiring a focus on lightweighting, recyclability, and the adoption of alternative materials for sustained growth.
Plastic Caps and Closures Industry Company Market Share
Plastic Caps and Closures Industry Market Report: 2019-2033
Dive deep into the dynamic world of plastic caps and closures with this comprehensive market report, projecting a xx Million USD market by 2033. This in-depth analysis covers market dynamics, leading players, emerging trends, and future opportunities within the global plastic caps and closures industry, providing invaluable insights for stakeholders across the value chain. The report utilizes data from the historical period (2019-2024), base year (2025), and estimated year (2025) to forecast market trends until 2033.
Plastic Caps and Closures Industry Market Dynamics & Concentration
This section analyzes the competitive landscape of the plastic caps and closures market, assessing market concentration, innovation drivers, regulatory frameworks, product substitutes, end-user trends, and M&A activities.
The global plastic caps and closures market is characterized by a moderately concentrated structure with a few key players holding significant market share. The top 10 companies account for approximately xx% of the global market. Innovation is a key driver, with companies constantly developing new materials and designs to meet evolving consumer demands and regulatory requirements. Stringent regulations regarding material safety and recyclability are shaping industry practices and influencing product development. The presence of substitute materials, such as metal and paper-based closures, creates competitive pressure. End-user trends, particularly the growing demand for sustainable and convenient packaging solutions, are influencing market growth. M&A activities have been relatively frequent in recent years, with xx major deals recorded between 2019 and 2024, reflecting consolidation within the industry.
- Market Concentration: Top 10 players hold approximately xx% market share.
- M&A Activity: xx major deals recorded between 2019 and 2024.
- Key Innovation Drivers: Sustainable materials, improved tamper-evidence, lightweight designs.
- Regulatory Landscape: Increasing focus on recyclability and material safety.
Plastic Caps and Closures Industry Industry Trends & Analysis
The plastic caps and closures market is experiencing robust growth, driven by several factors. The increasing demand for packaged goods across various sectors fuels market expansion, particularly in developing economies. Technological advancements, such as the development of lightweight and sustainable materials, contribute to efficiency gains and reduce environmental impact. Consumer preferences are shifting towards convenience and tamper-evident packaging, pushing innovation in closure designs. Competitive dynamics are intense, with companies focusing on differentiation through product innovation, branding, and cost optimization. The market is expected to witness a Compound Annual Growth Rate (CAGR) of xx% during the forecast period (2025-2033), with a market penetration rate reaching xx% by 2033.
Leading Markets & Segments in Plastic Caps and Closures Industry
The global market is segmented by application (Food, Pharmaceutical, Beverage, Cosmetics and Toiletries, Other Applications) and raw material (PP, HDPE, LDPE, Other Raw Materials). The beverage segment currently holds the largest market share, driven by high consumption of beverages worldwide. The food and pharmaceutical segments are also experiencing significant growth. PP (Polypropylene) is the dominant raw material, due to its versatility, cost-effectiveness, and recyclability. Growth is expected to be driven by Asia-Pacific, owing to factors such as rising disposable incomes, increasing demand for packaged goods, and favorable government policies supporting the food and beverage industry.
- Dominant Application Segment: Beverage
- Dominant Raw Material: PP (Polypropylene)
- Fastest-Growing Region: Asia-Pacific
Key Drivers for Asia-Pacific:
- Rapidly growing middle class with increasing disposable incomes.
- Expanding food and beverage industry.
- Government initiatives promoting packaging industry development.
- Favorable infrastructure for packaging production and distribution.
Plastic Caps and Closures Industry Product Developments
Recent product developments focus on enhanced functionality, sustainability, and improved consumer experience. The introduction of innovative closures like the IMF-5 In-Mold Flexspout tamper-evident closure demonstrates the industry’s commitment to enhancing product security and combating counterfeiting. This trend reflects a broader industry shift towards eco-friendly materials, improved recyclability, and solutions that cater to convenience-driven consumer demands.
Key Drivers of Plastic Caps and Closures Industry Growth
The industry's growth is propelled by several factors. The booming global packaged food and beverage sector is a major driver. Technological advancements in materials science and manufacturing processes enhance product quality and efficiency. Favorable economic conditions in several regions, particularly emerging markets, fuel consumption of packaged goods. Regulatory support for sustainable packaging solutions further incentivizes growth.
Challenges in the Plastic Caps and Closures Industry Market
The industry faces challenges such as fluctuating raw material prices, impacting profitability. Stringent environmental regulations regarding plastic waste pose considerable operational challenges and necessitate investments in sustainable solutions. Intense competition from established and emerging players necessitates continuous innovation and cost optimization.
Emerging Opportunities in Plastic Caps and Closures Industry
The future holds significant potential for growth. The increasing demand for sustainable and eco-friendly packaging opens up opportunities for biodegradable and compostable closure solutions. Strategic partnerships and collaborations between closure manufacturers and packaging companies can unlock synergies and expand market reach. Expansion into emerging markets with high growth potential represents a significant opportunity.
Leading Players in the Plastic Caps and Closures Industry Sector
- Aptar Group Inc
- Pact Group
- Ball Corporation
- Global Closure Systems
- Tetra Laval International S A
- Guala Closures Group
- Crown Holdings Inc
- BERICAP GmbH & Co K
- Evergreen Packaging Inc
- Albéa S A
- Berry Global Inc
- Silgan Holdings Inc
- Amcor Ltd
Key Milestones in Plastic Caps and Closures Industry Industry
- February 2022: BERICAP wins TOP 100 award for innovation in closure technology.
- December 2022: Rieke introduces the IMF-5 In-Mold Flexspout tamper-evident closure.
Strategic Outlook for Plastic Caps and Closures Industry Market
The plastic caps and closures market is poised for sustained growth, driven by technological advancements, increasing demand for sustainable packaging, and expansion into new markets. Strategic investments in research and development, focus on sustainable materials, and proactive engagement with regulatory bodies will be crucial for long-term success. The market is expected to witness further consolidation through mergers and acquisitions, creating larger, more diversified players.
Plastic Caps and Closures Industry Segmentation
-
1. Application
- 1.1. Food
- 1.2. Pharmaceutical
- 1.3. Beverage
- 1.4. Cosmetics and Toiletries
- 1.5. Other Applications
-
2. Raw Material
- 2.1. PP
- 2.2. HDPE
- 2.3. LDPE
- 2.4. Other Raw Materials
Plastic Caps and Closures Industry Segmentation By Geography
-
1. North America
- 1.1. United States
- 1.2. Canada
-
2. Europe
- 2.1. United Kingdom
- 2.2. Germany
- 2.3. France
- 2.4. Italy
- 2.5. Rest of Europe
-
3. Asia Pacific
- 3.1. China
- 3.2. Japan
- 3.3. India
- 3.4. South Korea
- 3.5. Australia
- 3.6. Rest of Asia Pacific
-
4. Latin America
- 4.1. Brazil
- 4.2. Argentina
- 4.3. Rest of Latin America
- 5. Middle East
-
6. United Arab Emirates
- 6.1. Saudi Arabia
- 6.2. South Africa
- 6.3. Rest of Middle East
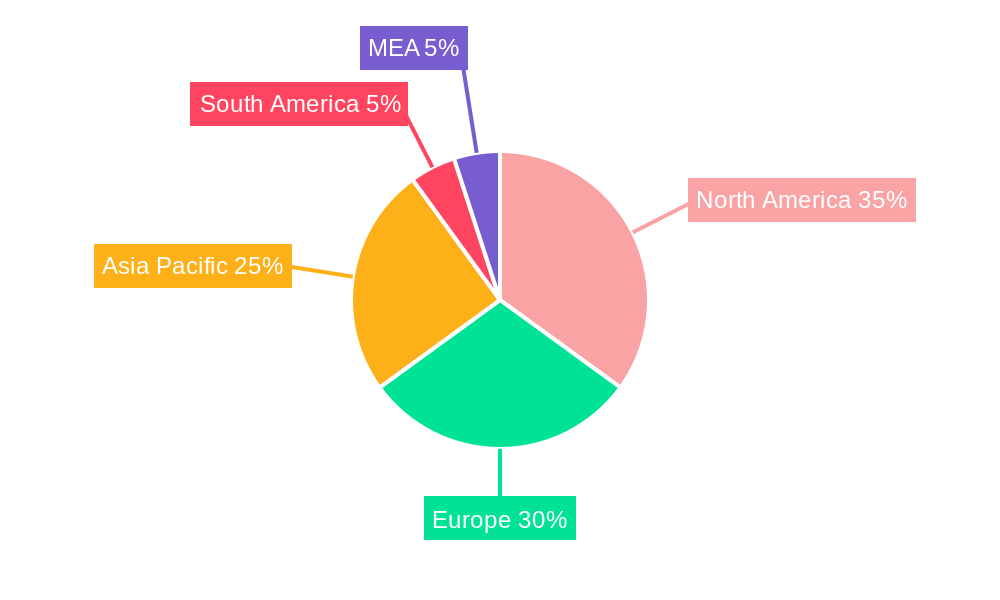
Plastic Caps and Closures Industry Regional Market Share
Geographic Coverage of Plastic Caps and Closures Industry
Plastic Caps and Closures Industry REPORT HIGHLIGHTS
| Aspects | Details |
|---|---|
| Study Period | 2020-2034 |
| Base Year | 2025 |
| Estimated Year | 2026 |
| Forecast Period | 2026-2034 |
| Historical Period | 2020-2025 |
| Growth Rate | CAGR of 3.2% from 2020-2034 |
| Segmentation |
|
Table of Contents
- 1. Introduction
- 1.1. Research Scope
- 1.2. Market Segmentation
- 1.3. Research Objective
- 1.4. Definitions and Assumptions
- 2. Executive Summary
- 2.1. Market Snapshot
- 3. Market Dynamics
- 3.1. Market Drivers
- 3.2. Market Restrains
- 3.3. Market Trends
- 3.4. Market Opportunities
- 4. Market Factor Analysis
- 4.1. Porters Five Forces
- 4.1.1. Bargaining Power of Suppliers
- 4.1.2. Bargaining Power of Buyers
- 4.1.3. Threat of New Entrants
- 4.1.4. Threat of Substitutes
- 4.1.5. Competitive Rivalry
- 4.2. PESTEL analysis
- 4.3. BCG Analysis
- 4.3.1. Stars (High Growth, High Market Share)
- 4.3.2. Cash Cows (Low Growth, High Market Share)
- 4.3.3. Question Mark (High Growth, Low Market Share)
- 4.3.4. Dogs (Low Growth, Low Market Share)
- 4.4. Ansoff Matrix Analysis
- 4.5. Supply Chain Analysis
- 4.6. Regulatory Landscape
- 4.7. Current Market Potential and Opportunity Assessment (TAM–SAM–SOM Framework)
- 4.8. MDP Analyst Note
- 4.1. Porters Five Forces
- 5. Market Analysis, Insights and Forecast 2021-2033
- 5.1. Market Analysis, Insights and Forecast - by Application
- 5.1.1. Food
- 5.1.2. Pharmaceutical
- 5.1.3. Beverage
- 5.1.4. Cosmetics and Toiletries
- 5.1.5. Other Applications
- 5.2. Market Analysis, Insights and Forecast - by Raw Material
- 5.2.1. PP
- 5.2.2. HDPE
- 5.2.3. LDPE
- 5.2.4. Other Raw Materials
- 5.3. Market Analysis, Insights and Forecast - by Region
- 5.3.1. North America
- 5.3.2. Europe
- 5.3.3. Asia Pacific
- 5.3.4. Latin America
- 5.3.5. Middle East
- 5.3.6. United Arab Emirates
- 5.1. Market Analysis, Insights and Forecast - by Application
- 6. Global Plastic Caps and Closures Industry Analysis, Insights and Forecast, 2021-2033
- 6.1. Market Analysis, Insights and Forecast - by Application
- 6.1.1. Food
- 6.1.2. Pharmaceutical
- 6.1.3. Beverage
- 6.1.4. Cosmetics and Toiletries
- 6.1.5. Other Applications
- 6.2. Market Analysis, Insights and Forecast - by Raw Material
- 6.2.1. PP
- 6.2.2. HDPE
- 6.2.3. LDPE
- 6.2.4. Other Raw Materials
- 6.1. Market Analysis, Insights and Forecast - by Application
- 7. North America Plastic Caps and Closures Industry Analysis, Insights and Forecast, 2020-2032
- 7.1. Market Analysis, Insights and Forecast - by Application
- 7.1.1. Food
- 7.1.2. Pharmaceutical
- 7.1.3. Beverage
- 7.1.4. Cosmetics and Toiletries
- 7.1.5. Other Applications
- 7.2. Market Analysis, Insights and Forecast - by Raw Material
- 7.2.1. PP
- 7.2.2. HDPE
- 7.2.3. LDPE
- 7.2.4. Other Raw Materials
- 7.1. Market Analysis, Insights and Forecast - by Application
- 8. Europe Plastic Caps and Closures Industry Analysis, Insights and Forecast, 2020-2032
- 8.1. Market Analysis, Insights and Forecast - by Application
- 8.1.1. Food
- 8.1.2. Pharmaceutical
- 8.1.3. Beverage
- 8.1.4. Cosmetics and Toiletries
- 8.1.5. Other Applications
- 8.2. Market Analysis, Insights and Forecast - by Raw Material
- 8.2.1. PP
- 8.2.2. HDPE
- 8.2.3. LDPE
- 8.2.4. Other Raw Materials
- 8.1. Market Analysis, Insights and Forecast - by Application
- 9. Asia Pacific Plastic Caps and Closures Industry Analysis, Insights and Forecast, 2020-2032
- 9.1. Market Analysis, Insights and Forecast - by Application
- 9.1.1. Food
- 9.1.2. Pharmaceutical
- 9.1.3. Beverage
- 9.1.4. Cosmetics and Toiletries
- 9.1.5. Other Applications
- 9.2. Market Analysis, Insights and Forecast - by Raw Material
- 9.2.1. PP
- 9.2.2. HDPE
- 9.2.3. LDPE
- 9.2.4. Other Raw Materials
- 9.1. Market Analysis, Insights and Forecast - by Application
- 10. Latin America Plastic Caps and Closures Industry Analysis, Insights and Forecast, 2020-2032
- 10.1. Market Analysis, Insights and Forecast - by Application
- 10.1.1. Food
- 10.1.2. Pharmaceutical
- 10.1.3. Beverage
- 10.1.4. Cosmetics and Toiletries
- 10.1.5. Other Applications
- 10.2. Market Analysis, Insights and Forecast - by Raw Material
- 10.2.1. PP
- 10.2.2. HDPE
- 10.2.3. LDPE
- 10.2.4. Other Raw Materials
- 10.1. Market Analysis, Insights and Forecast - by Application
- 11. Middle East Plastic Caps and Closures Industry Analysis, Insights and Forecast, 2020-2032
- 11.1. Market Analysis, Insights and Forecast - by Application
- 11.1.1. Food
- 11.1.2. Pharmaceutical
- 11.1.3. Beverage
- 11.1.4. Cosmetics and Toiletries
- 11.1.5. Other Applications
- 11.2. Market Analysis, Insights and Forecast - by Raw Material
- 11.2.1. PP
- 11.2.2. HDPE
- 11.2.3. LDPE
- 11.2.4. Other Raw Materials
- 11.1. Market Analysis, Insights and Forecast - by Application
- 12. United Arab Emirates Plastic Caps and Closures Industry Analysis, Insights and Forecast, 2020-2032
- 12.1. Market Analysis, Insights and Forecast - by Application
- 12.1.1. Food
- 12.1.2. Pharmaceutical
- 12.1.3. Beverage
- 12.1.4. Cosmetics and Toiletries
- 12.1.5. Other Applications
- 12.2. Market Analysis, Insights and Forecast - by Raw Material
- 12.2.1. PP
- 12.2.2. HDPE
- 12.2.3. LDPE
- 12.2.4. Other Raw Materials
- 12.1. Market Analysis, Insights and Forecast - by Application
- 13. Competitive Analysis
- 13.1. Company Profiles
- 13.1.1 Aptar Group Inc
- 13.1.1.1. Company Overview
- 13.1.1.2. Products
- 13.1.1.3. Company Financials
- 13.1.1.4. SWOT Analysis
- 13.1.2 Pact Group
- 13.1.2.1. Company Overview
- 13.1.2.2. Products
- 13.1.2.3. Company Financials
- 13.1.2.4. SWOT Analysis
- 13.1.3 Ball Corporation
- 13.1.3.1. Company Overview
- 13.1.3.2. Products
- 13.1.3.3. Company Financials
- 13.1.3.4. SWOT Analysis
- 13.1.4 Global Closure Systems
- 13.1.4.1. Company Overview
- 13.1.4.2. Products
- 13.1.4.3. Company Financials
- 13.1.4.4. SWOT Analysis
- 13.1.5 Tetra Laval International S A
- 13.1.5.1. Company Overview
- 13.1.5.2. Products
- 13.1.5.3. Company Financials
- 13.1.5.4. SWOT Analysis
- 13.1.6 Guala Closures Group
- 13.1.6.1. Company Overview
- 13.1.6.2. Products
- 13.1.6.3. Company Financials
- 13.1.6.4. SWOT Analysis
- 13.1.7 Crown Holdings Inc
- 13.1.7.1. Company Overview
- 13.1.7.2. Products
- 13.1.7.3. Company Financials
- 13.1.7.4. SWOT Analysis
- 13.1.8 BERICAP GmbH & Co K
- 13.1.8.1. Company Overview
- 13.1.8.2. Products
- 13.1.8.3. Company Financials
- 13.1.8.4. SWOT Analysis
- 13.1.9 Evergreen Packaging Inc
- 13.1.9.1. Company Overview
- 13.1.9.2. Products
- 13.1.9.3. Company Financials
- 13.1.9.4. SWOT Analysis
- 13.1.10 Albéa S A
- 13.1.10.1. Company Overview
- 13.1.10.2. Products
- 13.1.10.3. Company Financials
- 13.1.10.4. SWOT Analysis
- 13.1.11 Berry Global Inc
- 13.1.11.1. Company Overview
- 13.1.11.2. Products
- 13.1.11.3. Company Financials
- 13.1.11.4. SWOT Analysis
- 13.1.12 Silgan Holdings Inc
- 13.1.12.1. Company Overview
- 13.1.12.2. Products
- 13.1.12.3. Company Financials
- 13.1.12.4. SWOT Analysis
- 13.1.13 Amcor Ltd
- 13.1.13.1. Company Overview
- 13.1.13.2. Products
- 13.1.13.3. Company Financials
- 13.1.13.4. SWOT Analysis
- 13.1.1 Aptar Group Inc
- 13.2. Market Entropy
- 13.2.1 Company's Key Areas Served
- 13.2.2 Recent Developments
- 13.3. Company Market Share Analysis 2025
- 13.3.1 Top 5 Companies Market Share Analysis
- 13.3.2 Top 3 Companies Market Share Analysis
- 13.4. List of Potential Customers
- 14. Research Methodology
List of Figures
- Figure 1: Global Plastic Caps and Closures Industry Revenue Breakdown (billion, %) by Region 2025 & 2033
- Figure 2: North America Plastic Caps and Closures Industry Revenue (billion), by Application 2025 & 2033
- Figure 3: North America Plastic Caps and Closures Industry Revenue Share (%), by Application 2025 & 2033
- Figure 4: North America Plastic Caps and Closures Industry Revenue (billion), by Raw Material 2025 & 2033
- Figure 5: North America Plastic Caps and Closures Industry Revenue Share (%), by Raw Material 2025 & 2033
- Figure 6: North America Plastic Caps and Closures Industry Revenue (billion), by Country 2025 & 2033
- Figure 7: North America Plastic Caps and Closures Industry Revenue Share (%), by Country 2025 & 2033
- Figure 8: Europe Plastic Caps and Closures Industry Revenue (billion), by Application 2025 & 2033
- Figure 9: Europe Plastic Caps and Closures Industry Revenue Share (%), by Application 2025 & 2033
- Figure 10: Europe Plastic Caps and Closures Industry Revenue (billion), by Raw Material 2025 & 2033
- Figure 11: Europe Plastic Caps and Closures Industry Revenue Share (%), by Raw Material 2025 & 2033
- Figure 12: Europe Plastic Caps and Closures Industry Revenue (billion), by Country 2025 & 2033
- Figure 13: Europe Plastic Caps and Closures Industry Revenue Share (%), by Country 2025 & 2033
- Figure 14: Asia Pacific Plastic Caps and Closures Industry Revenue (billion), by Application 2025 & 2033
- Figure 15: Asia Pacific Plastic Caps and Closures Industry Revenue Share (%), by Application 2025 & 2033
- Figure 16: Asia Pacific Plastic Caps and Closures Industry Revenue (billion), by Raw Material 2025 & 2033
- Figure 17: Asia Pacific Plastic Caps and Closures Industry Revenue Share (%), by Raw Material 2025 & 2033
- Figure 18: Asia Pacific Plastic Caps and Closures Industry Revenue (billion), by Country 2025 & 2033
- Figure 19: Asia Pacific Plastic Caps and Closures Industry Revenue Share (%), by Country 2025 & 2033
- Figure 20: Latin America Plastic Caps and Closures Industry Revenue (billion), by Application 2025 & 2033
- Figure 21: Latin America Plastic Caps and Closures Industry Revenue Share (%), by Application 2025 & 2033
- Figure 22: Latin America Plastic Caps and Closures Industry Revenue (billion), by Raw Material 2025 & 2033
- Figure 23: Latin America Plastic Caps and Closures Industry Revenue Share (%), by Raw Material 2025 & 2033
- Figure 24: Latin America Plastic Caps and Closures Industry Revenue (billion), by Country 2025 & 2033
- Figure 25: Latin America Plastic Caps and Closures Industry Revenue Share (%), by Country 2025 & 2033
- Figure 26: Middle East Plastic Caps and Closures Industry Revenue (billion), by Application 2025 & 2033
- Figure 27: Middle East Plastic Caps and Closures Industry Revenue Share (%), by Application 2025 & 2033
- Figure 28: Middle East Plastic Caps and Closures Industry Revenue (billion), by Raw Material 2025 & 2033
- Figure 29: Middle East Plastic Caps and Closures Industry Revenue Share (%), by Raw Material 2025 & 2033
- Figure 30: Middle East Plastic Caps and Closures Industry Revenue (billion), by Country 2025 & 2033
- Figure 31: Middle East Plastic Caps and Closures Industry Revenue Share (%), by Country 2025 & 2033
- Figure 32: United Arab Emirates Plastic Caps and Closures Industry Revenue (billion), by Application 2025 & 2033
- Figure 33: United Arab Emirates Plastic Caps and Closures Industry Revenue Share (%), by Application 2025 & 2033
- Figure 34: United Arab Emirates Plastic Caps and Closures Industry Revenue (billion), by Raw Material 2025 & 2033
- Figure 35: United Arab Emirates Plastic Caps and Closures Industry Revenue Share (%), by Raw Material 2025 & 2033
- Figure 36: United Arab Emirates Plastic Caps and Closures Industry Revenue (billion), by Country 2025 & 2033
- Figure 37: United Arab Emirates Plastic Caps and Closures Industry Revenue Share (%), by Country 2025 & 2033
List of Tables
- Table 1: Global Plastic Caps and Closures Industry Revenue billion Forecast, by Application 2020 & 2033
- Table 2: Global Plastic Caps and Closures Industry Revenue billion Forecast, by Raw Material 2020 & 2033
- Table 3: Global Plastic Caps and Closures Industry Revenue billion Forecast, by Region 2020 & 2033
- Table 4: Global Plastic Caps and Closures Industry Revenue billion Forecast, by Application 2020 & 2033
- Table 5: Global Plastic Caps and Closures Industry Revenue billion Forecast, by Raw Material 2020 & 2033
- Table 6: Global Plastic Caps and Closures Industry Revenue billion Forecast, by Country 2020 & 2033
- Table 7: United States Plastic Caps and Closures Industry Revenue (billion) Forecast, by Application 2020 & 2033
- Table 8: Canada Plastic Caps and Closures Industry Revenue (billion) Forecast, by Application 2020 & 2033
- Table 9: Global Plastic Caps and Closures Industry Revenue billion Forecast, by Application 2020 & 2033
- Table 10: Global Plastic Caps and Closures Industry Revenue billion Forecast, by Raw Material 2020 & 2033
- Table 11: Global Plastic Caps and Closures Industry Revenue billion Forecast, by Country 2020 & 2033
- Table 12: United Kingdom Plastic Caps and Closures Industry Revenue (billion) Forecast, by Application 2020 & 2033
- Table 13: Germany Plastic Caps and Closures Industry Revenue (billion) Forecast, by Application 2020 & 2033
- Table 14: France Plastic Caps and Closures Industry Revenue (billion) Forecast, by Application 2020 & 2033
- Table 15: Italy Plastic Caps and Closures Industry Revenue (billion) Forecast, by Application 2020 & 2033
- Table 16: Rest of Europe Plastic Caps and Closures Industry Revenue (billion) Forecast, by Application 2020 & 2033
- Table 17: Global Plastic Caps and Closures Industry Revenue billion Forecast, by Application 2020 & 2033
- Table 18: Global Plastic Caps and Closures Industry Revenue billion Forecast, by Raw Material 2020 & 2033
- Table 19: Global Plastic Caps and Closures Industry Revenue billion Forecast, by Country 2020 & 2033
- Table 20: China Plastic Caps and Closures Industry Revenue (billion) Forecast, by Application 2020 & 2033
- Table 21: Japan Plastic Caps and Closures Industry Revenue (billion) Forecast, by Application 2020 & 2033
- Table 22: India Plastic Caps and Closures Industry Revenue (billion) Forecast, by Application 2020 & 2033
- Table 23: South Korea Plastic Caps and Closures Industry Revenue (billion) Forecast, by Application 2020 & 2033
- Table 24: Australia Plastic Caps and Closures Industry Revenue (billion) Forecast, by Application 2020 & 2033
- Table 25: Rest of Asia Pacific Plastic Caps and Closures Industry Revenue (billion) Forecast, by Application 2020 & 2033
- Table 26: Global Plastic Caps and Closures Industry Revenue billion Forecast, by Application 2020 & 2033
- Table 27: Global Plastic Caps and Closures Industry Revenue billion Forecast, by Raw Material 2020 & 2033
- Table 28: Global Plastic Caps and Closures Industry Revenue billion Forecast, by Country 2020 & 2033
- Table 29: Brazil Plastic Caps and Closures Industry Revenue (billion) Forecast, by Application 2020 & 2033
- Table 30: Argentina Plastic Caps and Closures Industry Revenue (billion) Forecast, by Application 2020 & 2033
- Table 31: Rest of Latin America Plastic Caps and Closures Industry Revenue (billion) Forecast, by Application 2020 & 2033
- Table 32: Global Plastic Caps and Closures Industry Revenue billion Forecast, by Application 2020 & 2033
- Table 33: Global Plastic Caps and Closures Industry Revenue billion Forecast, by Raw Material 2020 & 2033
- Table 34: Global Plastic Caps and Closures Industry Revenue billion Forecast, by Country 2020 & 2033
- Table 35: Global Plastic Caps and Closures Industry Revenue billion Forecast, by Application 2020 & 2033
- Table 36: Global Plastic Caps and Closures Industry Revenue billion Forecast, by Raw Material 2020 & 2033
- Table 37: Global Plastic Caps and Closures Industry Revenue billion Forecast, by Country 2020 & 2033
- Table 38: Saudi Arabia Plastic Caps and Closures Industry Revenue (billion) Forecast, by Application 2020 & 2033
- Table 39: South Africa Plastic Caps and Closures Industry Revenue (billion) Forecast, by Application 2020 & 2033
- Table 40: Rest of Middle East Plastic Caps and Closures Industry Revenue (billion) Forecast, by Application 2020 & 2033
Frequently Asked Questions
1. What is the projected Compound Annual Growth Rate (CAGR) of the Plastic Caps and Closures Industry?
The projected CAGR is approximately 3.2%.
2. Which companies are prominent players in the Plastic Caps and Closures Industry?
Key companies in the market include Aptar Group Inc, Pact Group, Ball Corporation, Global Closure Systems, Tetra Laval International S A, Guala Closures Group, Crown Holdings Inc, BERICAP GmbH & Co K, Evergreen Packaging Inc, Albéa S A, Berry Global Inc, Silgan Holdings Inc, Amcor Ltd.
3. What are the main segments of the Plastic Caps and Closures Industry?
The market segments include Application, Raw Material.
4. Can you provide details about the market size?
The market size is estimated to be USD 53.73 billion as of 2022.
5. What are some drivers contributing to market growth?
Demand for Packaged Food and Pharmaceutical Drugs; Increasing Demand from Small and Medium Scale End-user Industries.
6. What are the notable trends driving market growth?
Polypropylene Material to Account for a Significant Share.
7. Are there any restraints impacting market growth?
Lightweight and Cost-effective Stand-up Pouch Packaging Alternatives.
8. Can you provide examples of recent developments in the market?
December 2022 - The IMF-5 In-Mold Flexspout tamper-evident closure for plastic pails was just introduced by Rieke, a TriMas Packaging Brand, to give its customers better brand and product security. Product piracy and counterfeiting are the main issues facing the increasingly interconnected global economy.
9. What pricing options are available for accessing the report?
Pricing options include single-user, multi-user, and enterprise licenses priced at USD 4750, USD 5250, and USD 8750 respectively.
10. Is the market size provided in terms of value or volume?
The market size is provided in terms of value, measured in billion.
11. Are there any specific market keywords associated with the report?
Yes, the market keyword associated with the report is "Plastic Caps and Closures Industry," which aids in identifying and referencing the specific market segment covered.
12. How do I determine which pricing option suits my needs best?
The pricing options vary based on user requirements and access needs. Individual users may opt for single-user licenses, while businesses requiring broader access may choose multi-user or enterprise licenses for cost-effective access to the report.
13. Are there any additional resources or data provided in the Plastic Caps and Closures Industry report?
While the report offers comprehensive insights, it's advisable to review the specific contents or supplementary materials provided to ascertain if additional resources or data are available.
14. How can I stay updated on further developments or reports in the Plastic Caps and Closures Industry?
To stay informed about further developments, trends, and reports in the Plastic Caps and Closures Industry, consider subscribing to industry newsletters, following relevant companies and organizations, or regularly checking reputable industry news sources and publications.
Methodology
Step 1 - Identification of Relevant Samples Size from Population Database


Step 2 - Approaches for Defining Global Market Size (Value, Volume* & Price*)

Note*: In applicable scenarios
Step 3 - Data Sources
Primary Research
- Web Analytics
- Survey Reports
- Research Institute
- Latest Research Reports
- Opinion Leaders
Secondary Research
- Annual Reports
- White Paper
- Latest Press Release
- Industry Association
- Paid Database
- Investor Presentations

Step 4 - Data Triangulation
Involves using different sources of information in order to increase the validity of a study
These sources are likely to be stakeholders in a program - participants, other researchers, program staff, other community members, and so on.
Then we put all data in single framework & apply various statistical tools to find out the dynamic on the market.
During the analysis stage, feedback from the stakeholder groups would be compared to determine areas of agreement as well as areas of divergence